The analog I first posted about on the 9th [see: Analog Details] has performed well this past week. Given the overnight action in the futures, it’s about to get a boost in the right direction.
A perfectly formed H&S pattern would mean a right shoulder in the 1400 range. Though, as we pointed out yesterday, we already have enough of a right shoulder to matter.
For anyone interested, I posted Part 2 of Why Do Analogs Work? yesterday. It details the 2011 as 2007/8 analog, and delves into the numerous chart patterns, fan lines, regression channels and harmonic patterns that took us from May to July of last year.
It’s a decent guide to how these various patterns interacted and combined to generate a top, and subsequent fall — helpful hints for times like these.
The Dow is setting up with the same chart patterns and harmonics as SPX, leading me to believe it’s also on the path to completing an analog of its Feb-May 2011 top. The big difference is that DJI already came very close to and reacted off its .886 Fib.
However, this doesn’t trouble me too much. In 2011, the Gartley pattern played out with a 20-pt near miss on the .786 (after a .618 Point B) on Feb 18. The reaction was pretty significant, with a 834-point swoon over the next 17 sessions. Yet, DJI swept back up to meet and exceed the .786 by 332 points before topping out in May.
Now, as it’s making a bid for higher highs, it has the same three options as SPX. Remember, it’s all about getting to the .886 Bat pattern completion (13,217) and then the price level of the rising wedge’s apex — about 13,730.
If the analog holds, we should top out tomorrow somewhere between 13,125 and 13,240 followed by completion of the H&S pattern and a swift decline to 12,320-12,420, then a subsequent rise to a new high in the 13,730 to 13,840 range.
But, if this current rise gets a head of steam on it, we could just go on up and tag the apex and long term midline (red, dashed) around May 7 at 13,737-ish. There’s a Crab pattern that completes at 13,659 that is already in the works (red Fib pattern.)
The third option will be the trickiest: DJI reverses, nearly completes the H&S pattern, but can’t seal the deal. It follows the same path of least resistance up to 13,737 around May 7.
The analog and the 2nd alternative are shown on the chart below.
As it now stands, DJI has retraced about .707 of its recent decline. It can go as high as the .886 at 13,230 and still form a decent H&S pattern. Any higher and it starts looking really wonky. A rise above 13,284 means we’re likely pursuing the alternate instead of the analog.
For now, I’m expecting the analog to hold. The RSI chart, particular, shows a distinct possibility of a turn in the very near future (note the red, dashed line.)
I’ve been watching several analogs for the past several weeks, and this one is screaming the loudest just now.
As always, an analog makes a lot more sense when there’s a plausible case to be made for the expected path forward. That was certainly the case last year, when I posted extensively about the 2011 as 2007/8 analog [see: Why Do Analogs Work? Part 2.] I believe this one qualifies, though there are a few hoops to jump through first.
2010 Rising Wedge
2011-2012 Rising Wedge
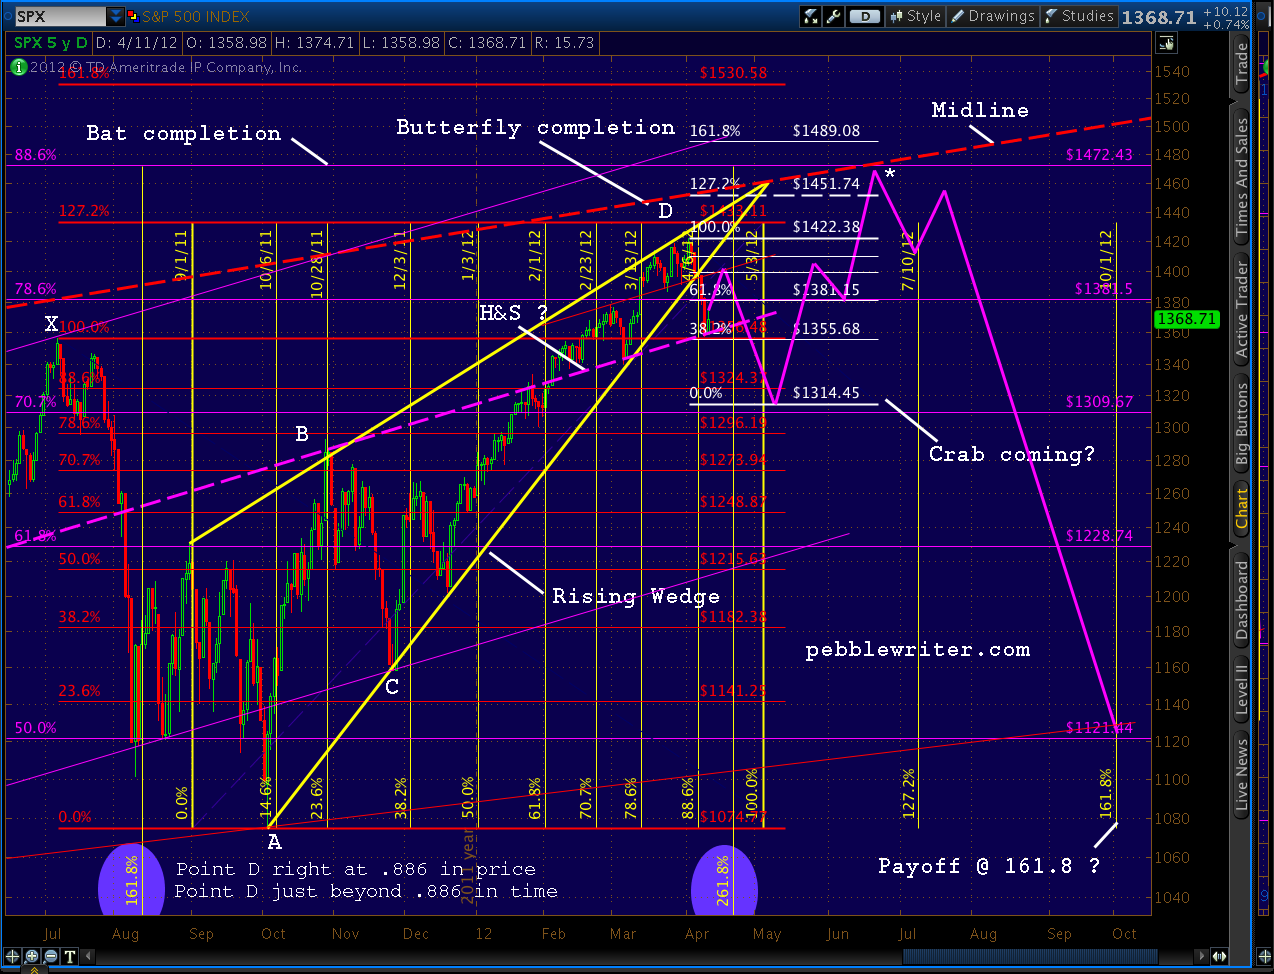
The odds of it playing out rise dramatically if the bump we saw Wednesday extends up to 1380-1400 before any further declines. If so, the bold purple dashed line above — the midline of the channel I expected would stop Tuesday’s sharp sell-off — would make a terrific neckline for a H&S pattern that targets 1305-1317.
Of course, if the neckline holds — probably around April 24-26 — the H&S fails and we head up to 1462 around May 4-8 for the end of the bullish ride. The H&S pattern is key.
Note that Tuesday’s low was at the .786 of the 1340-1422 rise, making it a perfect Point B for a Butterfly pattern. Such patterns extend to the 1.272 (1317) or 1.618 (i.e., 1288, which would slightly overlap the Oct 27 1292 high and might be problematic for the EW picture.)
To me, a drop to 1305-1317 seems fairly plausible. The tricky part comes in calling for a reversal after SPX has fallen 120 points from its recent high. The timing looks to be early May, and we have a couple of Fed-centric events around then: consumer credit on the 7th and minutes from Apr 24-25 on the 16th. So, I suppose anything’s possible.
If the analog is still in play, this is make or break time. Those who, like me, have been resolutely bearish are itching to get the party started. Sentiment would be fiercely negative. But, a strong bounce around 1300 would be the signal that the analog is good.
If so, we’re likely to go back and tag the price level of the original apex (about 1462) of the rising wedge we’ve been in since last August. I’ve seen this phenomenon play out again and again on both large and small scales.
While completion of the Crab pattern which might set up by then would indicate potential to 1489, I believe the .886 Fib of the Oct 07 – Mar 09 decline (a Bat pattern) will step in to prevent a rise in excess of 1462-1472.
But the greater limiting factor is the bold, red dashed trend line labeled “midline” running through the chart. It’s an incredibly important TL that dates back to March of 1935, running right down the middle of the channel guiding SPX ever since (it’ll show up on another bigger, more important analog I’m finishing up.)
If all those fairly logical (but, by no means guaranteed) pins drop into place, the lock will click and the door will swing open to all sorts of goodies. I’ll be watching it along the way, of course, waiting for the whole mess to come crashing down in a heap. Analogs always work — until they don’t. But, when they do…investing can be a whole lot of fun.
“The 1101 touch occurred 69 sessions after the May 2 high. In 2008, the equivalent bottom was 70 sessions after the Oct 11, 2007 high. The 2011 decline amounted to 19.6% from the high; in 2007 it was 19.4%. The 2007/8 total point loss of 306 points was very closely matched by 2011′s eventual loss of 296 points. And, the eventual low in 2011 came 108 sessions after the top; whereas, 2008′s came 107 sessions after the top.”
********
I was moved to start the pebblewriter blog on May 2, 2011 because I was convinced we were nearing a top. I knew nothing about analogs, but I knew chart patterns and was starting to learn about harmonics. So, I posted:
“A very long term support line comes into play as resistance. About to intersect with the rising wedge from March ’09 (daily) and the rising wedge from this past April 15 (hourly.) Then, there’s the .786 retracement off the March ’09 lows coming up at 1381.50.”
“Price target if the longer term wedge plays out is 46 – 100% of the rise, indicating 320-700 points on the SPX.”
Of course, I had no idea when I wrote those words that the top had just occurred an hour earlier. And, I was dead wrong about the minimum loss coming. Instead of 320 points, SPX fell only 269 points (oh, well.)
The analog came to me as the result of my obsession with patterns. The basic chronology of my observations (with links to earlier posts) was as follows:
On May 31 [Why P[3] is My Top Bear Count] I noted “significant similarities between the past few months and the tops in 2000 and 2007.”
On June 3 [Here We Go] compared the market action between the patterns as related to breaking and backtesting the long term support trendline.
On June 8 [Deja Vu?] detailed the pattern that the 2000, 2007 and 2011 tops had in common, noting how the market…
“…once it drops below its long-term support, looks like it’s in for a free fall. But, it eventually finds new support in a parallel channel as I theorized a few days ago. The bottom of the channel is drawn off a recent major high and the top is drawn off the two most recent peaks. It pencils in nicely for 2000 and 2007…”
On June 10 with SPX below 1270 and amidst warnings of “flash crash!”, [Channel Surfing] showed how the pattern (accurately) promised one last return to the midline of the regression channel at around 1330. I showed how the channel I’d drawn corresponded well with a 2-standard deviation regression channel.
On June 12 [Update: Channel Surfing] reported that almost every major top since 1928 exhibited the same pattern. I suggested that the pattern was not only characteristic of tops, but a requirement. I formalized the description as:
“…characterized by a multi-month pattern within a rising market that has at least two significant touches (of the index or its Bollinger Band) of at least 1.5 standard deviations on the upper and lower extremes of a regression channel commencing after a post-correction new high. It’s capped off by a third touch on the lower boundary and subsequent return to at least the midline before a final plunge to new lows. “
On June 16, [You’ve Got a Fan in Me] showed how the regression channel could also be defined in terms of fan lines from significant previous high and low pivot points. I used examples from 2007, 2000 and 1937 to demonstrate. The prior day’s post [Playing the Bounce] used the pattern to call the bottom at 1261.90 (it was the next day at 1258.07.)
On June 21 with SPX at 1294, [A Different Perspective] discussed how a return to the pattern midline around 1327 and subsequent fall would create a huge head and shoulders pattern that, by mid-August, would begin a decline to around 1200.
On June 23 [Deja Vu, All Over Again] showed how the 2000 and 2007 patterns corresponded, beat for beat, and charted the various trend lines that would govern the pattern’s completion. With SPX at 1287, the pattern still indicated a 1320-1330 target. I reiterated the pattern prediction the following day in the midst of the 25 point intra-day plunge triggered by the strategic petro reserve decision.
On June 26, [Cliff Diving] defined the decline from 1370 to 1258 as 1 of (1) of P[3], and the subsequent rise a corrective wave 2. I suggested the pattern interim target might also follow Fibonacci guidelines. The midline, at 1322, was virtually the same as the .786 Fibonacci retracement line. With the market back to 1268 and bearish sentiment through the roof, I suggested the pattern would take us up 54 points in 5 days. It took 4. As I suggested on June 29, we would likely even overshoot (we did, hitting instead the .886 Fibonacci retracement.)
In June 29th’s post [Lunatic] I restated that contrary to popular opinion, the rally would not lead to new highs, but would merely complete a corrective wave 2, followed by wave [i] of 3 to around 1300.
On July 4, [Final Destination] suggested the next move down would stop north of 1298.61 in order to keep the bullish count alive.
On July 7, [Confidence Fairies] and [Then and Now] suggested we had reached the pattern high at 1356.87 right at the .886 Fibonacci level. The next day began a 5-day, 46-point decline. In [Friday the Bear Came Early], I suggested the peak was in — earlier than the 87-day cycle would indicate because that’s what happens in market tops.
When a big decline the next morning was quickly reversed and seemingly everyone turned bullish [She’s Come Undone] explained this was simply a throw-over, and that the pattern 1-standard deviation line had stepped in for 2007’s channel midline in defining the top and preventing any further advances. The McClellan Oscillator gave a warning.
On July 11 [The Deathly Hallows] with SPX off 24 points at 1319, I theorized that the -1 standard deviation channel line at 1299 would catch the fall — supported by the H&S target, a key Fibonacci retracement and fan lines.
On July 15, with SPX at 1316, harmonics indicated an imminent low of 1300 and subsequent rise to 1345 [The Waiting Game.] The actual low the following day was 1295, and the subsequent rise was to 1347.
On July 20, I posted about an inverse H&S pattern forming that would signal a huge updraft, but felt we would end up 10 points short — as happened in 2007 [Ten Lousy Points.] In reality, we would end up 8 points shy.
The next several posts were simply warnings of the impending fall. [Merry Christmas] warned that July 21 was the equivalent of December 24, 2007. [Pulling the Trigger] on the 21st correctly advised that…
“1347 might be the last best chance at an excellent short.”
[All Aboard] on the 26th gave visual clues for those who don’t like to read. And, on July 26, with SPX closing at 1331, [Happy New Year] declared that the 27th would be the equivalent of December 31, 2007.
“Those who have been following this blog for any length of time know why I’m wishing you a Happy New Year in July. Under the 2011 is 2007 theory, tomorrow is the equivalent of December 31, 2007.”
SPX was off 27 points the following day, and ten sessions later, bottomed at 1101. It was down 269 points from the day I felt moved to post that it looked like the market was topping in a way that was similar to 2007.
The 1101 touch occurred 69 sessions after the May 2 high. In 2008, the equivalent bottom was 70 sessions after the Oct 11, 2007 high. The 2011 decline amounted to 19.6% from the high; in 2007 it was 19.4%. The 2007/8 total point loss of 306 points was very closely matched by 2011’s eventual loss of 296 points. And, the eventual low in 2011 came 108 sessions after the top; whereas, 2008’s came 107 sessions after the top.
**********
Did the analog play out precisely as did 2007? I’m too lazy to tally all the data points and calculate it; but, just spitballing, I’d say it was about a 95% correlation. We could point to the damage done by Fukushima, the US downgrade, the troubles in the Euro Zone, S&P’s GDP revision, etc., but how could we possibly explain those events falling on the necessary dates in order for the 2007 pattern to repeat so precisely? Exactly.
When all is said and done, I believe the analog played out as scripted because the same conditions were in place as in 2007/8. The rising wedge, the harmonic patterns, the various H&S patterns, etc. worked the way they were supposed to. And, people being people, their reactions to rising/falling markets was the same each time. Fear and greed will always be with us.
At any time, a black swan event might have come along and knock the analog off track. As I watch some of the current analogs play out, I’m wary of the countless curveballs that might come our way: downgradings, upgradings, wars (trade and/or shooting), earnings surprises, elections and the ever-present threat of more QE.
Analogs are a process. They take time, as my daughter whose basketball game I missed today could tell you (hopefully, she’ll forgive me when it comes time to write college tuition checks.) Done correctly, we won’t discover nearly-complete analogs days from paying off. We’ll find them weeks or months in advance — seeing similar patterns setting up, watching for divergence.
The ones I’m watching now look very good. In the days ahead, we’ll find out just how good. Some will work, and others won’t. But, in an investment environment where so many forces are working to manipulate the markets for their own financial and political gain, I think analogs represent an excellent way to make money.
“The 1101 touch occurred 69 sessions after the May 2 high. In 2008, the equivalent bottom was 70 sessions after the Oct 11, 2007 high. The 2011 decline amounted to 19.6% from the high; in 2007 it was 19.4%. The 2007/8 total point loss of 306 points was very closely matched by 2011′s eventual loss of 296 points. And, the eventual low in 2011 came 108 sessions after the top; whereas, 2008′s came 107 sessions after the top.”
********
I received an excellent question from a reader this morning and found myself pouring a little more into the answer than usual. Maybe the answer — which swerves headlong into the issue of whether chart patterns work — deserves its own post.
The reader suggested that the Fukushima earthquake in Mar 2011 was the cause of the market’s decline and, since such a huge event was unlikely to repeat in our timeline, the current analog we’re following is unlikely to play out.
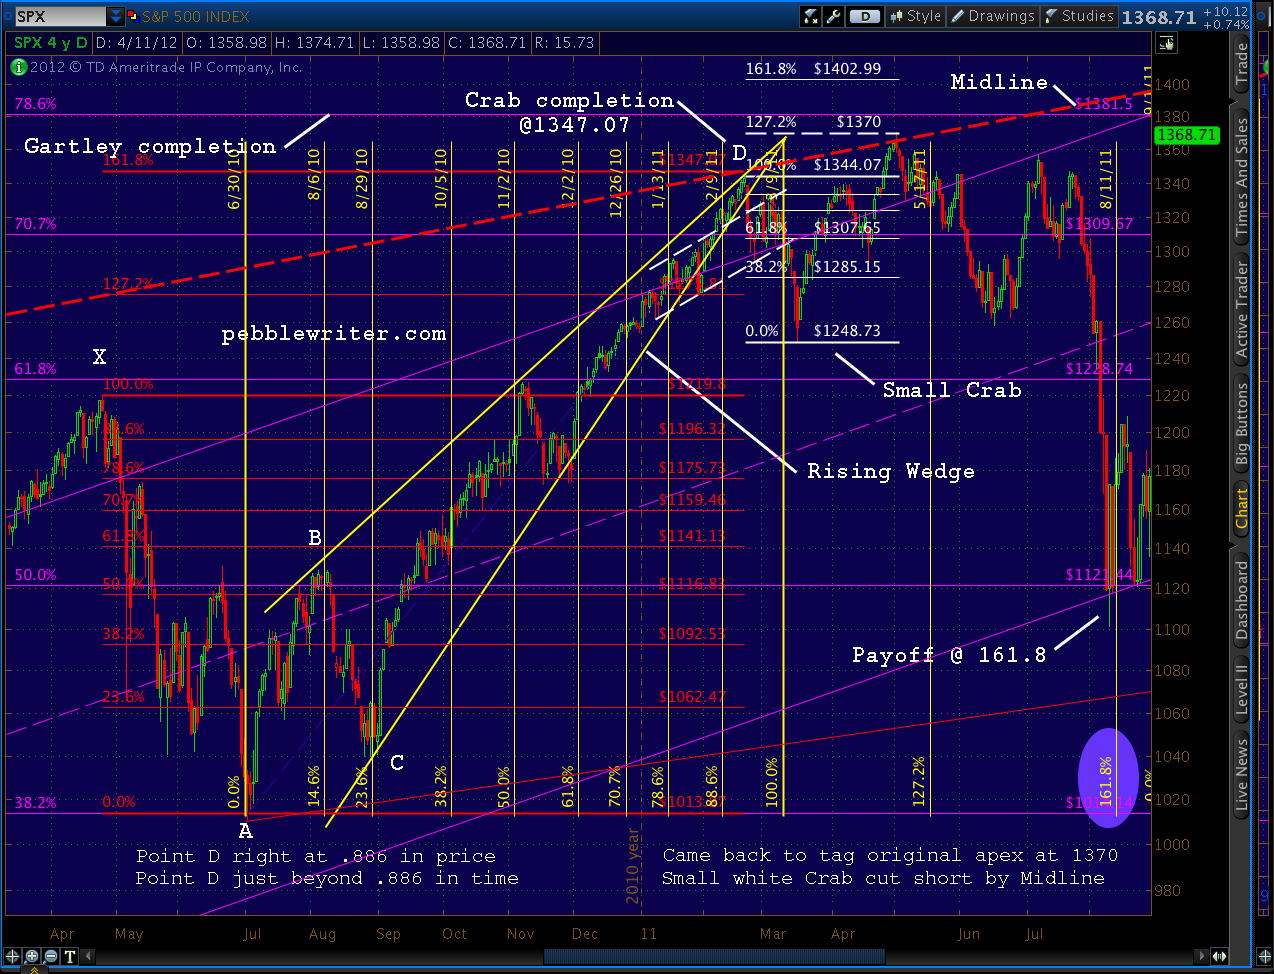
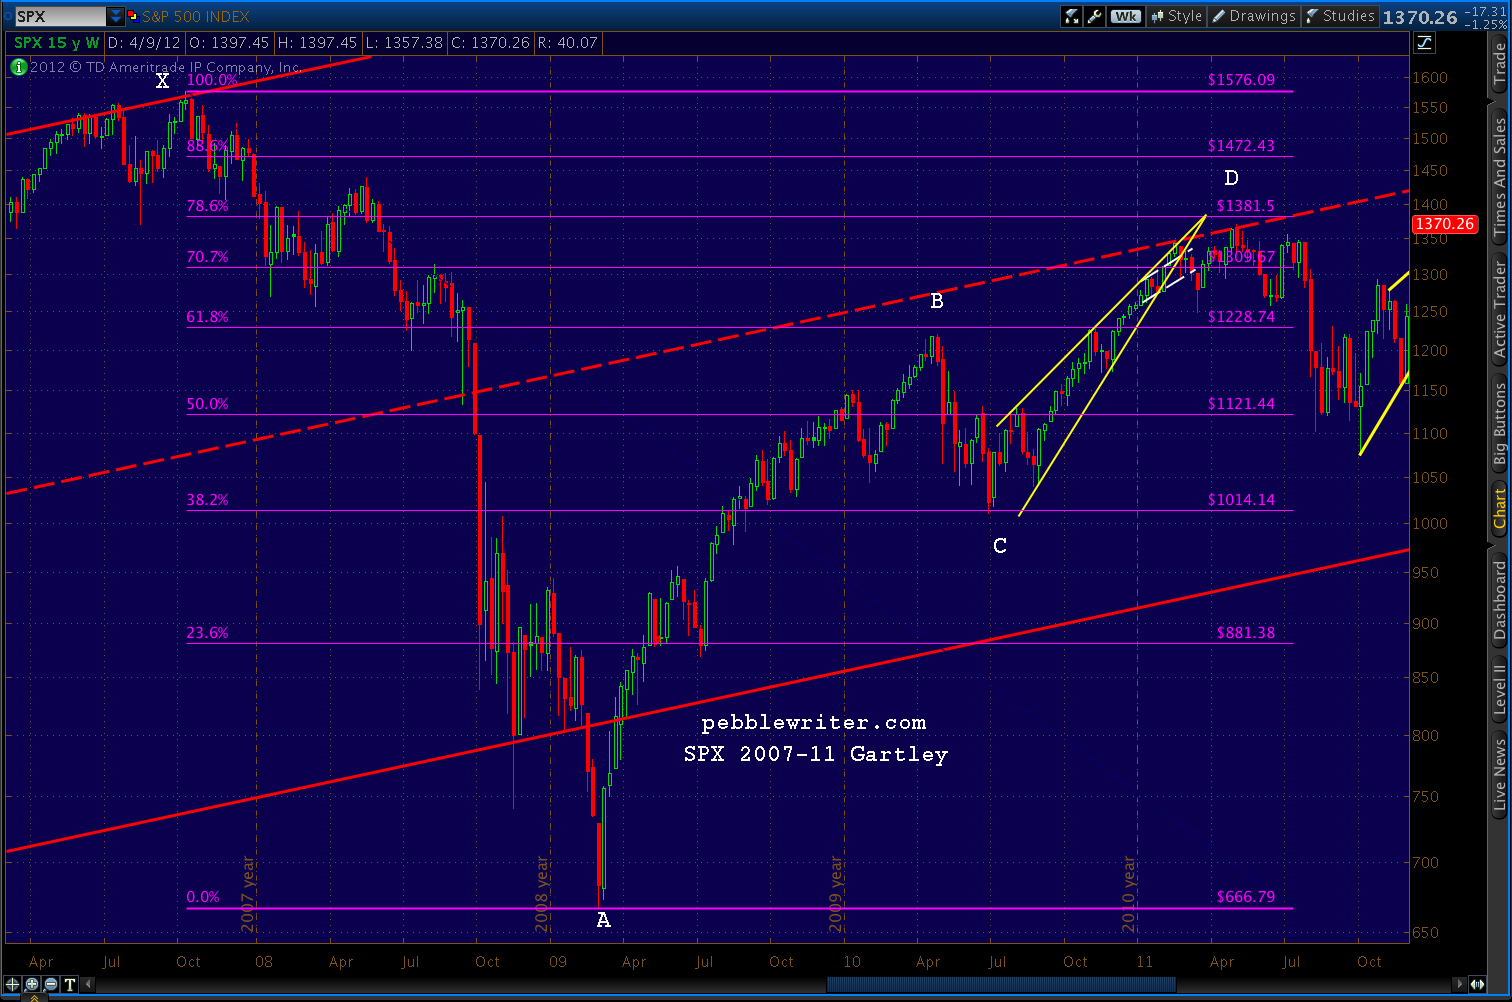
While the earthquake obviously helped the market along, SPX started down in February 2011 because: (1) it was very deep into a rising wedge; and, (2) it had completed a huge Crab pattern that started with the April 2010 sell-off; and, (3) it had just completed a H&S pattern. The following chart clearly shows all three patterns.
Before Fukushima came along…
The apex of the rising wedge (solid, yellow) was around 1380 (the .786 of the huge Gartley Pattern set up by the 2007-2009 decline.) SPX had come .886 of the way in time and price towards the apex — very deep indeed.
From months earlier, the Crab pattern (red, with key points in white) had forecast 1348.89. We had reached 1344.07 and were already reversing as typically happens.
And, the Head & Shoulders pattern (dashed, white) had already completed. It targeted 1250, which is exactly where we were 8 sessions later.
But, perhaps the strongest reason had SPX turned tail at 1344 was because it had just tagged a trendline (bold, red dashed) that dates all the way back to 1935. This TL is actually the midline of a channel that, with very few exceptions (mostly from 1997-2002) , has contained all the major market moves back to the Great Depression.
This midline had been support for SPX since 1991, but became resistance when SPX fell back through in September 2008.
After Fukushima…
The market continued to do what these chart patterns had already predicted. In fact, six sessions after Fukushima, the market had completely recovered — reaching the May 1370 high only 29 sessions later. Stay with me, now, because this is where it gets interesting.
On May 2, SPX was on its way to completing that big Gartley pattern. After 910 points down, and 704 points back up, SPX was a mere 11 points from completing a very well-formed Gartley at 1381.50. Nothing could stand in its way — except that annoying midline, again.
Nine weeks and a Bat pattern later, SPX began its 255-pt swan dive — just as the analog said it would.
With the backstory out of the way, stay tuned for Part 2 in which we discuss how the analog predicted last July’s crash (and what lies ahead.)
SPX overshot the Crab’s 1.618, whichever Point X we use. The next major lines of harmonic support are are the red pattern’s 2.24 at 1342, correlating with the purple pattern’s 2.618 at 1341.
Given the level of oversold on the day, here’s an alternative view.
UPDATE: 11:55 AM
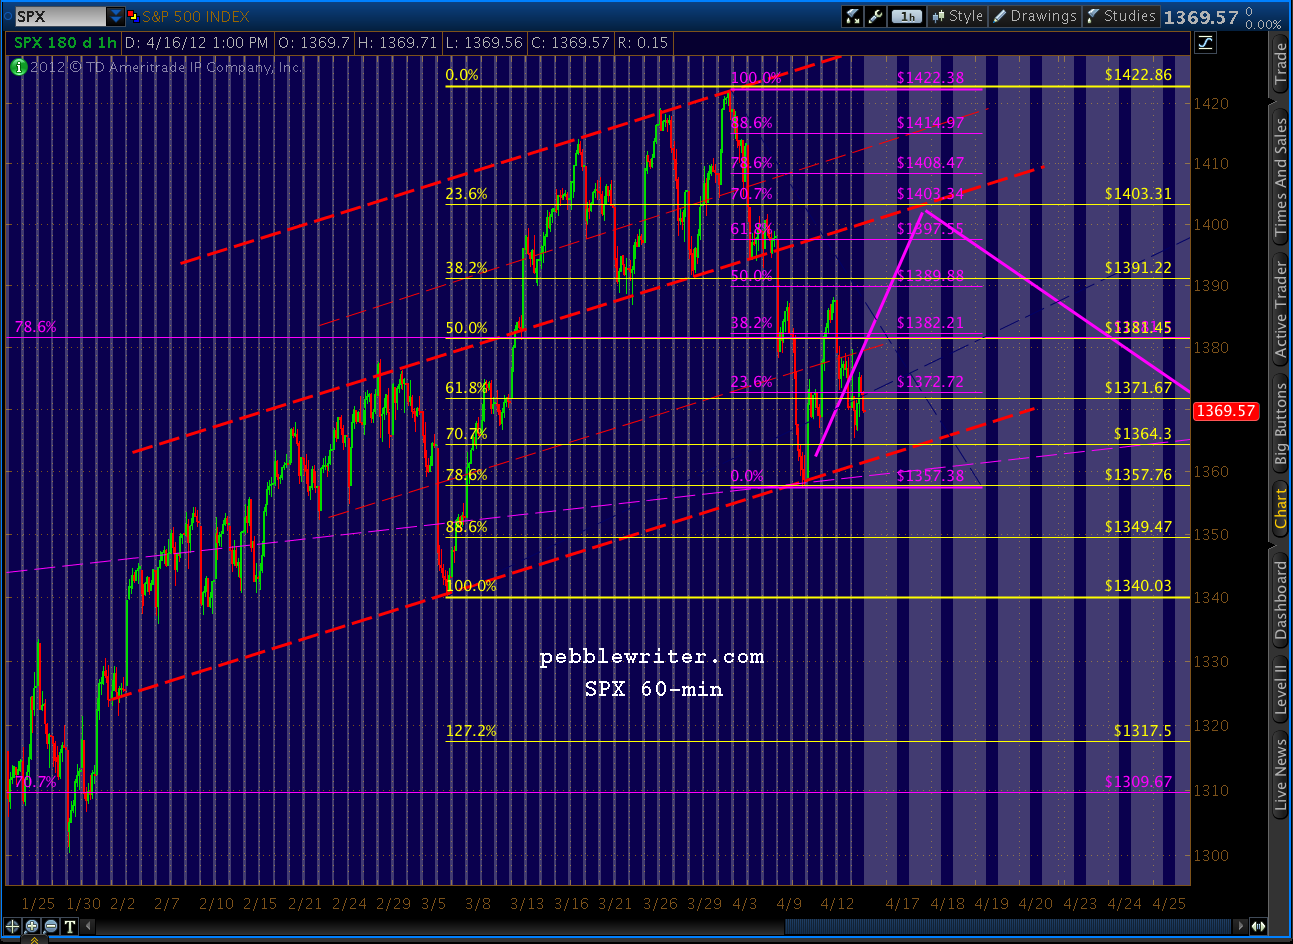
The Crab Pattern I posted about earlier pulled a fast one on us. It either busted, or I drew it wrong.
Technically, it’s forbidden for Point C to exceed Point A — kind of like Wave 1/Wave 4 overlaps in Elliottworld. But, it happens. I’ve redrawn the Crab to begin with the March 23 1386 low instead of the March 29 1391 low — which means that the 1.618 extension is 1364.92 instead of 1372.51.
Note the daily RSI tag on the same trend line (red, dashed) that stopped the Oct 4 and Nov 25 declines. The previous tags are highlighted in light blue. This decline is picking up momentum, so the RSI TL and the Crab pattern might get mowed down.
But, be cautious. Like any trading system, once you start bending the rules in Harmonics, it opens up a can of worms. Markets frequently overshoot logical targets, and it’s no cause to discard the methodology.
I’m taking some profits off the table at these levels, and will let the rest ride essentially risk free. Note that 1364 is the .707 of the 1340-1422 move. If it doesn’t hold, the next support is at the .786, which would equal 1357. An intra-day push to 1357 and close at 1364 would be interesting.
ORIGINAL POST
After yesterday’s close below the rising wedge, we can safely consider it officially broken. Now, the question is whether SPX will freefall in an epic fail of the bull market, or find support at some interim level for another leg up.
In the near term, we’re approaching a potential Crab Pattern turning point at 1372.51. We might have reached it yesterday but for the little acceleration channel SPX has been in since 1422. Today, the channel passes right through 1372, so we could get a good test.
This isn’t a big pattern, so we might not see earth-shattering results, but it should be good for at least a nice bounce if not an outright reversal.
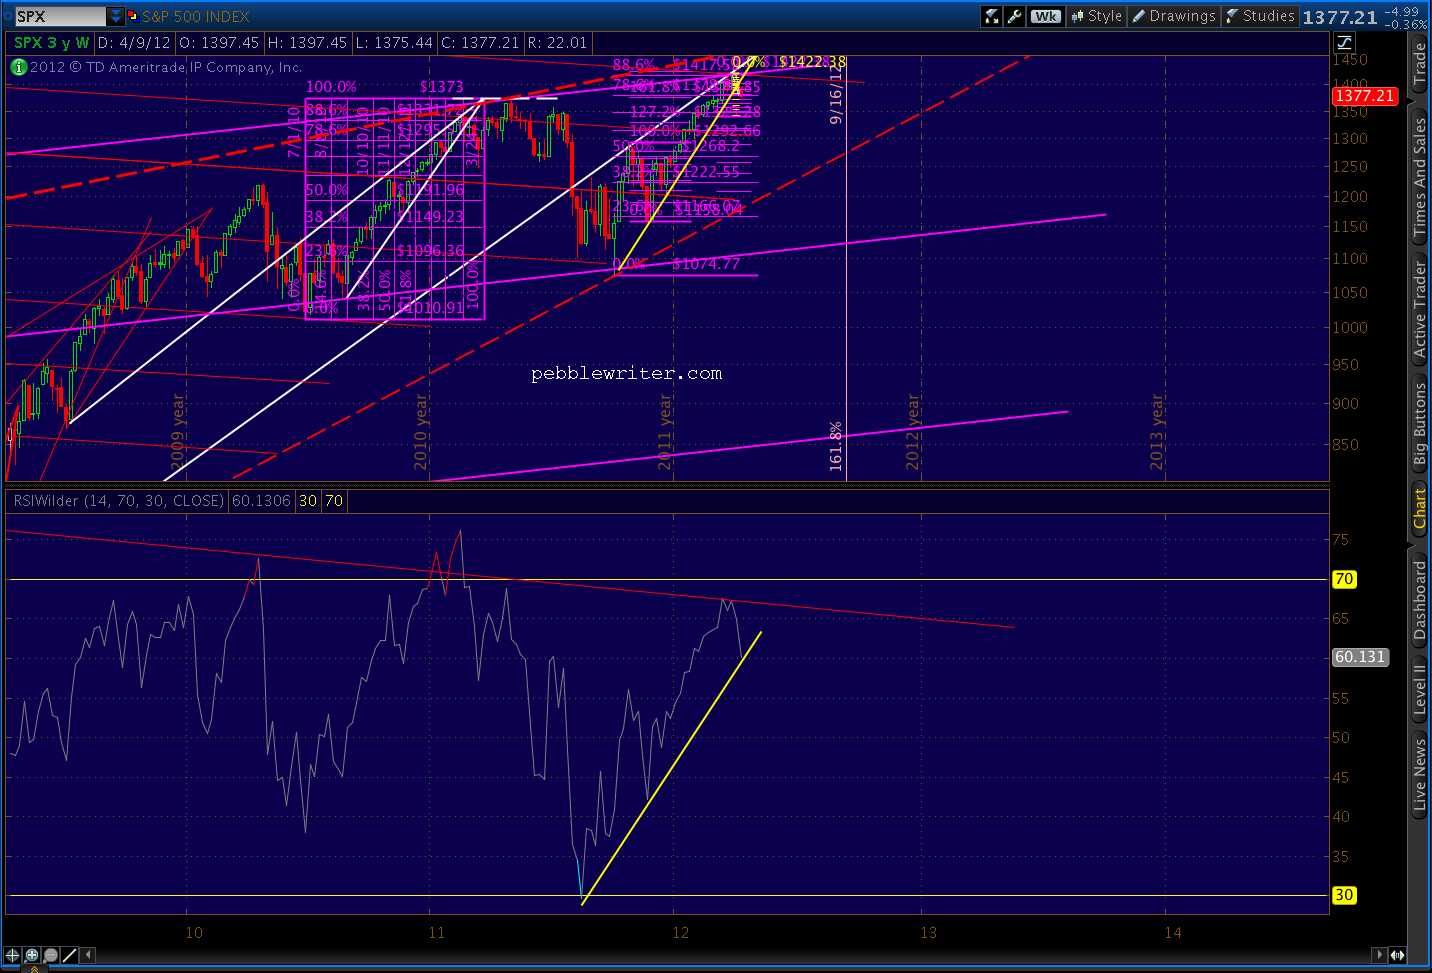
I think an outright reversal might be in the cards, though. The hourly RSI shows positive divergence with this morning’s leg down, and daily RSI shows a tag of an important internal trend line. But, it’s the weekly RSI chart that, as a bear, really gives me pause.
Expanding the RSI chart gives us a clear view of a trend line that might provide significant lift at these price levels (ignore the compressed upper chart.)
I’ve also been watching VIX’s price action, constructing some probable channels months ago: the yellow channel guiding the downside, transitioning to the red channels for the subsequent rise. Since then, I’ve barely adjusted them.
Note how well they’ve called the turns. At this point, they hint at a likely breather for VIX. All things considered, I think we’re likely to see a backtest of the VIX falling wedge that will correspond with a return to the other side of the red channel. It could happen any time, but might well occur coincident with the afore-mentioned bounce in SPX.
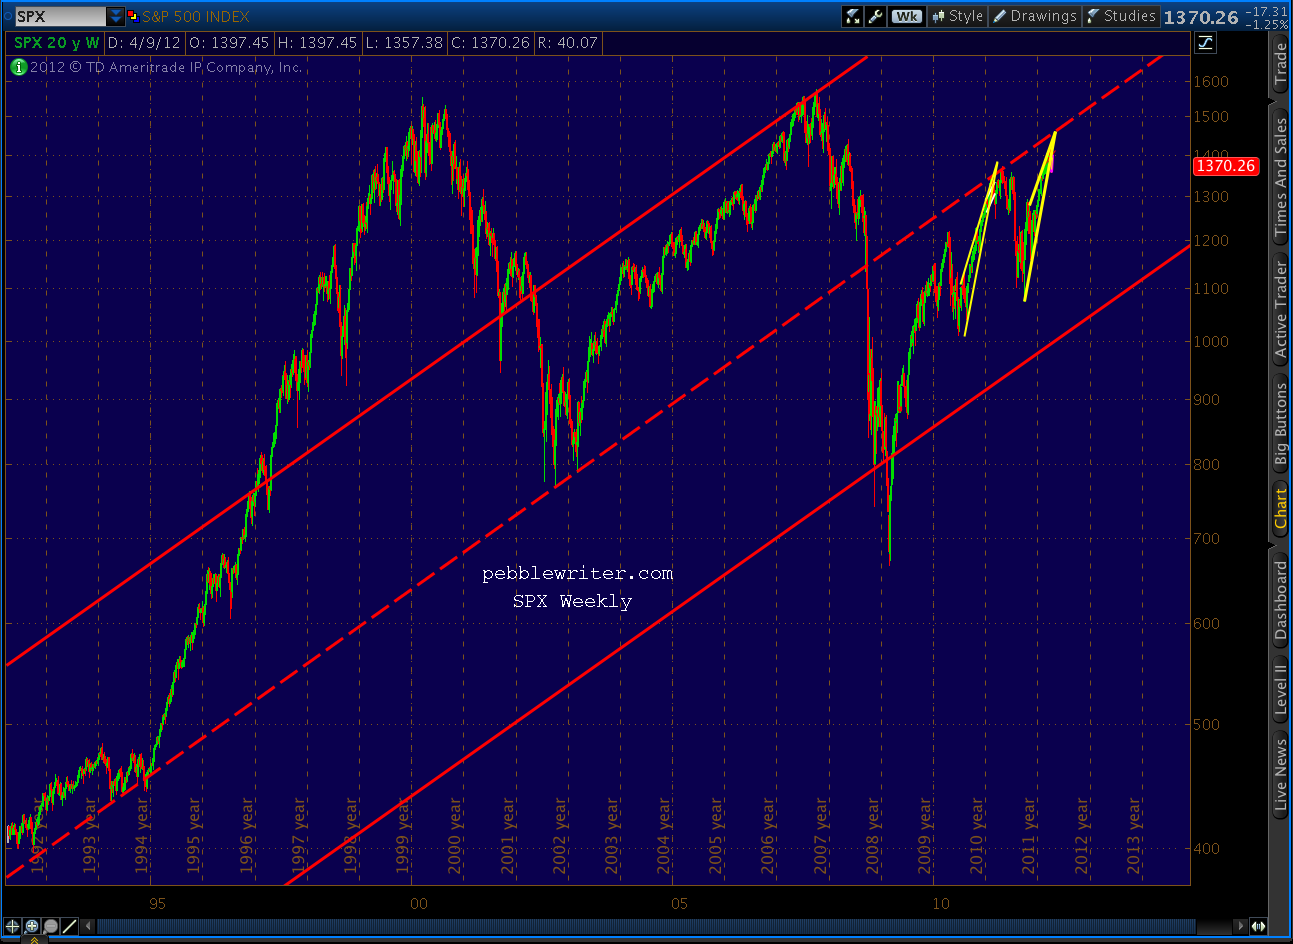
All this begs the question, what kind of bounce will we see? As we discussed the other day, this rising wedge is a reasonable facsimile of the 2010-2011 one [see: Analog Watch.]
The most likely drawing of the current wedge puts the apex around 1460-1470 somewhere around May 7-11, meaning we reached only 88.6% of the potential in both time and price at the recent 1422 high. [see: Was That It?] If we repeat the pattern, we’ll head back up to tag that apex — exactly as we did in May 2011 at 1370 (note the dashed white line that connects the March 2011 apex to the May 2011 top.)
More importantly, however, we’d tag the upper bound of the huge rising wedge (red dashed) that dwarfs the rising wedge (yellow, solid) that just broke down.
I’ve drawn its upper bound as the biggest, boldest red line I can muster on the above chart. Why?
I’ve been watching several analogs for the past several weeks, and this is one screaming the loudest just now.
As always, an analog makes a lot more sense when there’s a plausible case to be made for the expected path forward. That was certainly the case last year, when I posted extensively about the 2007/8 as 2000 analog [see: OMG, WTF and Money Back Guarantees and Happy New Year.] I believe this one qualifies, though there are a few hoops to jump through first.
2010 Rising Wedge
2011-2012 Rising Wedge
The odds of it playing out rise dramatically if the bump we saw Wednesday extends up to 1380-1400 before any further declines. If so, the bold purple dashed line above — the midline of the channel I expected would stop Tuesday’s sharp sell-off — would make a terrific neckline for a H&S pattern that targets 1305-1317.
The H&S pattern is key. If the neckline holds — probably around April 24-26 — the H&S fails and we head up to 1462-1472 around May 4-8 for the end of the bullish ride. Likewise, if we see no reversal by 1430, the H&S busts and we’re practically guaranteed an immediate new high.
Note that Tuesday’s low was at the .786 of the 1340-1422 rise, making it a perfect Point B for a Butterfly pattern. Such patterns extend to the 1.272 (1317) or 1.618 (i.e., 1288, which would slightly overlap the Oct 27 1292 high and might be problematic for the EW picture.)
To me, a drop to 1305-1317 seems fairly plausible. The tricky part comes in calling for a reversal after SPX has fallen 120 points from its recent high. The timing looks to be early May, and we have a couple of Fed-centric events around then: consumer credit on the 7th and minutes from Apr 24-25 on the 16th. So, I suppose anything’s possible.
If the analog is still in play, this is make or break time. Those who, like me, have been resolutely bearish are itching to get the party started. Sentiment would be fiercely negative. But, a strong bounce around 1300 would be the signal that the analog is good.
If so, we’re likely to go back and tag the price level of the original apex (about 1462) of the rising wedge we’ve been in since last August. I’ve seen this phenomenon play out again and again on both large and small scales.
While completion of the Crab pattern which might set up by then would indicate potential to 1489, I believe the .886 Fib of the Oct 07 – Mar 09 decline (a Bat pattern) will step in to prevent a rise in excess of 1462-1472.
But the greater limiting factor is the bold, red dashed trend line labeled “midline” running through the chart. It’s an incredibly important TL that dates back to March of 1935, running right down the middle of the channel guiding SPX ever since (it’ll show up on another bigger, more important analog I’m finishing up.)
If all those fairly logical (but, by no means guaranteed) pins drop into place, the lock will click and the door will swing open to all sorts of fun stuff. I’ll be watching it along the way, of course, waiting for the whole mess to come crashing down in a heap. As I mentioned, there are other analogs at work that have potential. One of them really knocked my socks off, and I’ll probably post it this weekend here on the new website.
We got a bounce just below 1395 as expected, and the market is currently retesting that level. Again, if the rising wedge and our little channel hold, there is decent upside ahead. There’s a lot riding on today’s sell off for both bears and bulls.
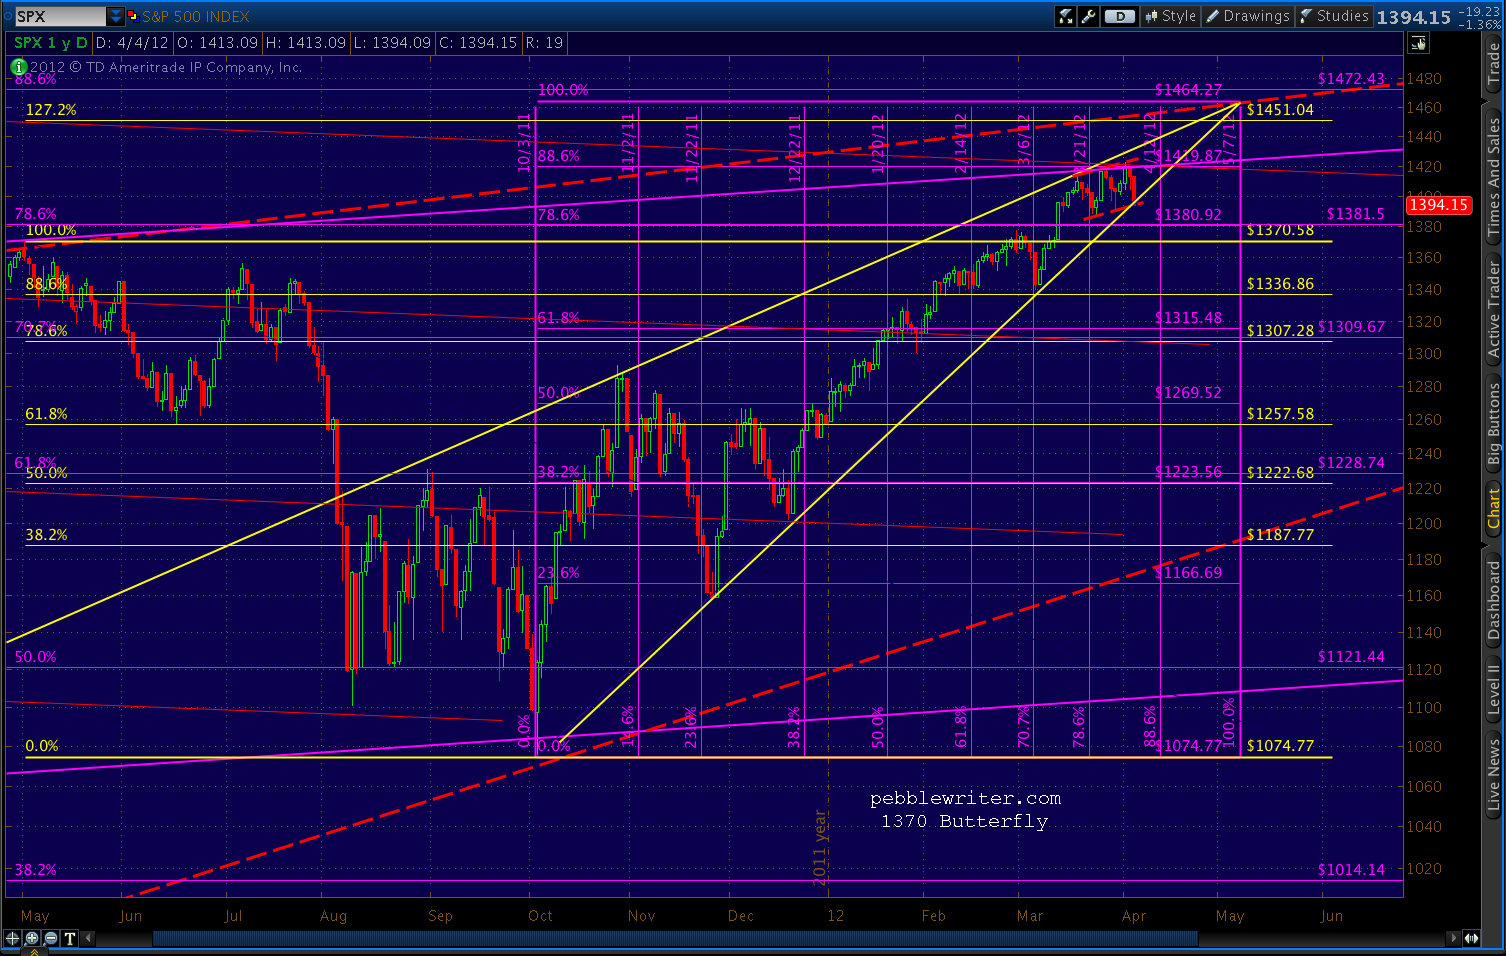
Note the RSI TL tag (red arrow) to go along with the rising wedge lower bound test. This chart shows the yellow Butterfly pattern with inception at 1347. The 1.272 at 1421 was already tagged on Monday — which was also the .886 in price and about .86 in time of the yellow rising wedge that lies within the huge red, dashed rising wedge. This was our preferred Butterfly pattern completion.
But, as noted in All the Pretty Butterflies last week, there are two other ways of looking at this same Butterfly pattern. Starting the pattern on July 7 at 1356.48 yields a 1.272 at 1433, just beyond the rising wedge’s .886 in price (1420)…
…and a May 2 start at 1370.58 results in a 1.272 completion at 1451 — just shy of the rising wedge apex — in fact, close enough to be considered on target (within a margin of drawing error.)
I think it’s important to realize that the big, red rising wedge is still hanging out there, drawing prices higher for at least one last tag. It intersects with the apex of the yellow wedge, somewhere between 1460 and 1470 and between May 7-11 (the range results from having to consider/ignore the impact of shadows on earlier peaks and bottoms.)
Prices could conceivably stay in the rising wedge all the way there, but there are also many instances of rising wedges breaking down, only to BACK TEST TO THE ORIGINAL APEX.
Either way, if we can get through the next few days without the yellow rising wedge breaking down, we could see 1433 around the 13-15th.
If the yellow rising wedge does break down, it’s possible we’ll get back to 1433 or even 1451 on a back test.
These are precarious times, when a single initial claims report or failed Spanish bond offering could sink the market. While I’m positioned for lower prices, I’m hedging my bets because I’m concerned the bull isn’t quite done over the short term.
NYA and RUT, in the meantime, have definitely broken their rising wedges. I’ll post more on them after the close.
When SPX does break, the damage could be severe. The big red rising wedge is currently all the way down at 1180 — 15.7% below current prices.
UPDATE: 10:25 AM
The market continues to sell off, with SPX about to break 1398. Here’s a close up of the wedge and the relevant fib levels. Remember, an intra-day break of the channel isn’t nearly as important as a close beneath the lower bound (in yellow). I’m also watching the little channel that set up over the past couple of weeks, marked in red, dashed lines.
The .886 Fib level lines up with the bottom of that channel at 1395.08, meaning it’s the most likely place for a bounce — if we get one.
Meanwhile, VIX is getting a pretty good bounce this morning — up over 10% to an intra-day high of 17.66 and testing its falling wedge.There’s a little rising channel to match SPX’s falling channel. It breaks through the falling wedge at around 17.75. It also appears VIX is possibly tracing out either a Bat or Crab pattern (in purple) with potential point B’s at the .382 or .500.
A Bat completion would target the .886 at 20.38, while a Crab would target the 1.618 at 25.92. All contingent, of course, on whether we can break out of the wedge without merely widening it as has happened several times.
The VIX RSI channel I theorized a couple of months ago has played out very accurately, and appears to support the idea of VIX having more upside than just the falling wedge boundary.
ORIGINAL POST:
A few days ago we discussed the three Butterfly patterns we were watching, each of which was posed a legitimate level at which the melt-up should abate [see: All the Pretty Butterflies.] My favorite completed at 1421, which we reached (high of 1422.38) on Monday the 2nd.
Since then, we’ve not bested 1422. And, with this morning’s imminent sell-off, it’s possible the yellow rising wedge will break. The key will be 1396, below which we’re no longer in this smaller wedge and have downside potential to 1380 or so.
A bounce at 1396, on the other hand, means we’re likely to find our way higher. But, the narrowing rising wedge is almost done. Today, it ranges from 1396 to 1431. By this time next week, it’ll be 1410-1437 and will have reached the .886 of it’s time span (to match the .886 of its price span already reached on Apr 2.)
We’re about to find out just how much investors have been relying on the idea of QE3 for their bullishness.
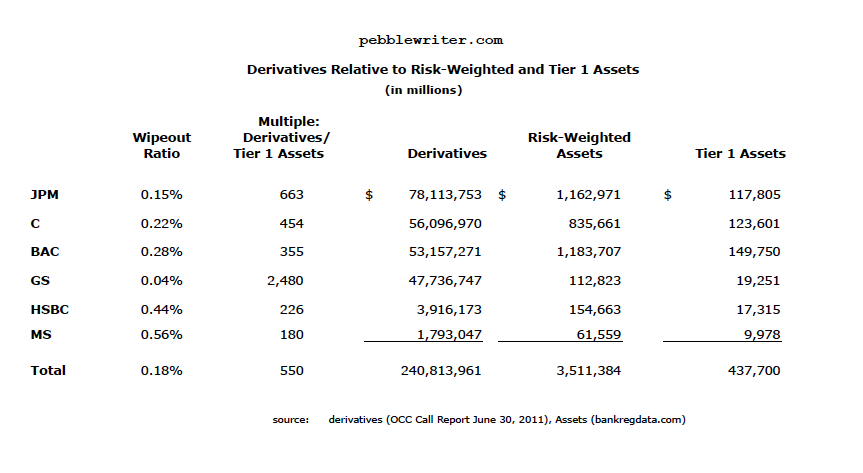
A simple calculation comparing major banks’ derivatives positions to their assets and capital shows how little it would take to wipe out either. The first ratio is the multiple that derivatives represent of Tier 1 capital. The second shows the miniscule percentage decline in the value of derivatives portfolio it would take to completely wipe out Tier 1 capital.
Goldman Sachs, for instance, has $47 trillion in derivatives exposure — 2,480 times its Tier 1 capital. A 0.04% decline in the value of the derivatives portfolio would wipe out Tier 1 capital altogether.
Overall, a 0.18% decline would do the entire bunch in. Something to think about, especially as the vast majority of derivatives are OTC, are not priced in public markets, and are obscured/netted out in balance sheets. Remember, “too big to fail” really means “subject to taxpayer bailout.”
A little over a week ago in a Zerohedge article we learned that Italy’s previously hidden derivatives exposure amounted to 11% of the country’s GDP. A recent $3.4 billion payment to Morgan Stanley to settle a 1994 contract wiped out half the value of the tax hikes recently imposed on an already crumbling economy.
If this doesn’t seem terribly important, consider that the derivatives exposure of the five banks above alone, at $240 trillion, is four times the combined GDP of every country on earth. JPM, by itself, has notional derivatives exposure that exceeds the combined global GDP.
I fear this is the story of the year, folks. And, it’s just now starting to get some press. As we learned with AIG, if one segment of the financial markets suffers unanticipated losses, the entire house of cards can come crashing down. Banks know how bad the situation is; how else to explain the lack of interbank lending — particularly in the euro zone?
In typical end-of-the-quarter fashion, the markets seem to be running in place. But, by one measure, the melt-up might already be finished.
Recall we were looking at 1419 as one of two possible tops (the other being 1433) when SPX was at 1402 back on March 23 [see: The Tipping Point.] I mentioned it as a target of certain harmonic patterns. We also recognized it as the .886 Fib price level of a small rising wedge within a larger rising wedge.
There are actually three potential harmonic targets suggested by the Butterfly pattern that features 1074.77 as its Point A and 1292.66 as its Point B. All of them assume the pattern completes at the 1.272 extension; but, keep in mind that Butterflies can also complete at the 1.618 extension. If you have no idea what I’m talking about, visit Crabs and Butterfly Patterns Explained for more info.
Like all harmonics, Butterfly Patterns begin at a meaningful peak or trough (though frequently you can find smaller patterns within patterns.) The primary requirement is that the Point B be at the .786 Fib level. Here are my three candidates for the pattern we’ve been watching for the past several months.
#1 is the most bullish and begins at 1370. I like the fact that 1370 was the high for all of 2011, back on May 2. But, it leaves us with a less than ideal Point B — 14 points below the .786 (1292 v 1306). It would complete at 1451.
#2 begins at 1356 on July 7 and features a Point B only 4 points below its ideal .786 of 1296.19. It completes at 1433. Closer still.
Butterfly #3 — my personal favorite — begins at 1347 and Point B ((at an intra-day high of 1292) is 4 points above its ideal of 1288.74. The closing price of 1284 was 4 points below. This particular pattern completes at 1421.05 — just 1.90 from the Mar 27 high of 1419.15.
Could 1419 have been the end of this wave? You bet.
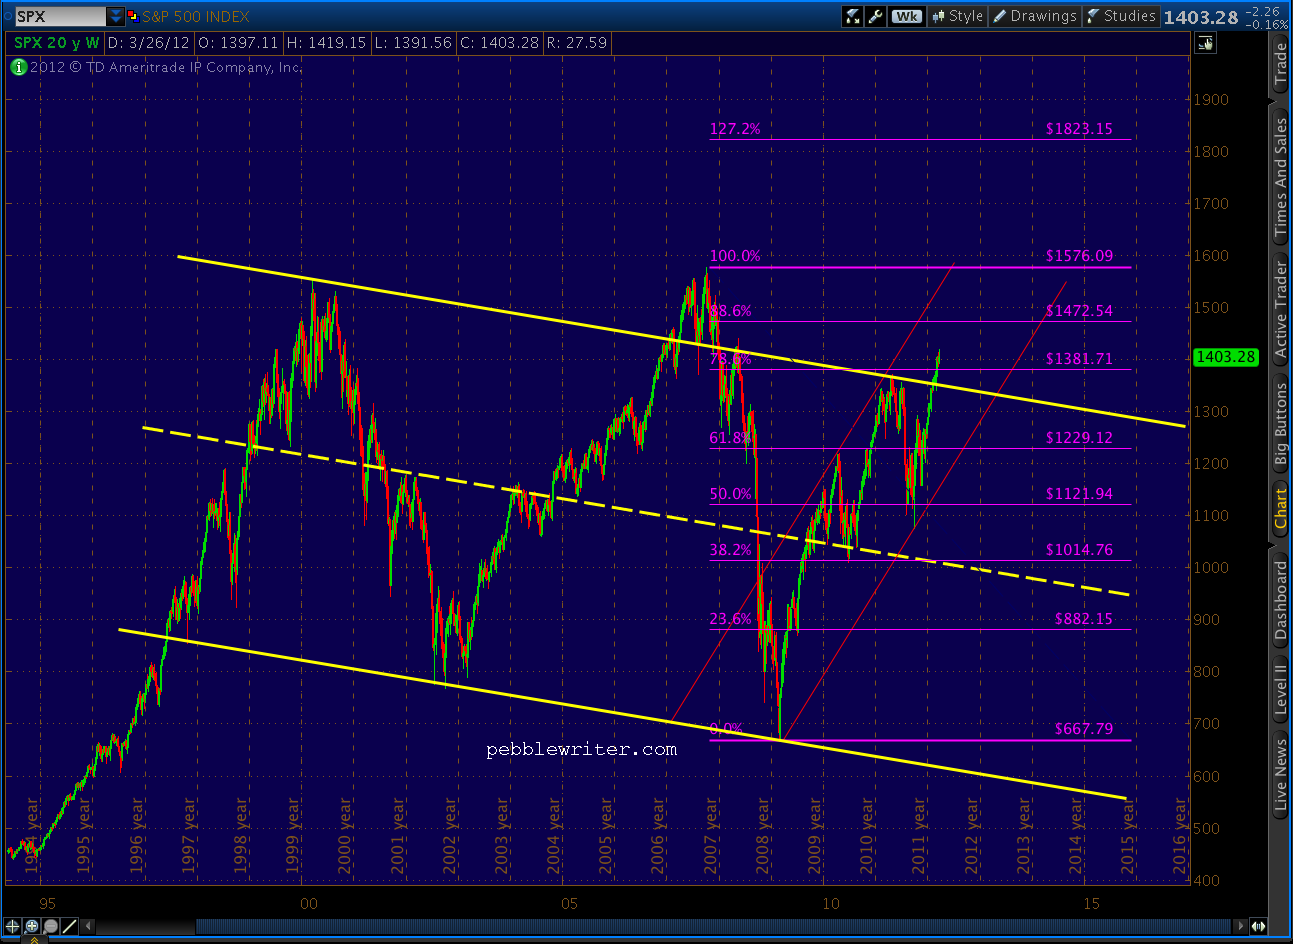
I always like it when one harmonic pattern matches up with one or more other harmonic patterns and chart patterns. Here’s one I just can’t get out of my head.
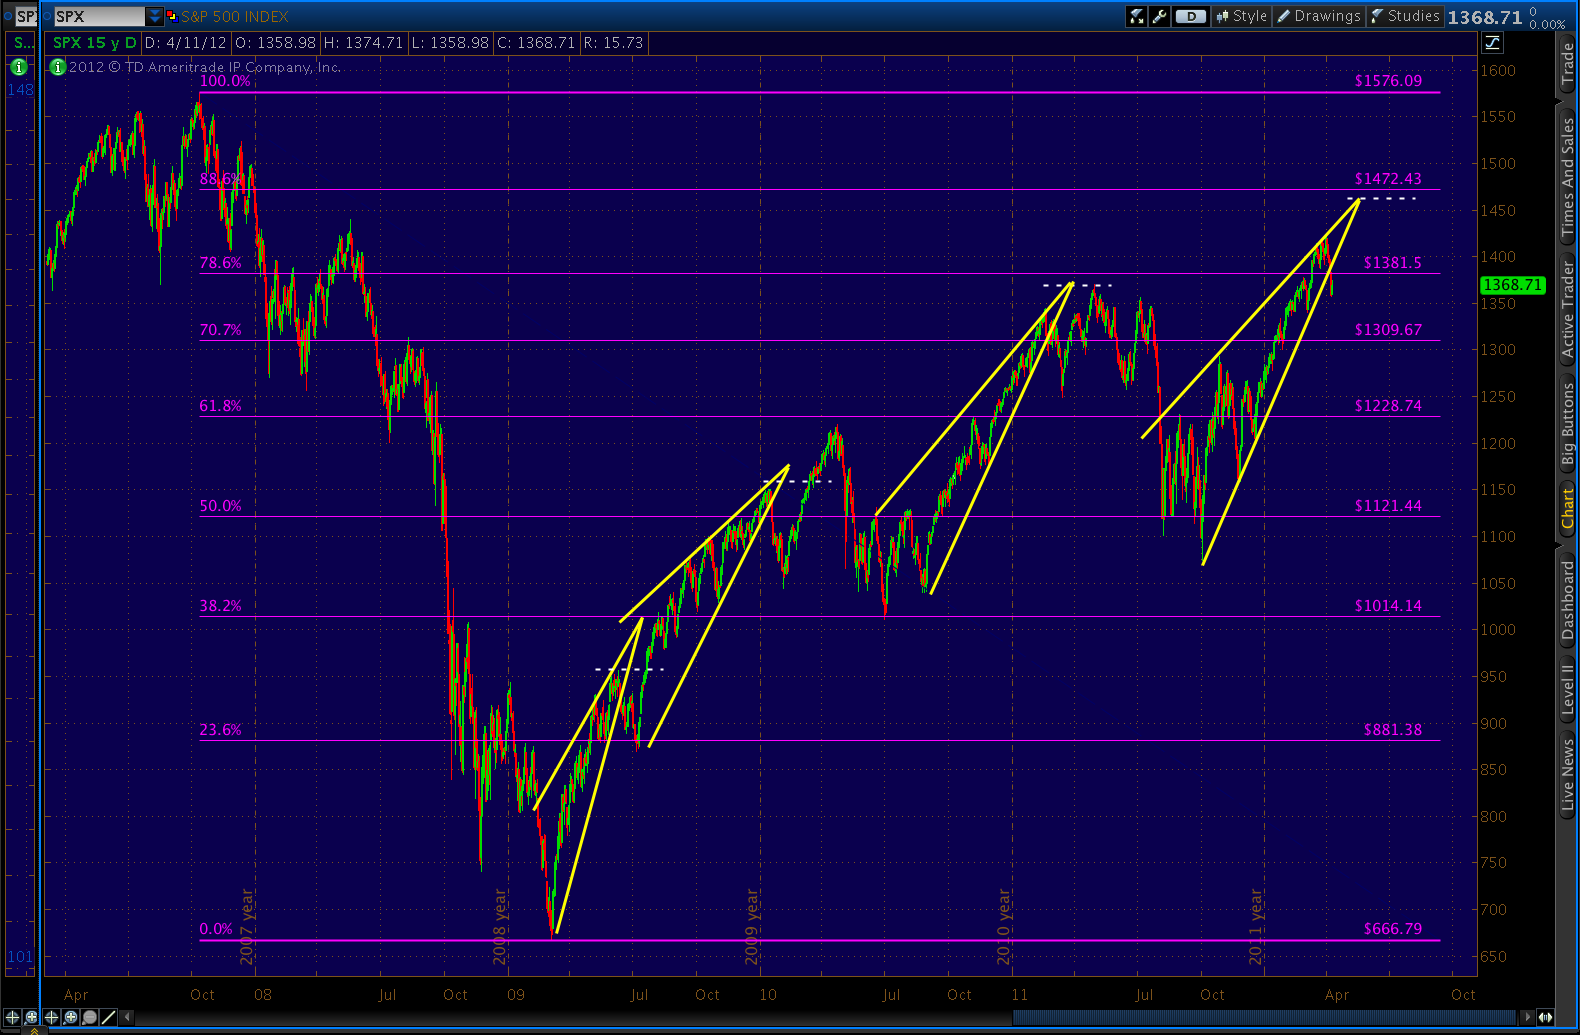
Seems just a little too coincidental that a TL connecting current prices to the 2007 high would be exactly parallel (log scale) to a TL connecting the two major bottoms of the past decade — all at a time when we’re:
at .618 (in time) of the huge rising wedge dating back to Mar 2009, and;
within a stones throw of the .786 or .886 retrace (take your pick) of the 2007-2009 decline.
Here’s a couple of charts with the Fibs thrown in.
If you’re an überbull, there’s a potential silver lining. The May 2nd 1370 peak — a .786 retrace of the 2007-09 drop, could be the Point B of a much larger Butterfly pattern. If it were, we’d have a 1.272 extension up around 1823 and a 1.618 at 2137.
Of course, if you are an überbull, you’ll probably want to use the arithmetic instead of log scale and draw your channels more like this:
>
Of course, that scenario would probably mean $8 gas, 12% T-bills and $3000 gold to go with our $20 trillion in debt. But, that might just be the price of a “healthy” economy, right Ben?