Author: pebblewriter

  • Fed Still in Protection Mode

    Short version of the Fed statement: “Everything is simply fabulous; but, we’re going to hold off for at least a few months on raising rates because you just never know…”

    Apparently, after 7 years of lower or zero interest rates, we’ll never know.  There was some word tweaking that I’ll leave to the linguistically-focused.  The only thing that matters is that central banks and their lackeys everywhere swung into action as soon as the “market” reached our second support level.

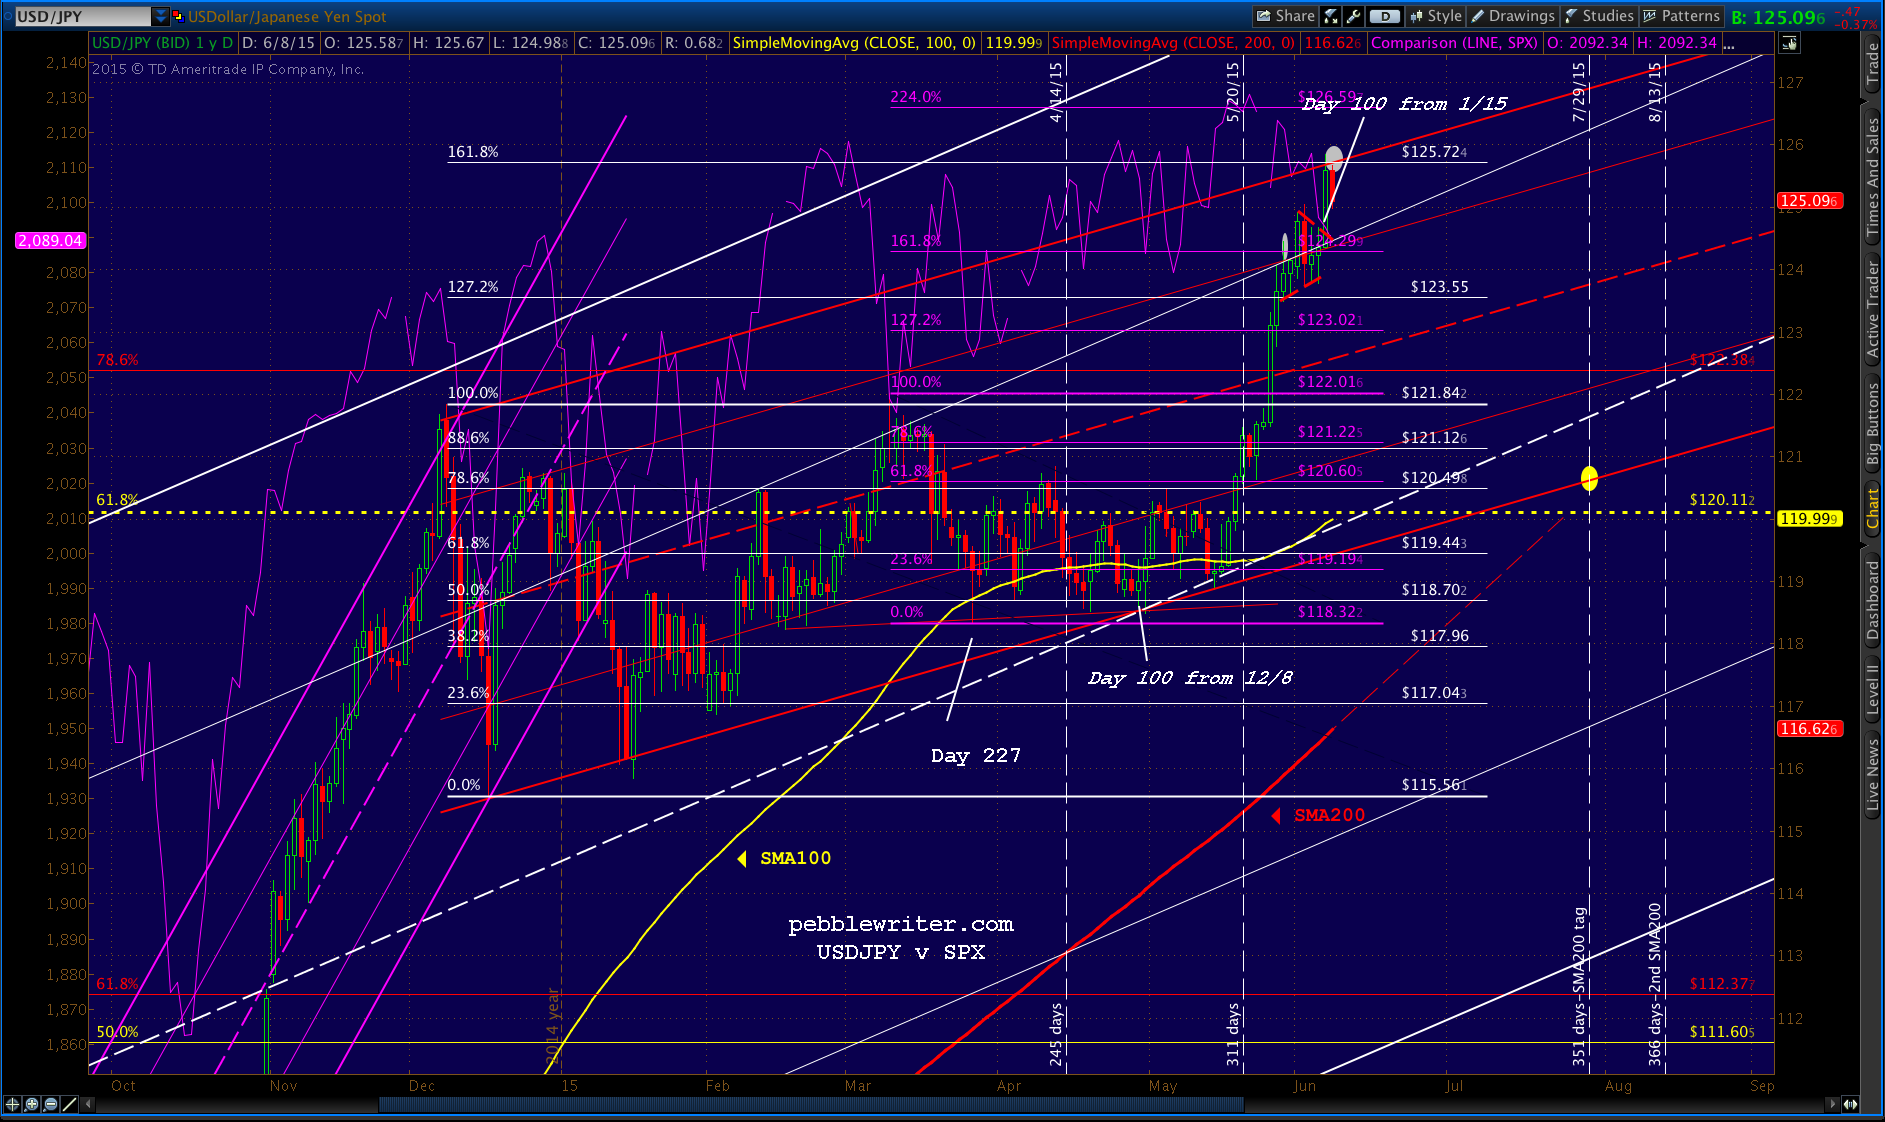
    With the futures off a few points a half hour before the cash open, USDJPY and CL are working overtime to prevent all that fabulousness from spilling over into an ugly response to the FOMC.

    USDJPY broke out of the small falling purple channel and above the big red channel midline.  Who would’ve thunk it?2015-07-30-USDJPY 15 0600…and, CL broke out of the falling red channel and is busy chasing skyward to flesh out the new, wider white channel I’ve proposed.  Watch out for the backtest.

    2015-07-30-CL 15 0600Just a reminder, I’ll be on the road today and tomorrow. I should get a few chances to post updates here and there, but all of yesterday’s targets and analysis (members’ section) are still appropriate.  There is some pretty useful stuff updating our analog and its implications for the next few weeks.

    * * * * *

    Members: I’ve finished updating the performance figures for the first six months of 2015.  So far, so good, as we’ve averaged over 13% per month.  The full results are available HERE.

    Also, for those not on the mailing list, we announced a significant promotion on annual memberships late last night.  A snippet from that announcement:

    NOTE: To celebrate the relaunch of pebblewriter.com, we are offering Charter Annual Memberships for only $850 to the next 12 members who subscribe. This locks in your annual membership cost for the life of the site. 

    It’s a pretty sweet deal, as members who are still paying $500/year from 2012 (versus the standard $1,200) will attest.  Get a full year of great research and analysis for the price of less than six months at the monthly rate of $150.  And, your rate is guaranteed to never go up.

    The full details may be found HERE.  If the post is still up, there is still availability (or, I haven’t had a chance to get to my laptop.)

    Good luck to all!


  • Pebblewriter Results Update: Jan – Jun 2015

    Beginning in January 2015, I resumed identifying potential turning points in SPX based on my harmonic, chart pattern, analog and technical analysis.  The data shown below are the results of that research.

    Up until July 2013, I had tallied monthly performance figures based on specific intra-day long/short calls for SPX.  I then took an 18-month break from daily posting to actively manage a hedge fund.

    In January 2015, I resumed daily posting that identified anticipated turning points.  This gradually evolved into specific long/short alerts, culminating in late June with the availability of memberships and the return of the much-beloved blue boxes.

    How well any individual member fares with our forecasts will depend on the type and effectiveness of trading they do.  I, for instance, am a much better forecaster than trader.

    Regardless, it’s my opinion that, whether you’re an active trader or a buy-and-hold investor, knowing potential turning points, periods of elevated danger, etc. is much better than crossing your fingers and hoping for the best.

    [see membership information HERE.]

    Note:  These results are by no means intended to indicate the results that current or future subscribers might achieve.  See full disclosures at the site’s Results Page.

    Screen Shot 2015-07-29 at 1.52.35 PMA Quick Summary

    January was an outstanding month as the “market” was allowed to settle after a flurry of algo-inspired moves designed to generate a positive year-end in 2014.

    February was in equal parts dismal. It took me most of the month to figure out the CL algo nonsense that was sharing duty with USDJPY in driving prices higher.

    March made more sense once I understood the CL algos better; though, the latter part of the month was consumed with big picture work on the current analog.

    April was even more consumed with the analog and a confusing series of higher highs that kept busting harmonic patterns, one after the other.

    May was significantly easier, as the day-to-day intentions of USDJPY and CL was much more apparent.

    And, June was terrific. As the analog played out, I was able to focus more on swing moves rather than very short-term trades.  I began offering memberships again, and started using the “blue boxes” to alert members to changes in my stance.

    July is shaping up even better, with interim results of around 11% at mid-month.

    Note: I recently altered the format of the daily “trading” log (available on the site’s RESULTS page) to include multiple upside and downside targets that are often in play.  It’s faster and easier to maintain, which allows me to track the effectiveness of any particular strategy.

    And, now that we’re caught up through the first half of the year, I’ll post each month’s results within a week or so of the following month. Please feel free to offer any suggestions that will make the site more useful.

    GLTA!

  • Incredulity

    When I first discovered the current analog back in March, it fascinated me that such an obvious pattern even existed.  I had pretty much resigned myself to never finding another one as spectacular as the 2011 as 2007 analog.

    It has obviously helped our daily forecasts tremendously.  But, best of all, it has made it possible to believe the impossible.  Chartists like me are looking to make sense of the many patterns in the market.

    It would have been impossible to accept the twists and turns we’ve seen over the past year were it not for understanding the grand scheme underlying — and, unifying — the whole stinking pile.

    yellen upWhich reminds me — the FOMC statement is due out at 2pm today.  Fed days are always difficult to trade.  With expectations so high on both sides of the “will they or won’t they raise rates” debate, best wait for the dust to settle.  We’ve had an excellent month so far; why tempt fate?

    Having said that, I do have some thoughts about what to expect.

    continued for members(more…)

  • CL Pulls One Out, Again

    Screen Shot 2015-07-28 at 2.19.57 PMWhen a rally fizzles because USDJPY is faltering, CL can usually be counted on to come to the rescue. Such was the case with this morning’s pop and drop  (the drop just plain looked bad, coming as it did during the FOMC brain trust’s powwow.)

    What’s an HFT-wielding central banker to do?  Simple: CL, which tagged the 78.6% retracement of its sharp rally from its March lows overnight, suddenly popped a full 3.8% in under 8 hours.

    There wasn’t any news.  There wasn’t any change in the fundamental supply-demand picture.  Just the need for an immediate reversal before last night’s emini ramp job turned negative.  Some folks would call this manipulation.  To me, it’s just another day in our centrally planned “markets.”

    HOW DO THEY DO THAT?

    Here, in all its algo-ramping glory: TL tags the .786 Fib, then breaks out and backtests the white falling wedge before making a bee line to the falling red channel top.  Naturally, it was ready to reset after the close.

    Here’s the 5-min chart: 2015-07-28 CL 5 1159The 60-min chart, however, shows it never broke out of the falling red channel.  In other words, the downward trend represented by the channel is still intact.

    2015-07-28 CL 60-min 1136It could do it all over again, tomorrow, of course.  Such is the nature of today’s “markets.”

    2015-07-28 SPX 5 1159Pebblereaders know that USDJPY drives most of stocks’ gains.  It has since the 2011 lows.  But, when it needs to reset — as it is now in observance of our analog — then CL is usually able to keep things on the rise.

    It’s why DX has ceased to act as a valid indicator of “market” direction. And, for bulls, it’s a classic manifestation of “heads we win, tails you lose.”

    HOW IT WORKS

    A rising USDJPY drives stocks higher, and entails a falling yen and rising US Dollar — the classic yen carry trade [explained here.]

    A rising CL, on the other hand, drives stocks higher but entails a falling dollar. The yen might rise at the same time.  But, more often than not, it stays put and the euro rises to offset the USD’s drop.  It’s more fuel to the fire, as a strengthening euro is viewed as a sign of confidence in the failing union.

    TODAY’S EXAMPLE

    The relationship can be clearly seen on today’s charts.  The 5-min USDJPY is seen in the chart below, with ES shown as the thin purple line. When it bumped up against the falling purple channel line and started falling again, ES normally would have followed along.2015-07-28 USDJPY v ES 5 1221But, at that exact same moment, CL had broken out of white falling wedge, backtested it, and was one its way to new highs (breaking through the small trend line shown in red.)  2015-07-28 CL v ES 5 1427Once CL reached the top of the falling red channel and could go no further without really making headlines, USDJPY magically reversed and was ready to take over the algo activity.

    If you don’t watch this stuff every day like I do, then it’s hard to notice.  That’s because the Fed, BOJ and ECB are more subtle about it than the PBOC.  To the casual observer, it seems like the market just  always goes up, no matter what the news, economic data, etc.  Now, at least, you’ll know why!


  • Backtest, or More?

    Following the 5th sell off in a row, the S&P 500 futures reached the SMA200 again yesterday.  It started with a sell off in USDJPY (yen strength, dollar weakness.)

    So, it’s only natural that when the panic button was pushed, it activated an overnight ramp job in USDJPY…2015-07-28 USDJPY 60 0620…and, thus, ES.  Look carefully, though, and you’ll see that ES merely backtested the broken white TL off the 2009 lows and is drifting lower. It correlates with USDJPY’s backtest of the red channel midline.

    In other words, this rescue will likely be something less than an actual reversal.  Pop and drop, anyone?2015-07-28 ES 60 0620continued for members(more…)

  • At Last

    The long-awaited final movement of the analog we’ve been watching for four months is here.  Originally floated on Mar 27, it has done a bang up job of signally the USDJPY’s moves which, in turn, have helped tremendously in our daily forecasting.

    Though I’ve vacillated on the target price over the past couple of months, the timing looks to be rock solid.  From our June 8 post:

    2015-06-08 USDJPY daily 0630

    The next key date as originally forecast several months ago is this Wednesday, July 29.  USDJPY is already tumbling… 2015-07-27-USDJPY daily 0605…and, as we discussed last week, NKD is tumbling right alongside it — getting closer to that dreaded H&S Pattern we’ve anticipated.2015-07-27-NKD daily 0605SPX reached our next downside target on Friday a few days ahead of schedule — which means that target was probably too conservative.

    While there will no doubt be bounces along the way, the key is to remain short until we reach our next downside targets posted last week.  It will probably be scary, but it should be a very profitable week.

    continued for members(more…)

  • Update on Gold: Jul 24, 2015

    I sympathize with my goldbug friends who are, quite rightly, alarmed at the degree of manipulation going on in gold futures.  It’s been happening for quite some time, and so I hesitate to put much energy into charting it anymore.

    In our last major update on Jan 23 [see: Gold Recovers its Luster], I wrote:

    The close-up shows the stronger case that could be made for a drop to the yellow .500 Fib level.  But, TPTB apparently decided that would be bad for business (or under-collateralized ETF’s, depending on whether or not you trust the bankers.)  As a chartist who believes most “markets” are highly manipulated lately, I have my own thoughts on the matter…

    For those who are interested, however, it’s worth noting that GC just tagged that yellow .500 Fib level and the bottom of a fairly well-formed channel at 1072.3 that should mean a significant bounce. The initial target would be the neckline (1140) of the just-completed H&S Pattern (that targets 970.) If things really got going, 1285 looks mighty interesting.

    2015-07-24 GC daily 0615Take all of this with a pound of salt, because the predatory manipulators are quite well aware of these patterns.  And, they know full well that the best way to wipe out a bunch of traders is to bust very obvious patterns.

    A casual glance at the long-term chart shows many anomalies that never should have occurred, but quite obviously did.  So, these charts are presented purely in the spirit of understanding what TPTB might have in mind as they script gold’s next moves.

    2015-07-24 GC big 0615With that said, if GC doesn’t bounce here, it opens up the purple 1.618 extension at 1024, the H&S target at 970, the white .786 fib at 946.9 and (the most interesting target IMHO) the yellow .618 at 891.20.

    GLTA.


    (more…)

  • Charts I’m Watching: Jul 24, 2015

    SPX came within a few points of our next downside target yesterday.  I suspect we’ll nail it in the opening hour before getting a significant bounce.  All of our targets from last Monday remain unchanged.

    Going around the horn, USDJPY won’t hold off much longer…

    2015-07-24 SUSDJPY daily 0615…CL continues to weaken…

    2015-07-24 CL v ES 60 0615…and, EURUSD is pausing in a backtest before the next leg down.

    2015-07-24 EURUSD daily 0615A reminder of our downside targets:

    continued for members(more…)

  • Charts I’m Watching: Jul 23, 2015

    SPX just reached our next downside target: the SMA50 at 2102.57.  From Monday’s forecast:

    Initial support is at the .886 at 2124.37, followed by the purple channel top at 2119 and SMA50 now at 2102.

    2015-07-23 SPX daily 0922It could get a bounce here, but there are several lower targets that will easily come into play if USDJPY cooperates.

    continued for members(more…)

  • What Oil’s Slippery Slope Really Means

    As oil prices continue to settle lower, the scrutiny of their fundamentals in the financial and popular press has intensified. There’s nothing wrong with fundamentals.  Once in a while, they still matter — a nod to nostalgia, no doubt.  But, we’re focused on technicals and the impact lower CL prices have on the overall “markets.”2015-07-23 CL 4 0615I have yet to see anyone else touch on one of our central research tenets: more affordable oil makes a cheaper yen more tolerable for Japan — one of the biggest oil importers in the world.  And, as long as the yen — currently 124 to the US Dollar versus 75 in Oct 2011  — can be trashed even more, then the all-important yen carry trade is safe.

    See: The Yen Carry Trade Explained

    As we’ve shown countless times on these pages over the past year, the yen carry trade has been the single greatest factor in driving stocks higher.

    When the yen stops getting cheaper in dollar terms, trillions in carry trade bets will unwind and stocks will sell off.  So, it’s critical to the “market” that it keeps getting cheaper.  And, because the Bank of Japan has rationalized their massive QQE with the “fact” that inflation is nowhere to be found, rapidly rising oil prices would be inconvenient.

    BACKGROUND

    As we detailed last March in Those Wacky Central Bankers, cheaper oil was the only way to make the puzzle pieces fit.  After Fukushima, rising oil prices were becoming a serious impediment to the deflation spin.

    The excellent Index Mundi shows the near tripling of oil priced in yen since 2008.Screen Shot 2015-07-23 at 6.54.51 AMOil priced in US dollars, by comparison, was quite stable between 2011-2014.

    Screen Shot 2015-07-23 at 6.57.01 AMWhy the sudden plunge in oil prices in June 2014?  It’s not as though the fundamentals changed overnight.  What did change overnight was the BOJ’s anxiety over stock prices.

    In a move that would make even China blush, the BOJ has constantly intervened to prop up its own stock market.  2014 marked a potential turning point.

    2015-07-23 NKD interventionThe April 2013 expansion of QQE had produced good results, but the trend was in danger of failing.  Starting in January 2014, NKD began a series of lower highs, and even put in a couple of lower lows to match.  As any chartist knows, this is a bearish sign.

    So, the BOJ (which, unlike the US Fed, is honest about its intervention) simply picked a line (red dotted) and prevented NKD from dropping below it.  This kind of intervention would later earn China widespread derision.  When the BOJ propped up its “markets”, Wall Street cheered.

    The BOJ kept the red triangle bumping along for almost 10 months.  Finally, in June 2014, when NKD was backtesting the white channel and the red triangle top, it became obvious that something had to give.  The BOJ needed NKD to break out.

    It had been barely a year since the last round of QQE expansion, so they turned instead to direct currency manipulation. The yen had been strengthening against the dollar for 13 years: from 147 yen/dollar in 1998 to only 75 in 2011 (its 2011 low came on the exact same day as SPX.)

    The QQE instituted in 2011 had devalued it to 105, which for USDJPY was a 61.8% retracement of its plunge following the financial crisis.  It was also bumping up against the top of a pretty well-formed falling channel (below, in red.)

    A reversal at this point (yen strengthing, USDJPY falling) would kill the carry trade. They needed a breakout, instead. The USDJPY chart below shows what happened next.

    2015-07-23 USDJPY breakoutStocks responded favorably, of course — especially after a further QQE expansion was announced a few months later.  But, the BOJ had a problem.  A cheaper yen makes imports more expensive.  Fresh food, for instance, rose over 11% in the past year alone.

    Screen Shot 2015-07-23 at 6.44.43 AMOil, which is priced in US dollars, had already tripled from its 2008 lows.  An even lower yen would be intolerable.  Not only would consumers and producers take a hit, but it would be that much harder to keep a straight face when announcing more QQE in order to reach that magical 2% target.

    The answer: cheaper oil.

    *  *  *  *  *

    To learn more about how CL and USDJPY dovetail with our analog that has accurately delivered important turning points for the past several months, see: USDJPY Analog Charts.  I’ve posted 2011 – 2014, and will be posting the final charts today.

    And, for those who are following SPX today, it just reached our next downside target posted on July 20.  For today’s blow by blow, click HERE.