

Quick update on the overnight action before the update continues from Friday:
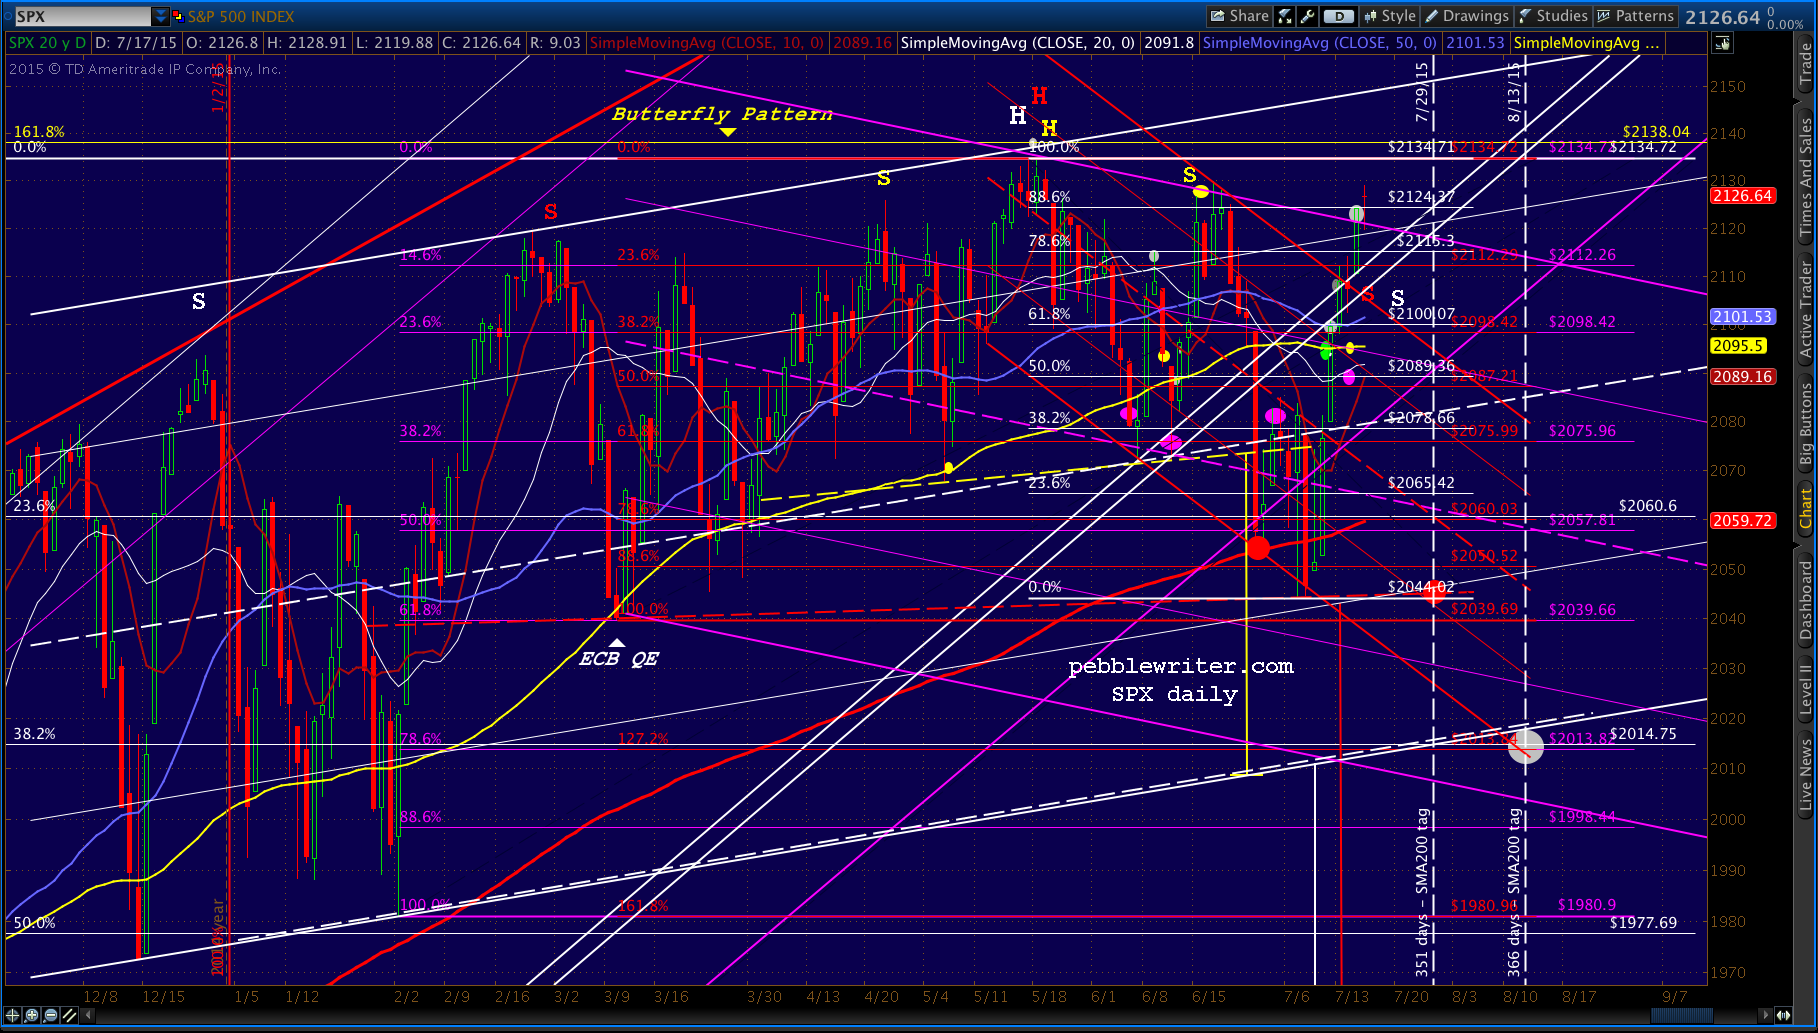
ES completed its Bat Pattern at 2122.63 and officially paid off our IH&S that completed last Monday… …thanks largely to USDJPY which, from all appearances, has settled above the red channel midline.
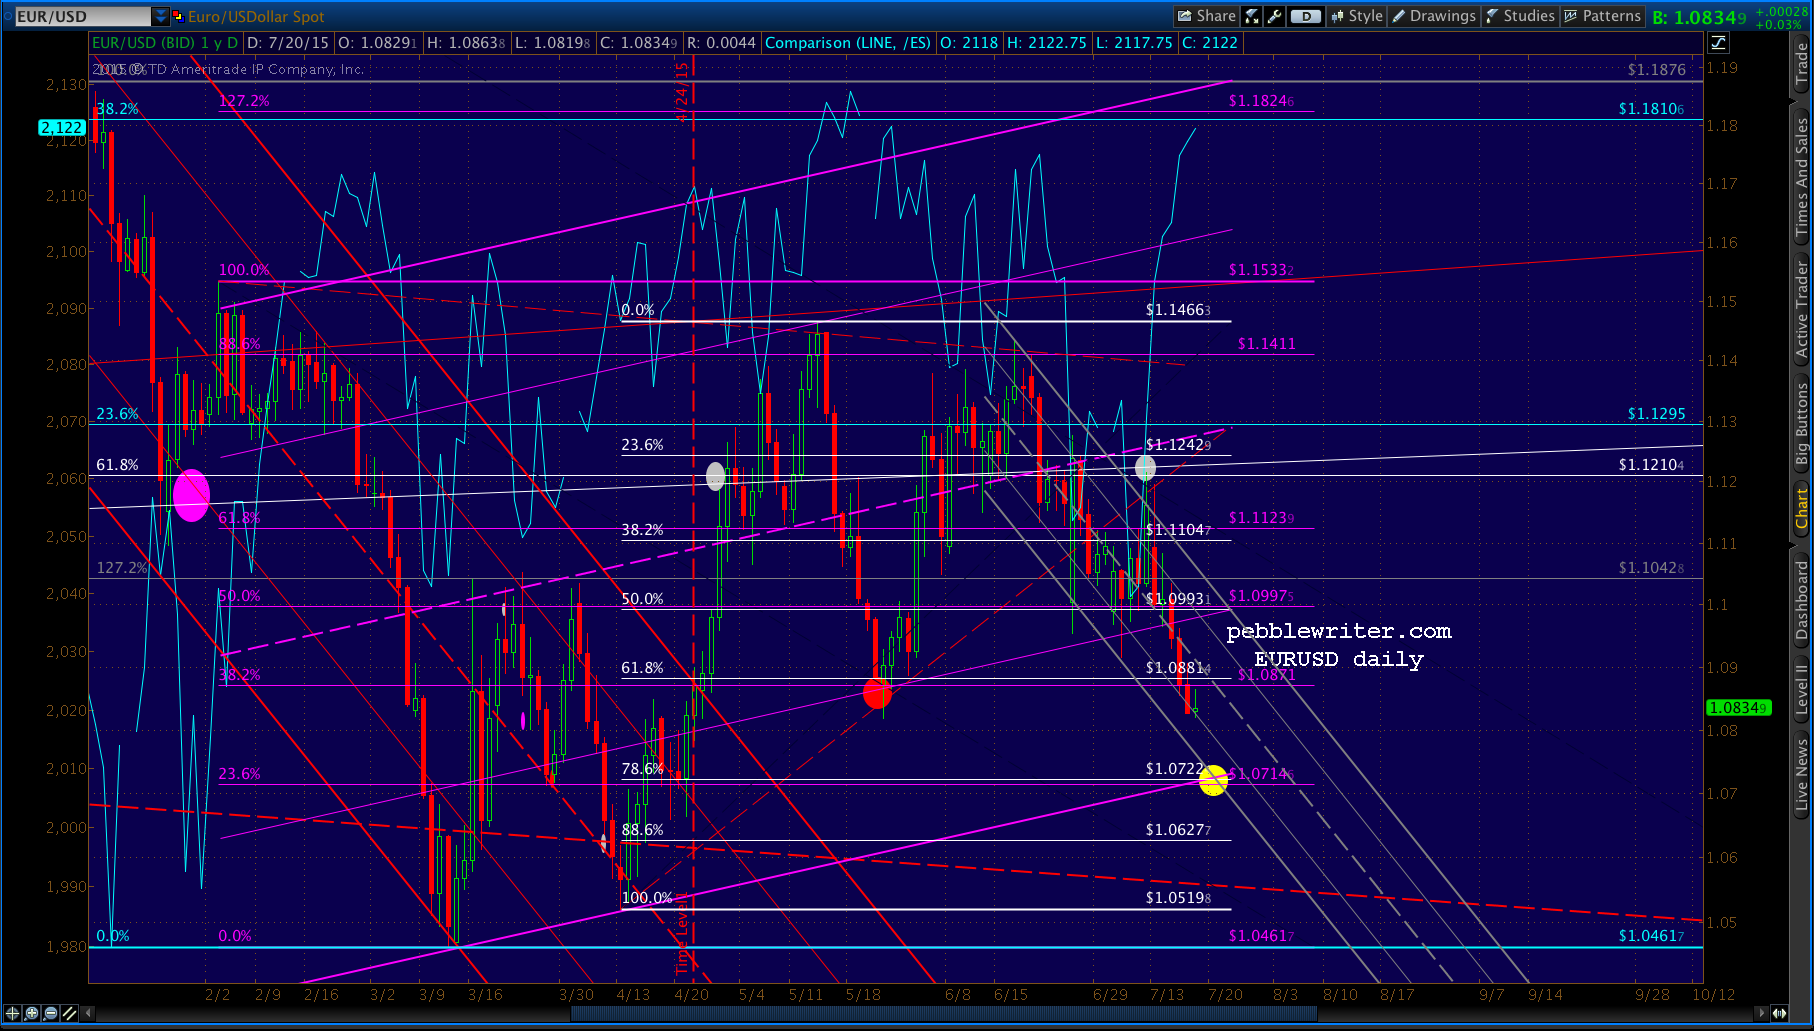
 EURUSD stabilized over the weekend, though we’re probably no more than a day or two from our downside target.
 With the yen and euro both settling lower, the dollar continues to show strength. It’s a good place to pick up on the short-term and intermediate forecast.
 continued for members…
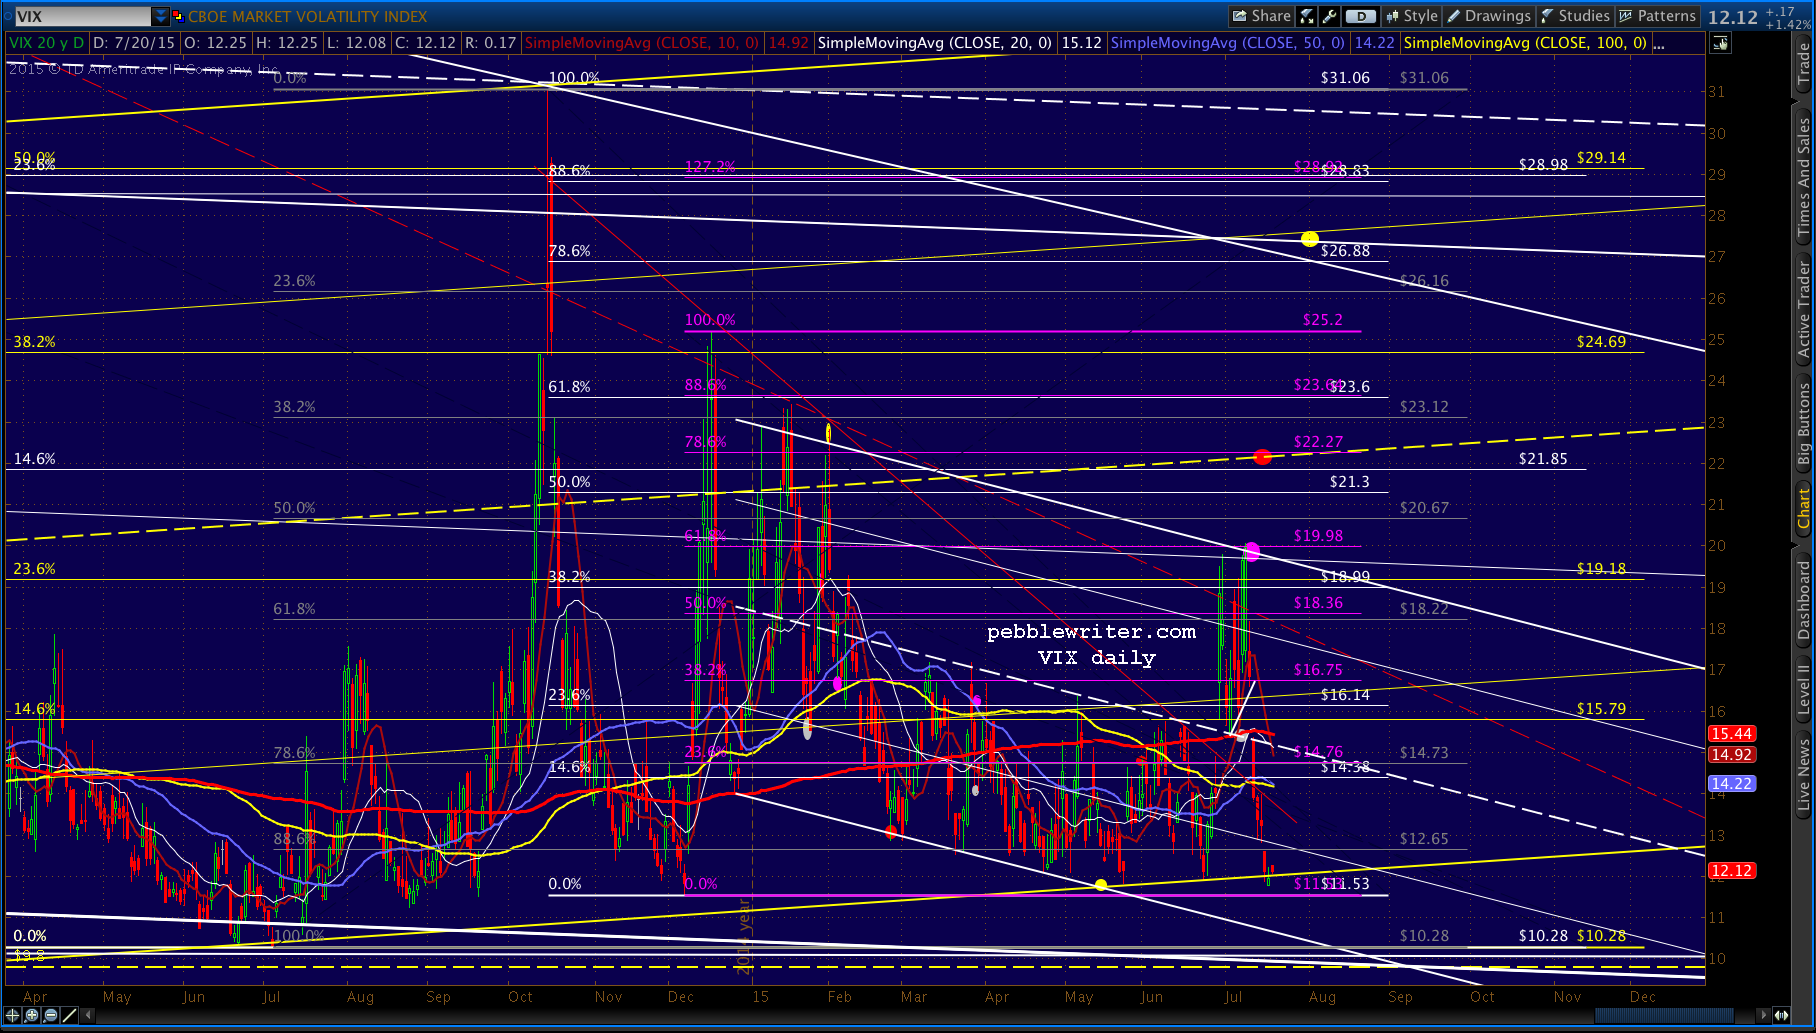
 As we noted on Friday, VIX broke down (albeit only slightly) below the yellow channel bottom. But, it has popped back above this morning. It’s a strange sequence of events, which I can only take to mean that the leap higher that a total VIX breakdown portends isn’t happening just yet.
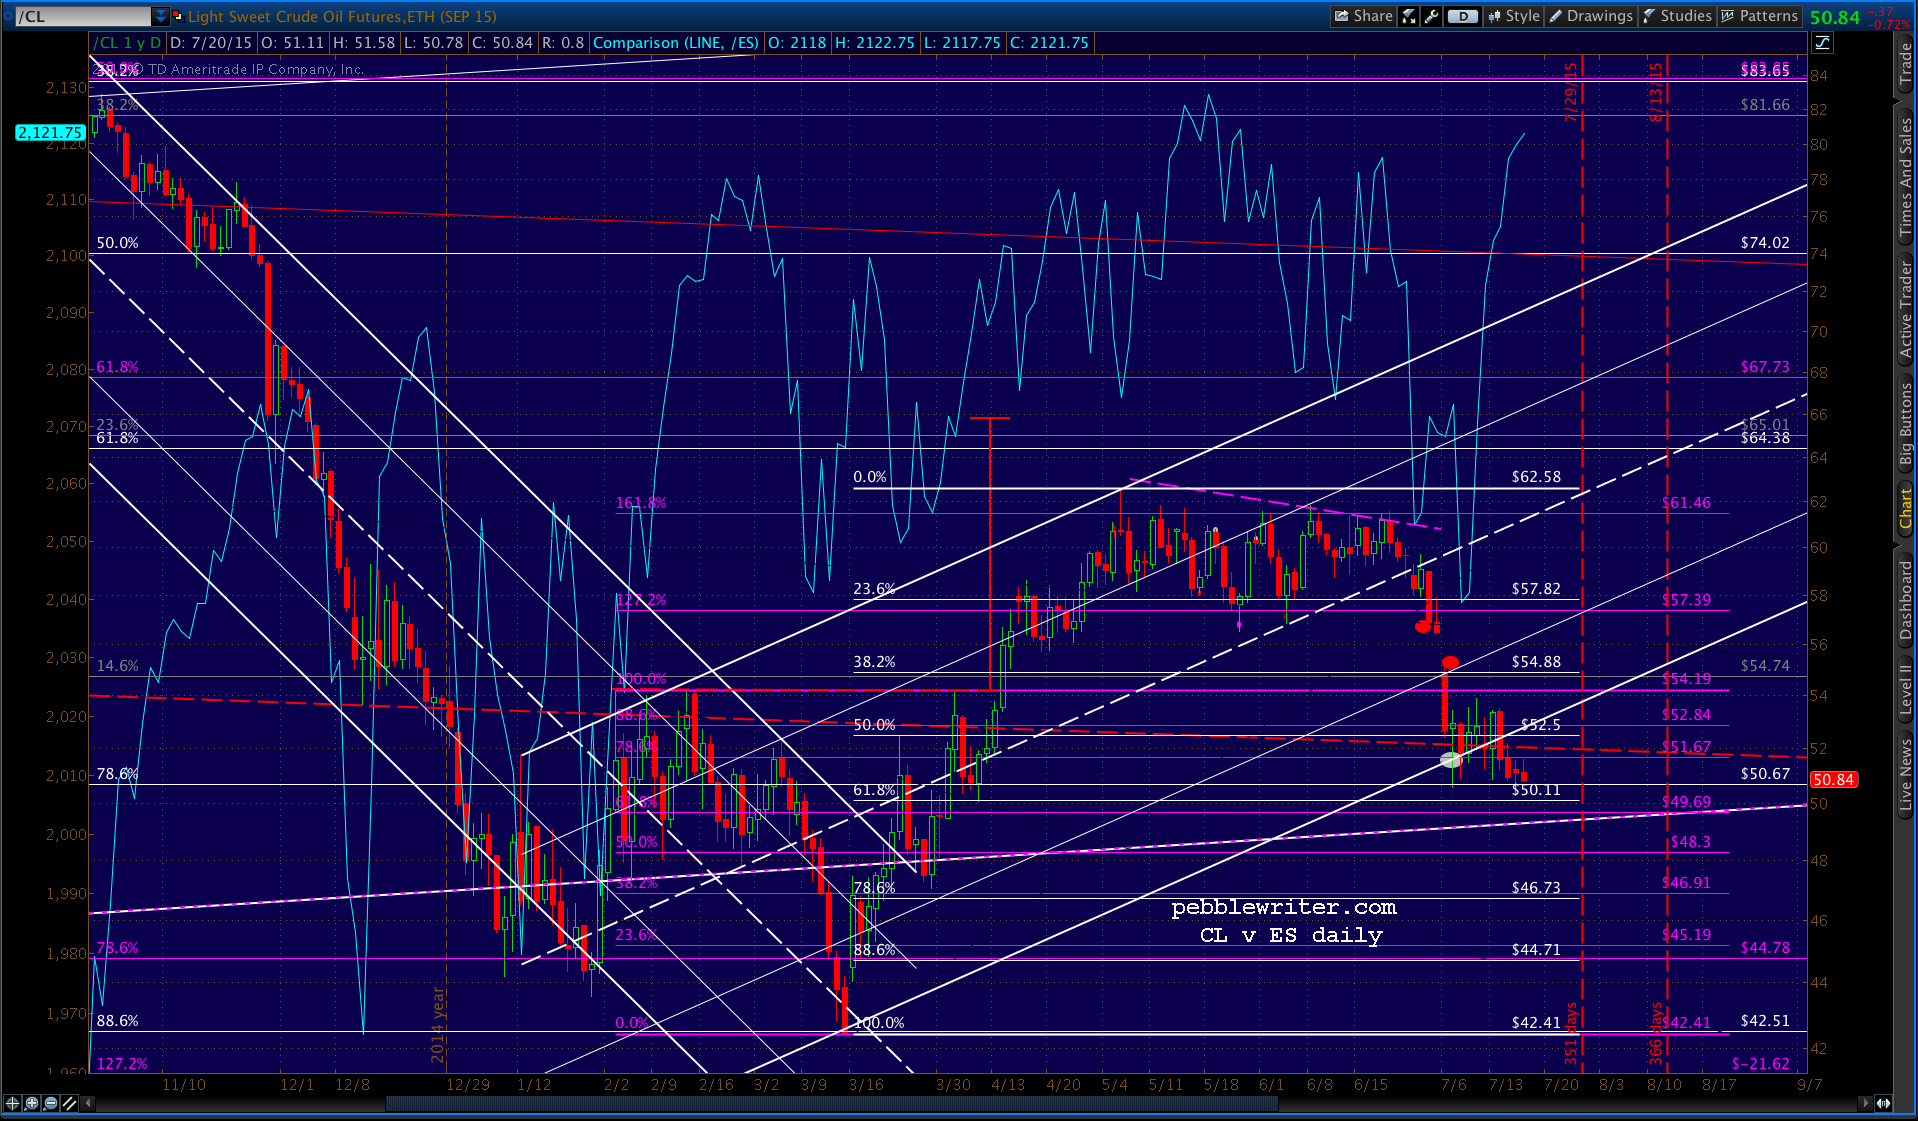
 And, as we noted last week, CL’s rising white channel has officially died. Though, given the fact that it’s loitering just above the .618 at 50.11, I wouldn’t write off a Lazurus-like recovery just yet. A strong bounce would be an effective tool to drive stocks higher or, at least, prevent a drop.
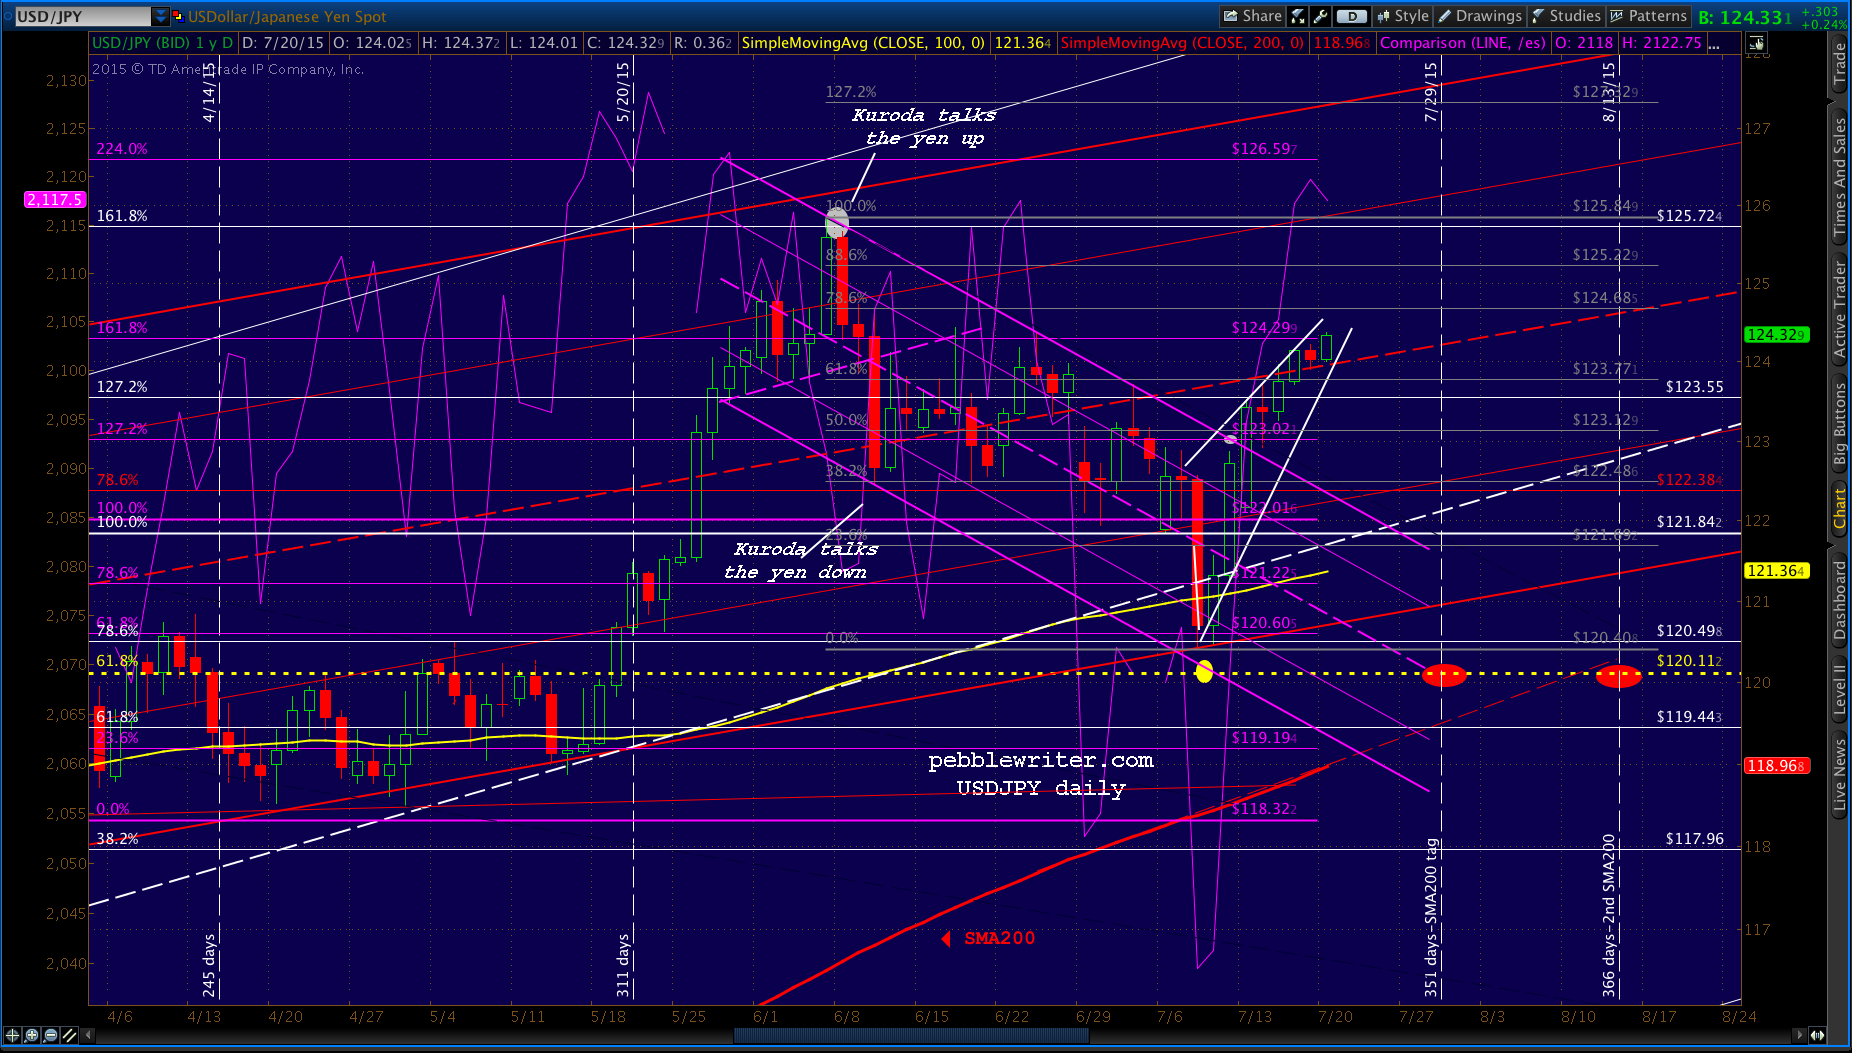
 And, now, on to the analog. I assume USDJPY wasn’t allowed to reach 120.11 on Jul 8 because the SMA200 hadn’t yet reached that level. Now that USDJPY has bounced significantly higher, even breaking the red channel midline, a drop to 120.11 would presumably mean a blow to SPX.
Did they ramp SPX up to these levels, with virtually no retracements along the way, just to let it deflate again? Yet, our analog says it’ll happen on either Jul 29 or Aug 13.
Even if they managed it closely, posting most of the declines overnight, it would still mean a significant drop from here at 2124.
I think a lot of it depends on CL. If CL were to plunge alongside USDJPY, stocks wouldn’t have much to prop them up. And, the big H&S Pattern we charted could complete down at 2044 or 2015.
If, on the other hand, CL were to rebound strongly at 50.11, it would give USDJPY all the cover it needs to complete the plunge to 120.11 in the next few weeks.
Like CL, EURUSD’s approach to strong support offers an opportunity for a big boost when the time is right.
 I’m going to take the next hour and construct charts from the two previous instances for comparison purposes.
ANALOG CHARTS – 2011-2012

SPX had just plummeted almost 300 points in a very short period of time after completing a Gartley Pattern (11 points short) in May 2011. Our analog, which predicted it perfectly, was broken (point 0) by the Oct 27 rally — the same day that the BOJ expanded QE.
USDJPY was still coping with the aftermath of Fukushima. The stock market’s plunge in late July/early August corresponded with a new low in USDJPY and its subsequent inability to regain lost ground. Finally, the BOJ swung into action on Oct 27 — busting our analog in the process.
Each subsequent data point noted on the chart corresponded with an important goal for SPX — either catching a falling knife or providing a boost up through overhead resistance.

A quick summary of the key moves by USDJPY that link directly to important threats/opportunities in SPX:
0. SPX analog busted when BOJ expands QE on Oct 27, 2011
1. small Bat Pattern (purple) busted when USDJPY tops SMA200
2. previous high and actual .786 busted
3. USDJPY and SPX SMA200s breeched, fixed
4. Big Bat Pattern completes – one day after QE3 launched
5. SPX tests yellow TL, USDJPY suddenly pops above SMA200
6. USDJPY breaks out to stop SPX from falling
And, by “link directly” what I really mean is manipulations in USDJPY in order to effect (or prevent) a specific action in SPX.
Coming up, 2013-2014.
Comments
3 responses to “Analog Update Part II: Jul 20, 2015”
correction: I mean the H&S chart you displayed in your 7/15/15 write up.
The red H&S pattern would complete at 2044 and target 1950ish.
You wrote in the above “And, the big H&S Pattern we charted could complete down at 2044 or 2015.” Is 2044 correct? Don’t you mean to write 1944 based on charts you displayed in your 7/9/15 writeup?