

When I first discovered the current analog back in March, it fascinated me that such an obvious pattern even existed. I had pretty much resigned myself to never finding another one as spectacular as the 2011 as 2007 analog.
It has obviously helped our daily forecasts tremendously. But, best of all, it has made it possible to believe the impossible. Chartists like me are looking to make sense of the many patterns in the market.
It would have been impossible to accept the twists and turns we’ve seen over the past year were it not for understanding the grand scheme underlying — and, unifying — the whole stinking pile.
 Which reminds me — the FOMC statement is due out at 2pm today. Fed days are always difficult to trade. With expectations so high on both sides of the “will they or won’t they raise rates” debate, best wait for the dust to settle. We’ve had an excellent month so far; why tempt fate?
Having said that, I do have some thoughts about what to expect.
continued for members…
First, note that CL is still within striking distance of a breakout — this after the .786 tag we detailed yesterday. 
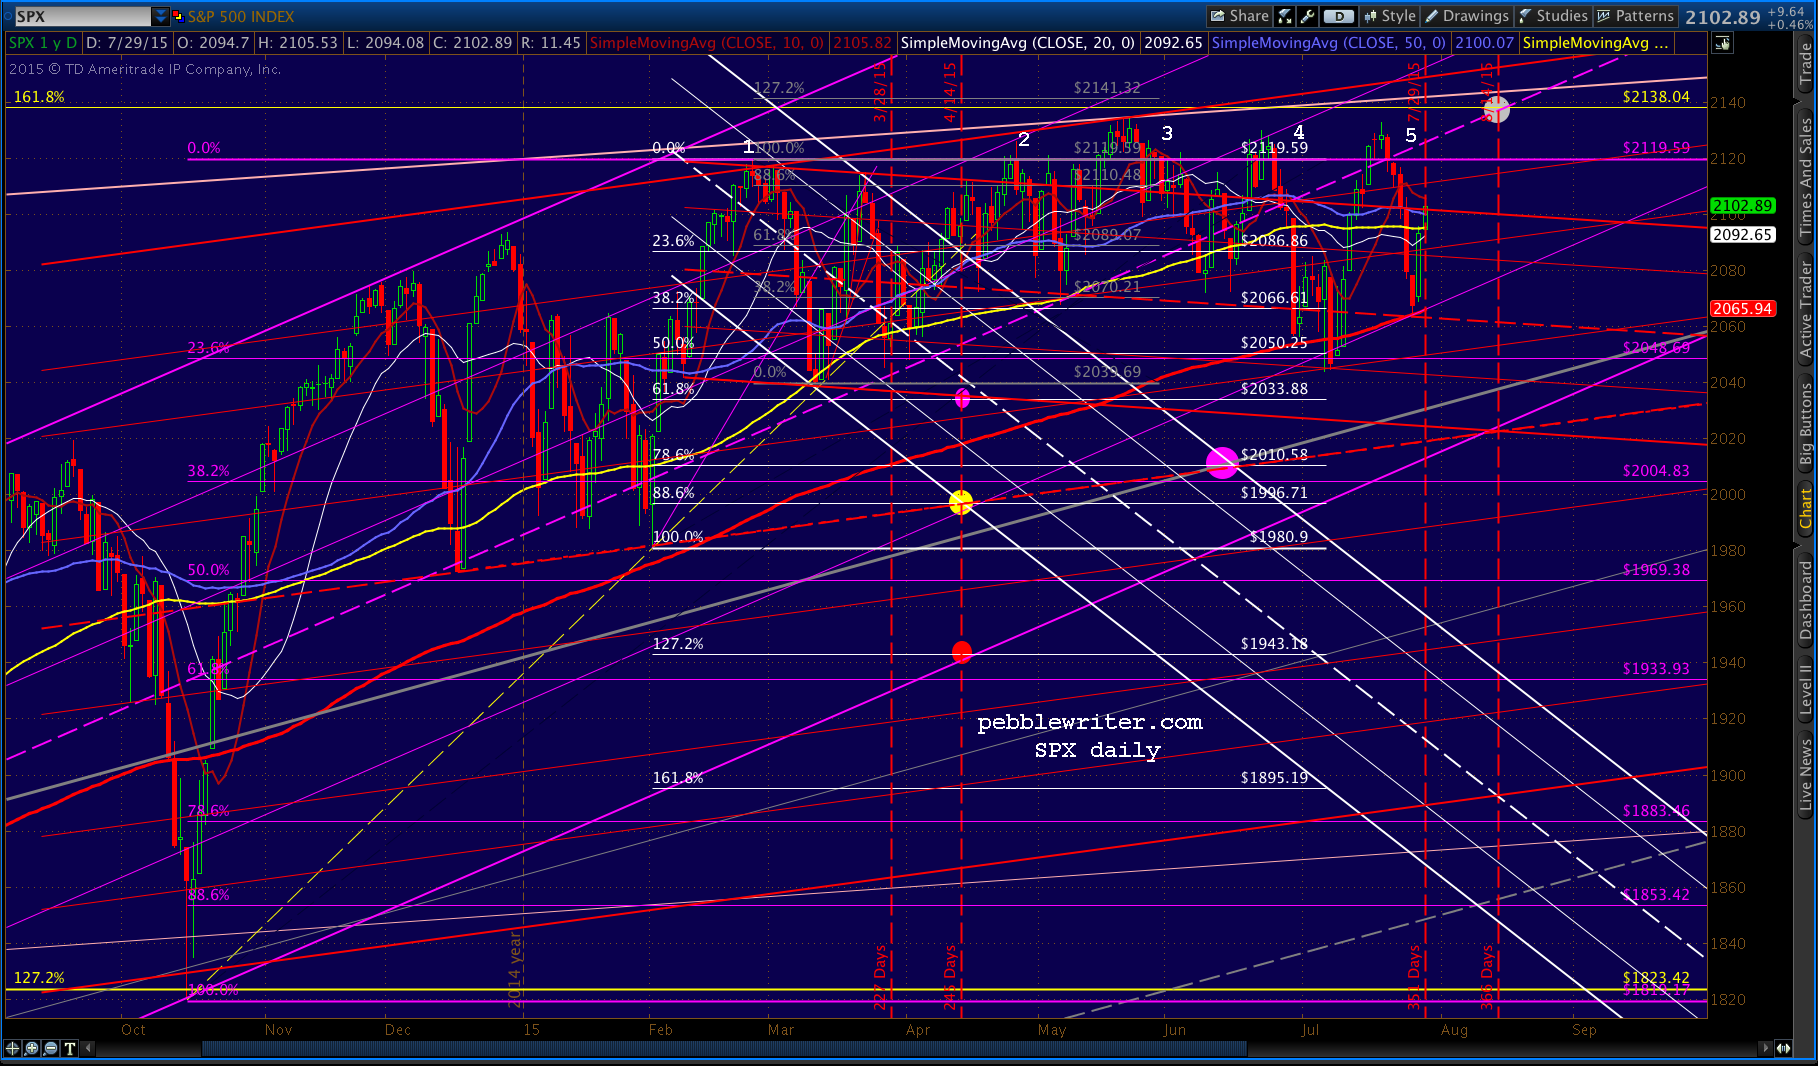
And, even though SPX tagged its SMA100 yesterday…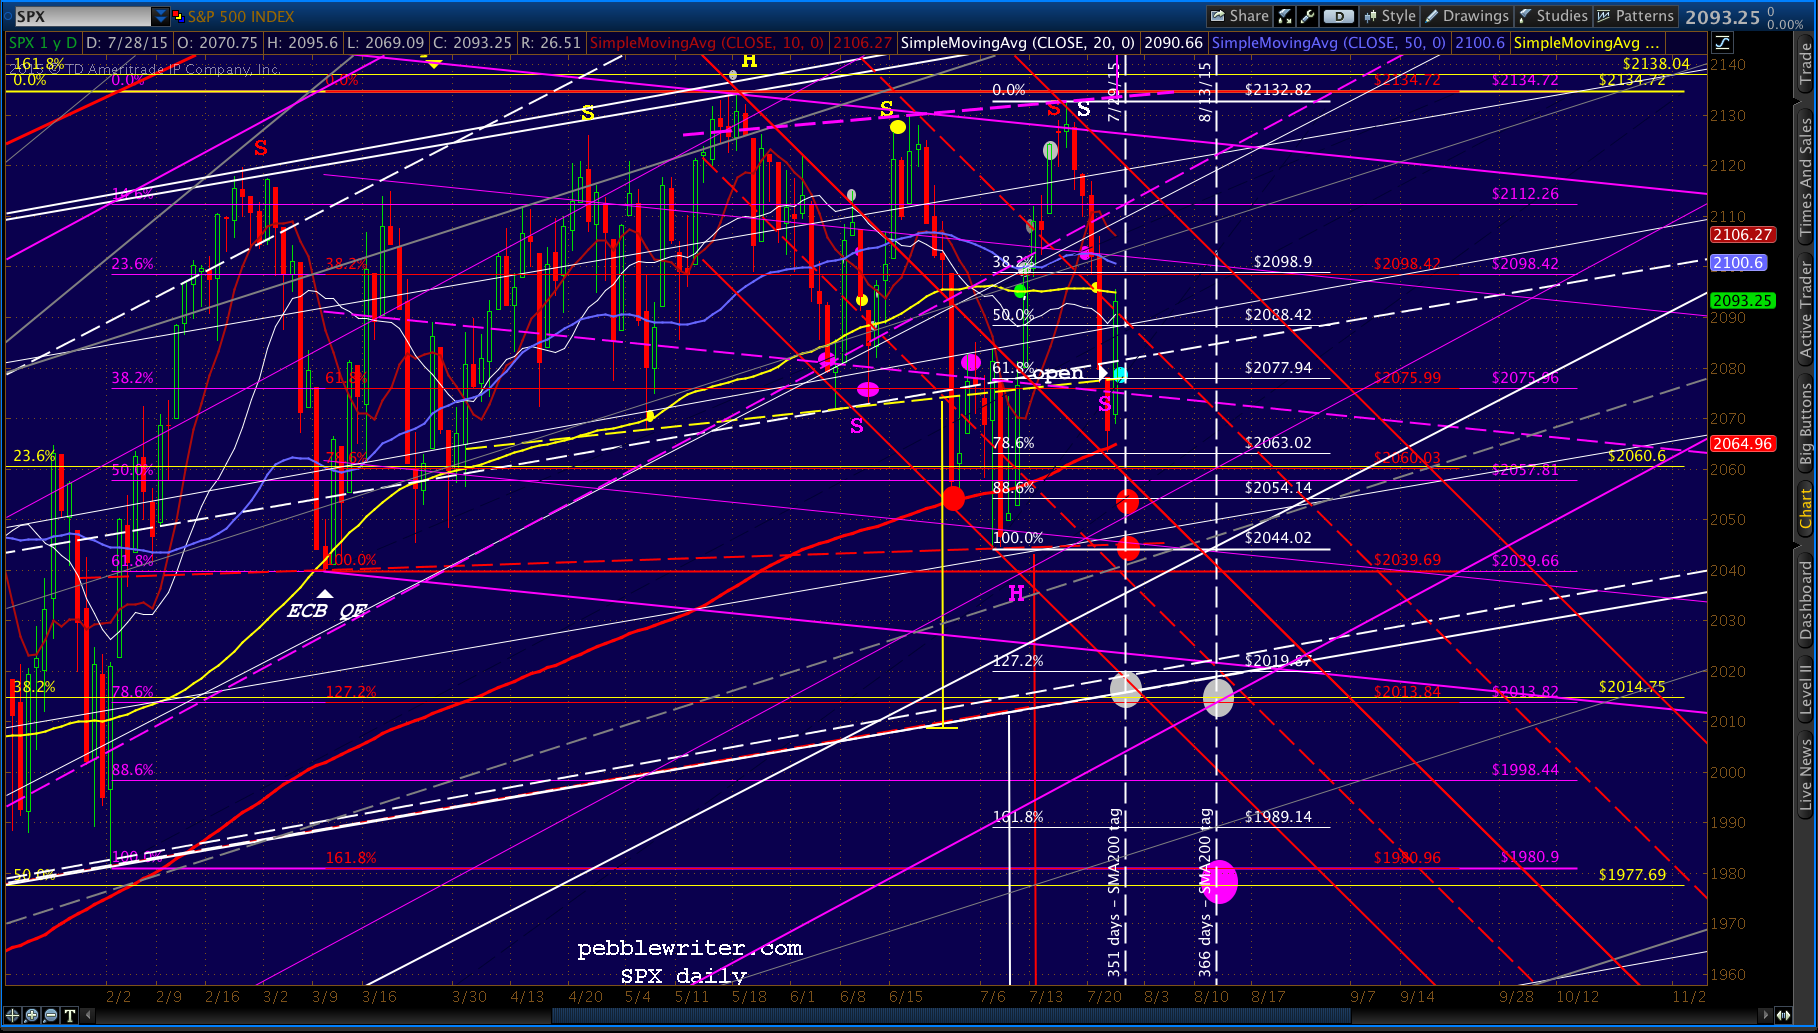
…ES did not until this morning. In fact, ES has also backtested a broken TL connecting the recent tops.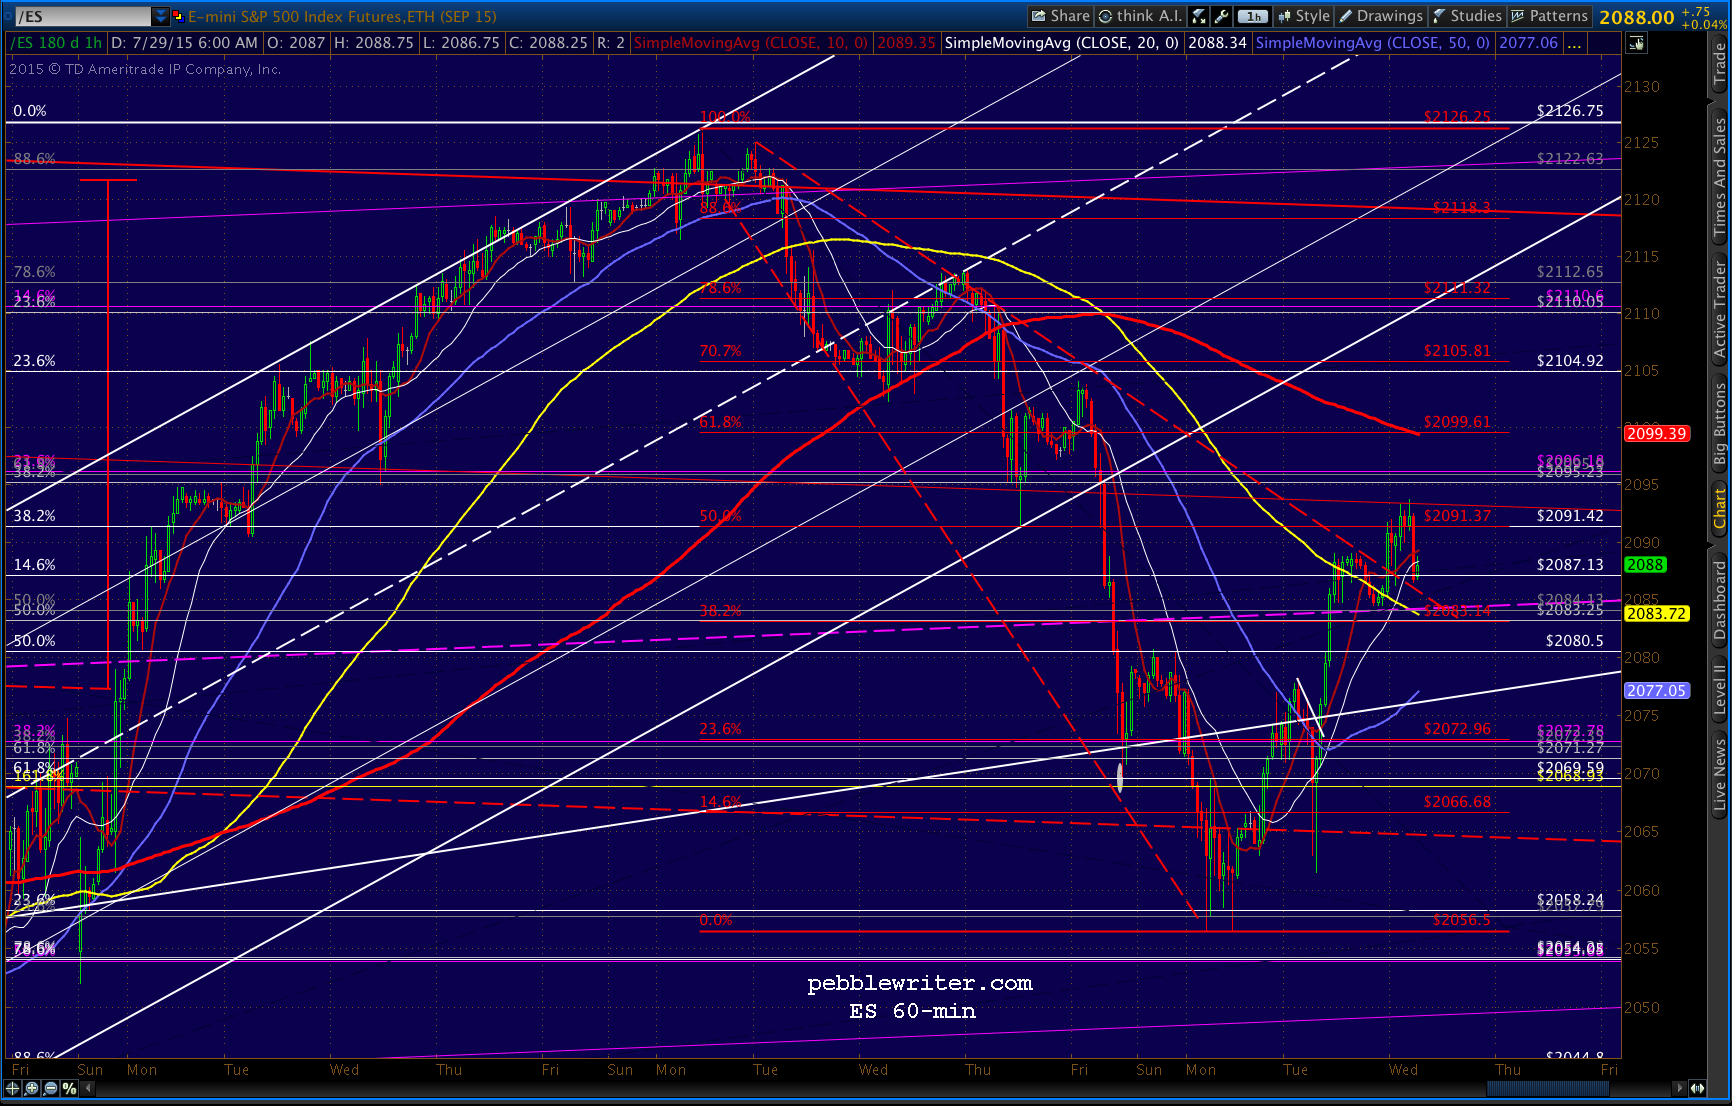
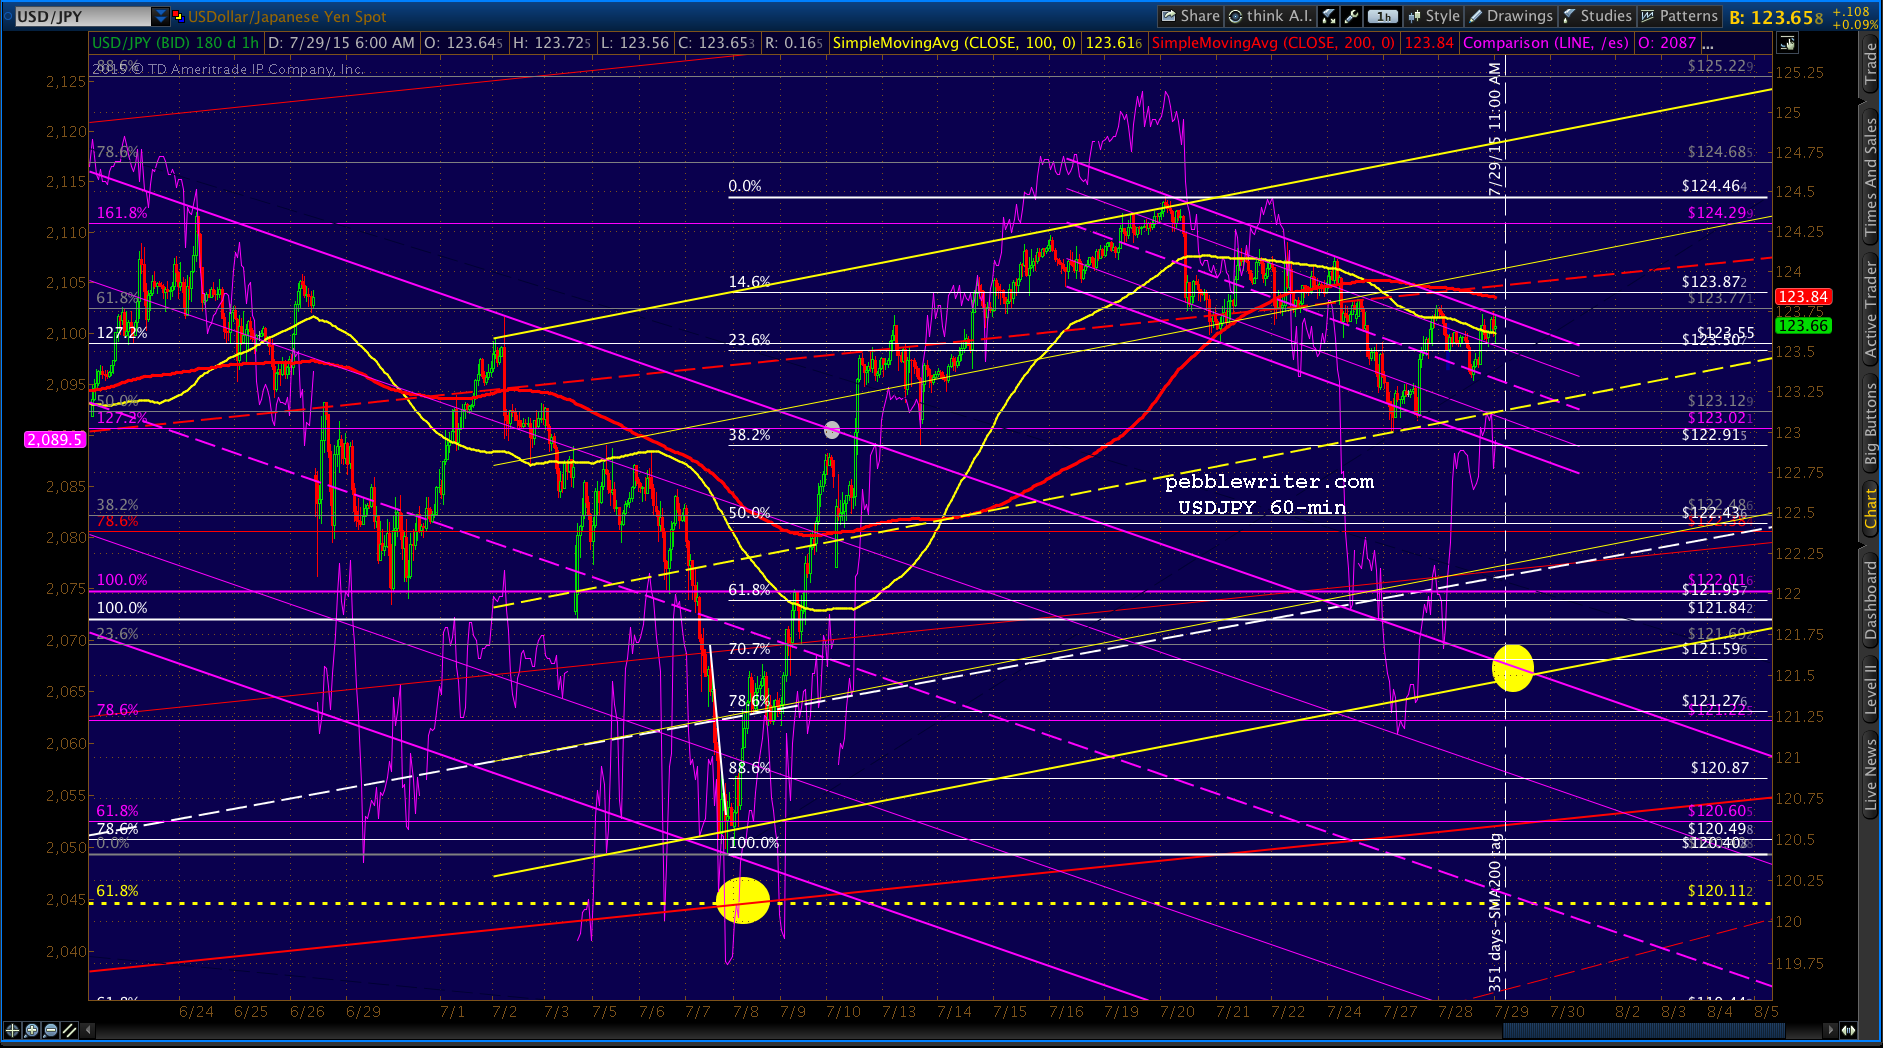
USDJPY is showing no signs of wanting to tag the SMA100, let alone the SMA200 today. 
Close up here:
And, the dollar appears to be poised for a breakout (yen weakness, USDJPY strength.)  And, VIX is sitting a razor’s edge away from a drop through a TL from last October (in red below) that would practically guarantee higher stock prices.

Put it all together, and it seems as though TPTB have the “market” covered six ways to Sunday in case the Fed says something upsetting today — even with yesterday’s SMA100 tag.
Of course, the flip side of the argument is that the bigger surprise (thus, catching more traders unaware) would be a big plunge. The Fed could announce a rate raise today, or even that there will be one in September. That would almost certainly enable SPX to reach some of those juicy downside targets of ours.
But, I think they’re content to let the media and pundits continue to “talk up” interest rates. They’ve done a fine job of it so far, and at this rate the Fed will have some wiggle room with which to cut rates the next time the “market” does something as ridiculous as correcting a few percent.
So, with all that said, here are the most outrageous forecasts I can come up with.
Bearish:
 Bullish:

How does all this tie in with the analog? In going back and compiling results for the past six months, I had to reread every single post (I hadn’t tracked results along the way.) Two things struck me.
First, it’s so easy to let a negative bias sneak into my forecasts. There’s a natural tendency (probably reptilian) to connect real world goings on with stock prices. That’s what they taught back in business school; it’s what I learned in baby broker school; it’s the way things are supposed to be. It’s probably the way things would be were it not for EIGHT YEARS of central bank interference and manipulation.
The second thing is how effective CL was at busting stock patterns. April was a very tough month performance-wise — almost entirely because it took me a while to figure out how effective the CL-inspired algos were at jumping in and driving stocks higher when USDJPY was cratering.
The analog originally called for a USDJPY SMA200 tag today, with a second tag on Aug 13. A 3.4% drop to the SMA200 today appears nearly impossible. A 1.8% drop to the SMA100 seems much more doable.
At present, USDJPY is breaking out of the falling purple channel. But, the flip side is that the red channel line has not yet been breached. 
In the event that neither tag happens today and USDJPY merely shoots up through the red midline, it would make sense according to the analog. Remember, the whole point of it is to drive SPX up through 2138.
In the previous instances, USDJPY struggled for months, eventually breaking out of a consolidation pattern after the SMA200 arrived. We posted this chart in April, comparing USDJPY and SPX. 
Compare it to these charts of SPX and USDJPY over the past year. I’ve left the chart drawings that were originally offered on April 9 in place. Note that SPX had recently topped out at 2119.59 — just a good 20-pt rally away from 2138. But, with little other support nearby, it would most certainly have resulted in a steep downturn.
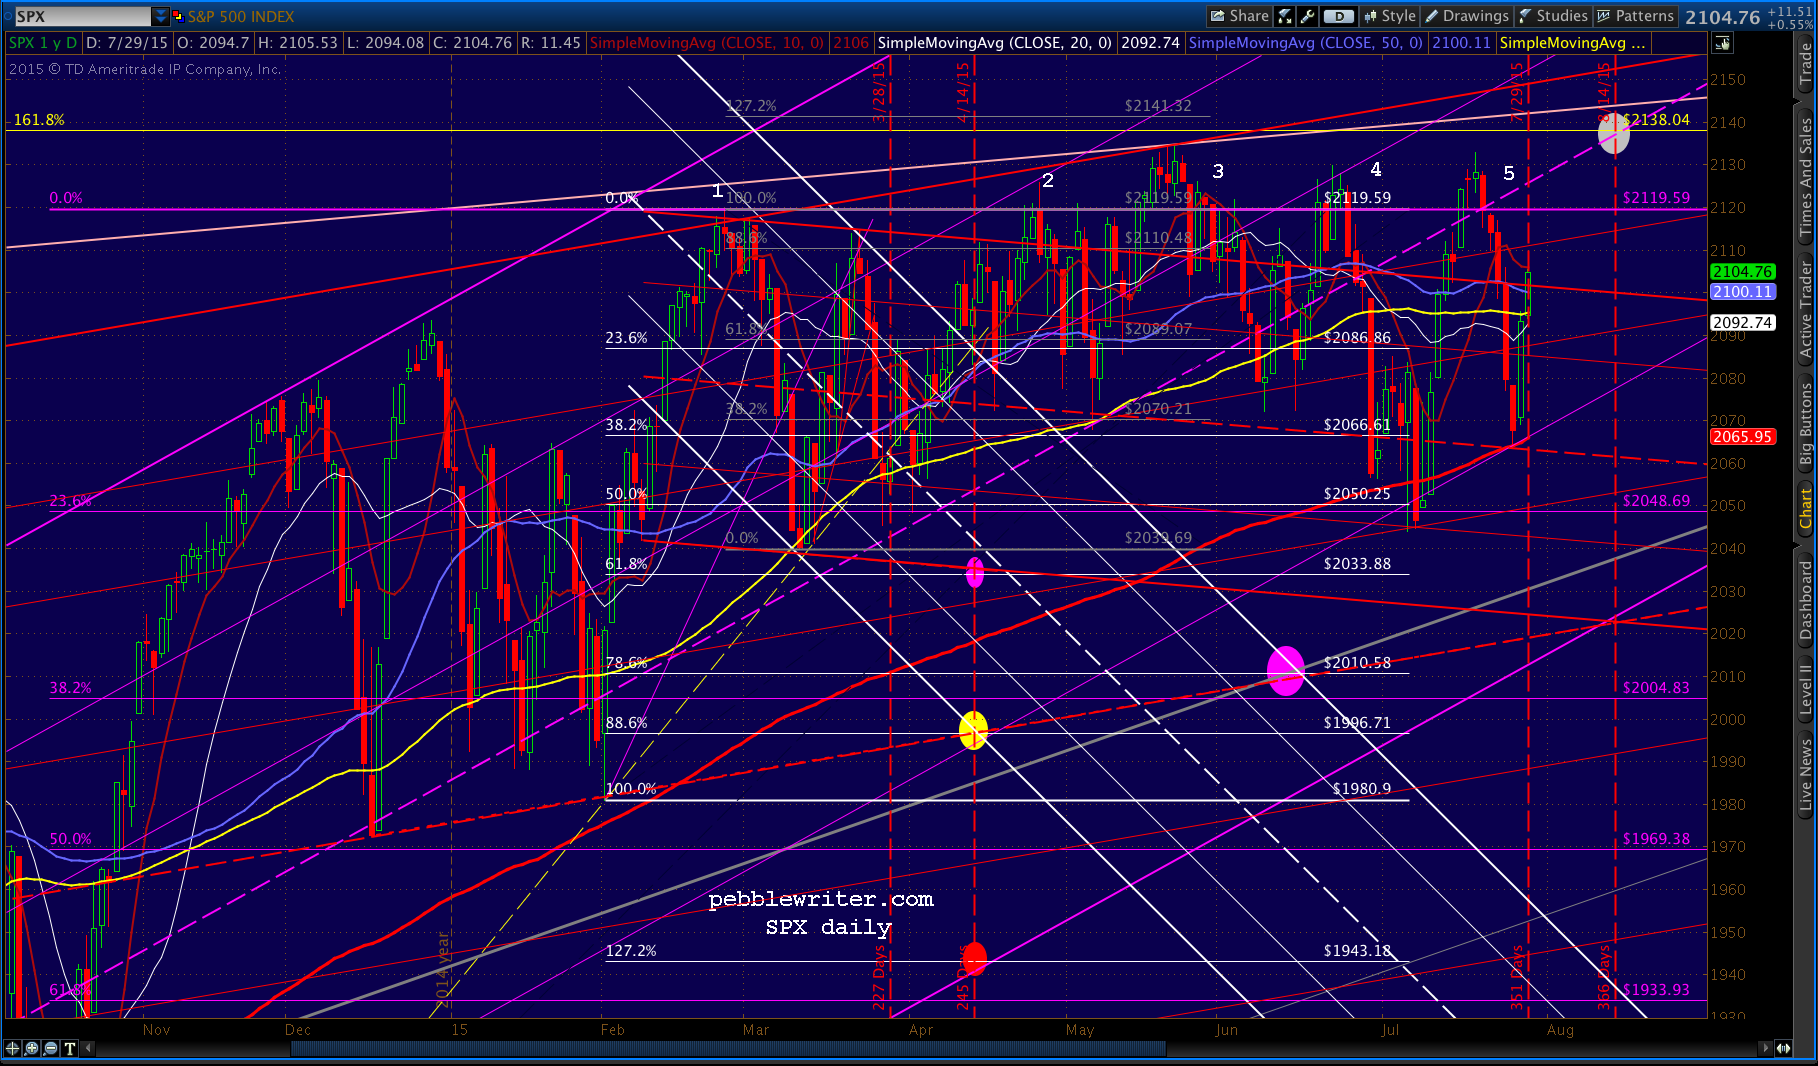 Instead, SPX put in a series of higher highs and higher lows that inched up on, but never quite reached, 2138. There were four more instances of breeches of the 2119.59 high. In fact, a total of 26 sessions topped that price level. They were all rejected — but, to consistently higher lows.
Finally, after the 3rd instance, SPX broke below the purple channel midline, only to go back up and make a new high two weeks later. The July lows tested the .236 channel line and SMA200, but 8 sessions later it was back making new highs! The latest dip to the SMA200 barely tagged it at all.
The whole pattern is even more ridiculous when we include last October’s lows. Of course, it’s impossible to get a decent retracement when Point A is constantly moving higher. But, consider that the biggest retracement off the Feb highs has been 23.6%!!!
 Either TPTB have given up all pretense regarding an unrigged market, or there is a huge downturn starting in the next two hours. Given CL and USDJPY’s action today, the latter is looking less and less likely.
Last, compare USDJPY’s action since the December highs to the previous period. It tried to coil — through early February. But SPX dropped like a rock. So, it’s instead been playing cat and mouse with the .618 Fib at 120.11, popping up above every time it needed a boost.
 This was our original forecast based on the analog:
 Clearly the SMA200 has taken the place of the SMA100 in terms of the July and August SPX events in 2014-2015. As far as USDJPY events, maybe we’ll get a SMA100 tag today, maybe we won’t. The Aug 13 tag — which is almost exactly 1 year since the second SMA200 tag in 2013 — looks quite likely.
If the analog holds, this latest dip to the SMA200 — or, wherever it might dip later today — is the worst of the downside for SPX. On Aug 13, it’ll test the “channel top” (or, more likely, 2138) and eventually bust the Butterfly Pattern on Oct 11.
To Sum it all Up:
The latest SMA200 tag might be as scary as it gets and might be enough to get the BOJ to expand QQE in mid-August. Or we could get another dip after the minutes today that provides a little more incentive.
If things get going to the downside, my favorite would be 2044 in order to threaten a H&S Pattern targeting 1950.
As far as the upside, note that the table above — while indicating a dip in USDJPY to tag the SMA200 on Aug 13 — corresponded with a rise in SPX at the same time. Day 366 represented a test of a channel top in 2013. I have to imagine the equivalent today would be a test of the 1.618 at 2138.
Remember the IH&S we discussed earlier in the month — seen below in purple. It’s still in play unless we get a dip below the head at 2044. The neckline looks like it could easily be near 2138 in mid-August.
 There are a number of possible catalysts that could drive SPX 35 points higher: FOMC minutes, CL, bond sell-off, etc. The analog would then suggest a mild backing off until the USDJPY SMA200 tag occurs, followed by a thrust through 2138 that could come as late as October 11.
The key today is to watch USDJPY and CL. If they start taking off higher, odds are SPX won’t be far behind.
UPDATE: 10:35 AM
Speaking of which — crude inventories just came in at -4.203M bbl versus expectations of a 850K rise and last week’s 2.5M gain. We know it’s true because it’s government information.
Guess what happened to CL? It goes without saying that it goosed stocks as well.
UPDATE: 12:00 PM

More after the minutes…
Here’s a quick chart of immediate upside and downside targets:
 UPDATE: 2:10 PM
 USDJPY has been all over the map, but is looking somewhat bearish at this point…
 …as is CL.
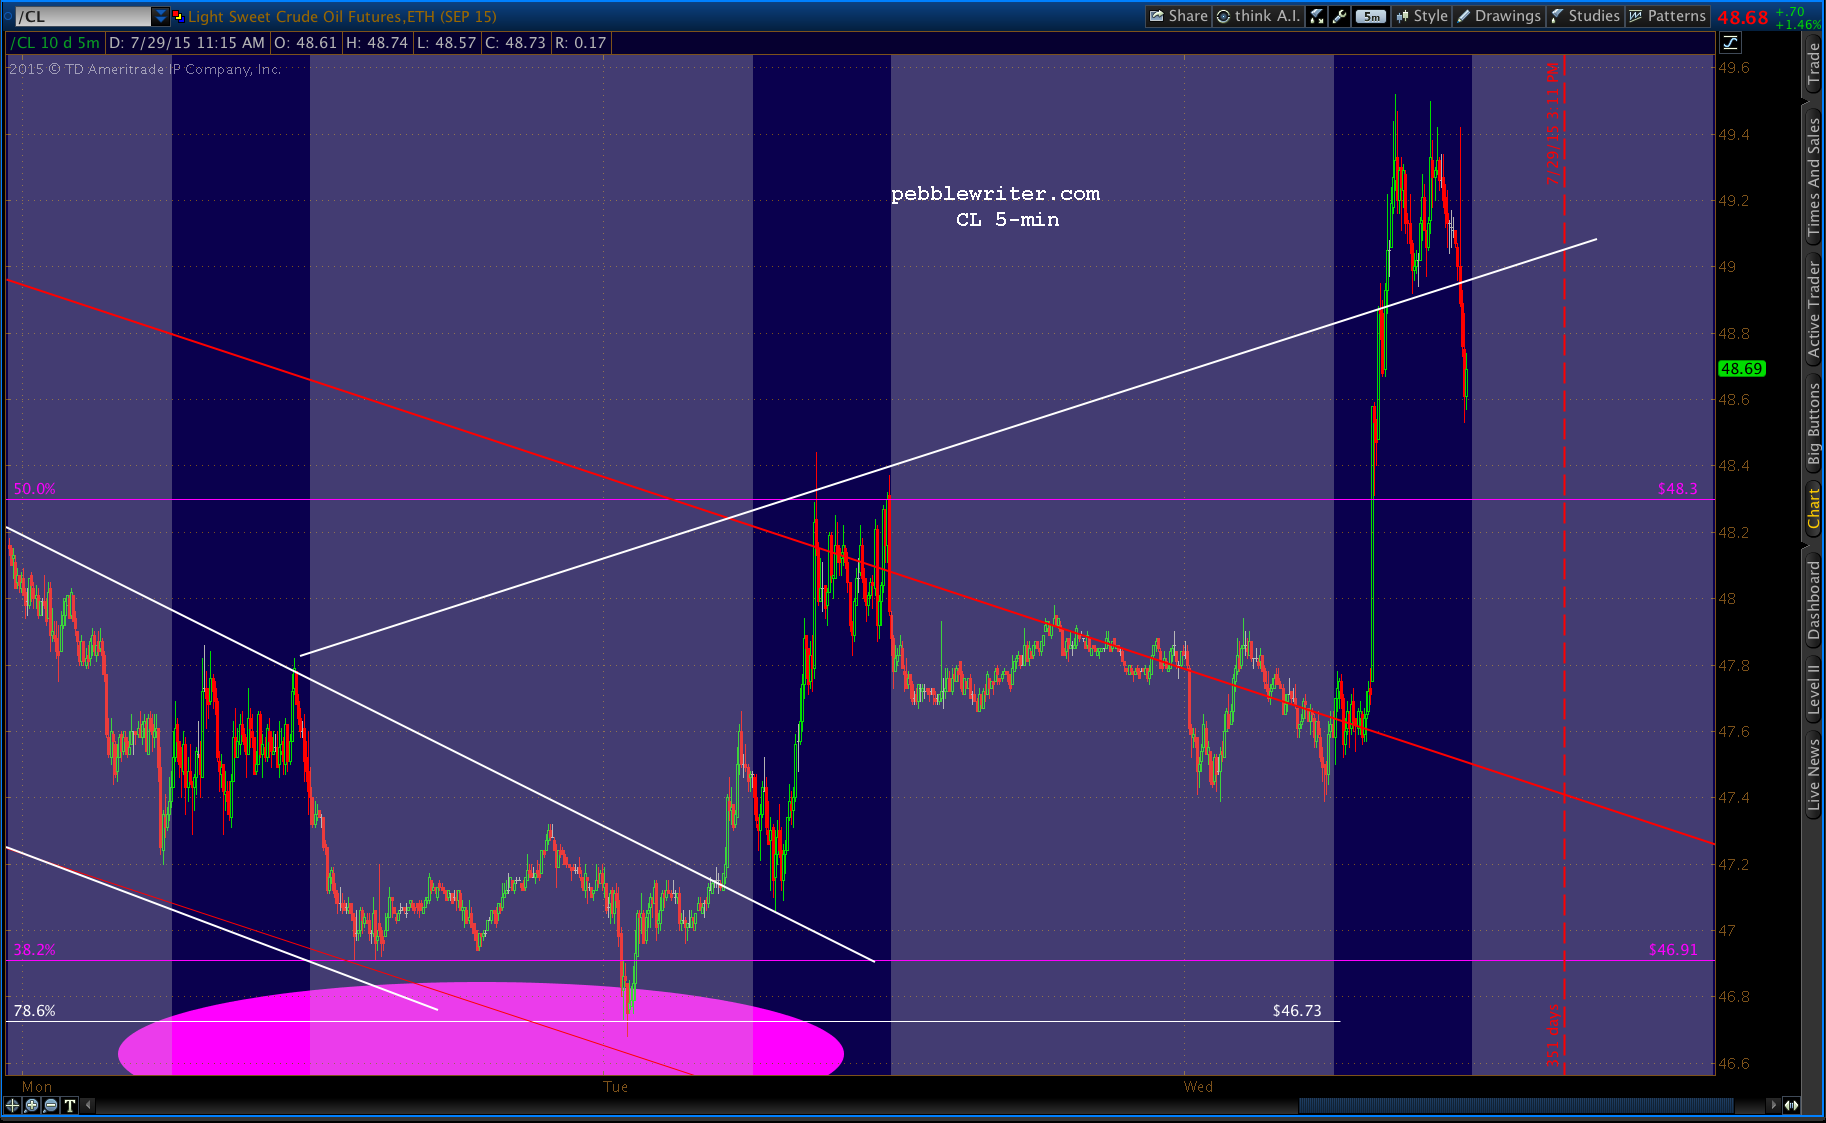 The key will be whether they hold support (48.44 for CL, 123.73 for USDJPY.) They should, at least through the close, which will would to stable/higher prices for the rest of the session. I neglected earlier to mention 2112, the purple channel midline. It’s a very appealing target.
UPDATE: 3:50 PM
 USDJPY are both showing more upside, but they’ll probably reset after stocks close. VIX and NKD show more downside.
Lots of economic data is due out in the morning, so headline risk is high.

Comments
2 responses to “Incredulity”
I’ve added some detail summing up the entire stance on this morning’s post. It’s about as specific as I can get without knowing what the FOMC will say at 2pm.
Would you please be specific in the stance now? Have we abandoned the H&S pattern and are now forecasting a bullish run up into the middle of August? Thank you.