

This analog has been really terrific so far, already forecasting several major reversals over the past several months. The best is yet to come, with the next key date being July 29.
Rather than have all the charts that illustrate what has happened in the base periods (and, what they portend for the future) spread out in different posts, I’ve gathered them all together here.
Any significant updates to the analog and its forecast will also be posted here. Think of it as a blog within the blog. Enjoy!
continued for members…
ANALOG CHARTS: 2011-2012

SPX had just plummeted almost 300 points in a very short period of time after completing a Gartley Pattern (11 points short) in May 2011. Our analog, which predicted it perfectly, was broken (point 0) by the Oct 27 rally — the same day that the BOJ expanded QE.
USDJPY was still coping with the aftermath of Fukushima. The stock market’s plunge in late July/early August corresponded with a new low in USDJPY and its subsequent inability to regain lost ground. Finally, the BOJ swung into action on Oct 27 — busting our analog in the process.
Each subsequent data point noted on the chart corresponded with an important goal for SPX — either catching a falling knife or providing a boost up through overhead resistance.

A quick summary of the key moves by USDJPY that link directly to important threats/opportunities in SPX:
0. SPX analog busted when BOJ expands QE on Oct 27, 2011
1. small Bat Pattern (purple) busted when USDJPY tops SMA200
2. previous high and actual .786 busted
3. USDJPY and SPX SMA200s breeched, fixed
4. Big Bat Pattern completes – one day after QE3 launched
5. SPX tests yellow TL, USDJPY suddenly pops above SMA200
6. USDJPY breaks out to stop SPX from falling
And, by “link directly” what I really mean is manipulations in USDJPY in order to effect (or prevent) a specific action in SPX.
ANALOG CHARTS: 2013-2014
After completing a Bat Pattern and reversing at the .886, SPX dropped through the SMA200, closing below it for about a week before USDJPY finally broke out of the doldrums. As a result, the total loss was only 131 points (about 8.9%.)
As soon as the Day 23 low was in, SPX took off on a narrow, steep acceleration channel (in purple, below) that traversed the gray channel while capitalizing on the USDJPY SMAs for firepower along the way.
It ran into trouble, however, in early June. The purple channel broke down, leaving SPX to rely on the gray channel, its own SMA100 and (most importantly) USDJPY for a series of higher highs and higher lows that ultimately surpassed the .886 at 1472 and the 2007 high at 1576.
Might it have been a coincidence that the BOJ expanded its QQE only 3 days after SPX was rebuffed at 1573.66, only 2.43 points shy of the 2007 highs? Not on your life.
 The most important moves by USDJPY that supported SPX at key moments are detailed in the charts themselves. But, pay particular attention to the way that USDJPY spent many months going sideways while waiting for its SMA100 and SMA200 to catch up and lend critical support.
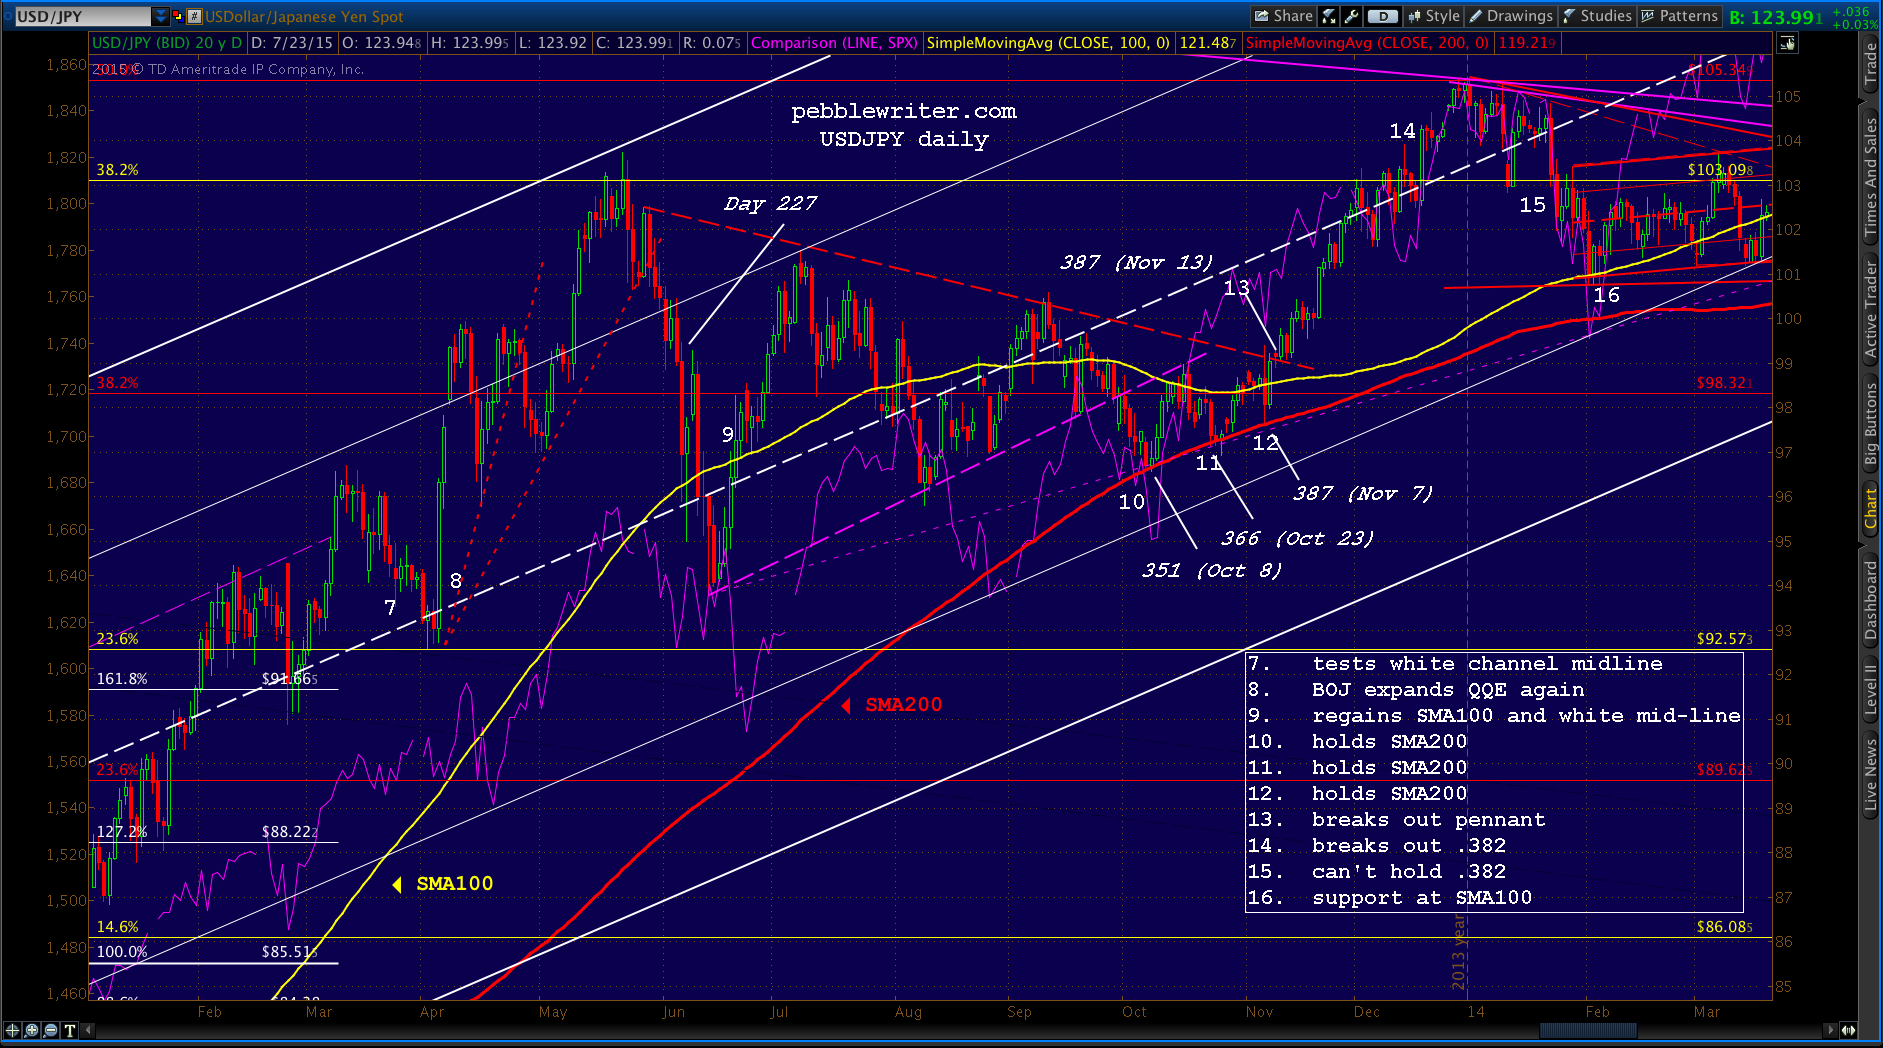 Every single time SPX needed help getting past overhead resistance or reversing a plunge, USDJPY would promptly reverse higher or surpass a key resistance level of its own.
Note also that USDJPY’s three main SMA200 tags came at 351, 366 and 387 days after Day 0 back on Oct 22. Of the three measures, the Day 366 tag on Oct 23 seems the most important.
SPX broke out of a rising wedge (very bullish) and above the gray channel midline (also bullish) only 64 points away from a critical point of overhead resistance. It was a great momentum boost when it was most needed and left SPX in great shape for the assault.
It’s also important to note that in addition to propping up SPX, the BOJ’s QQE expansion quite literally kept the Nikkei on the rise. In the midst of a spectacular run following 2012’s QQE program, NKD had just fallen out an acceleration channel (below, in purple.)
 It had further dropped below the .500 Fib retracement of its 62% crash from 18,365 in 2007 to 6,990. Losing either support could do some real damage. Fortunately, the QQE expansion came on the very day it was needed in order to prevent either from occurring — another one of those amazing coincidences.
ANALOG CHARTS: 2014-2015
Updated: Aug 6:
I’ve been studying the likelihood of USDJPY reaching the SMA200 — which is way down at 120.05. The SMA200 will likely reach the key .618 at 120.11 tomorrow, but it’s still 3.7% below today’s 4:00 px.
It could drop 3.7% in a week (though next week it’ll be closer to 120.60, which would be 3.3%.) It did so in early October, just before the BOJ expanded QQE on Oct 27. It did so again in early December, beginning the day after it reached the .618 at 120.11.
If there’s one thing which distinguishes this instance of the analog from the previous, it’s that there has been no triangle. Instead, USDJPY has formed the really shitty looking red channel and has relied very heavily on the .618 Fib at 120.11.
This year’s pattern, then, is more a replay of 2013 than the years preceeding or following it. Why? It has been absolutely necessary in order to keep SPX within striking distance of 2138.
As I pointed out Tuesday in The Good, The Bad and The Ugly, the analog is all about getting SPX up over 2138. It’s major resistance. TPTB are pulling out all the stops, and obviously feel they can’t take any chances.
So, if they are using the SPX SMA200 instead of the USDJPY SMA200 to pull it off, who am I to quibble? It’s their plan, not mine. They’re just doing what they have to in order to get SPX — not USDJPY — through that target.
Will they be able to? Probably. Again, that’s what Tuesday’s post was about. They’ll break whatever rules, chart patterns, harmonics, laws they have to in order to get what they want. But, I also believe there are some things they can’t pull off.
We saw this in 2011, when S&P’s US downgrade was an extremely timely catalyst to that analog playing out (or was S&P part of a secret plot?)
All I know is CL is absolutely tanking. And, I can’t think of a good reason for TPTB to let it tank unless a cheaper yen is in the works. Abe/Kuroda might very well have made a deal with the US: you crash oil prices and we’ll keep the carry trade alive.
It’s the central thesis we talked about months ago in Those Wacky Central Bankers. If you’ve forgotten, I suggest reading it again. IMO, it makes as much or even more sense today as it did then.
 A reader asks how SPX would reach 2138 at the same time that USDJPY was diving. It seems unlikely that they would happen at the same time. In looking back at the 2013 incidence referenced above, the test was of the top of a channel that it would eventually break out of (when USDJPY broke out.)
 USDJPY’s ability to drive SPX higher has through a combination of finding support and, more importantly, breaking out through resistance. Though I have no empirical evidence whatsoever, I consider breaking out a much more powerful statement.