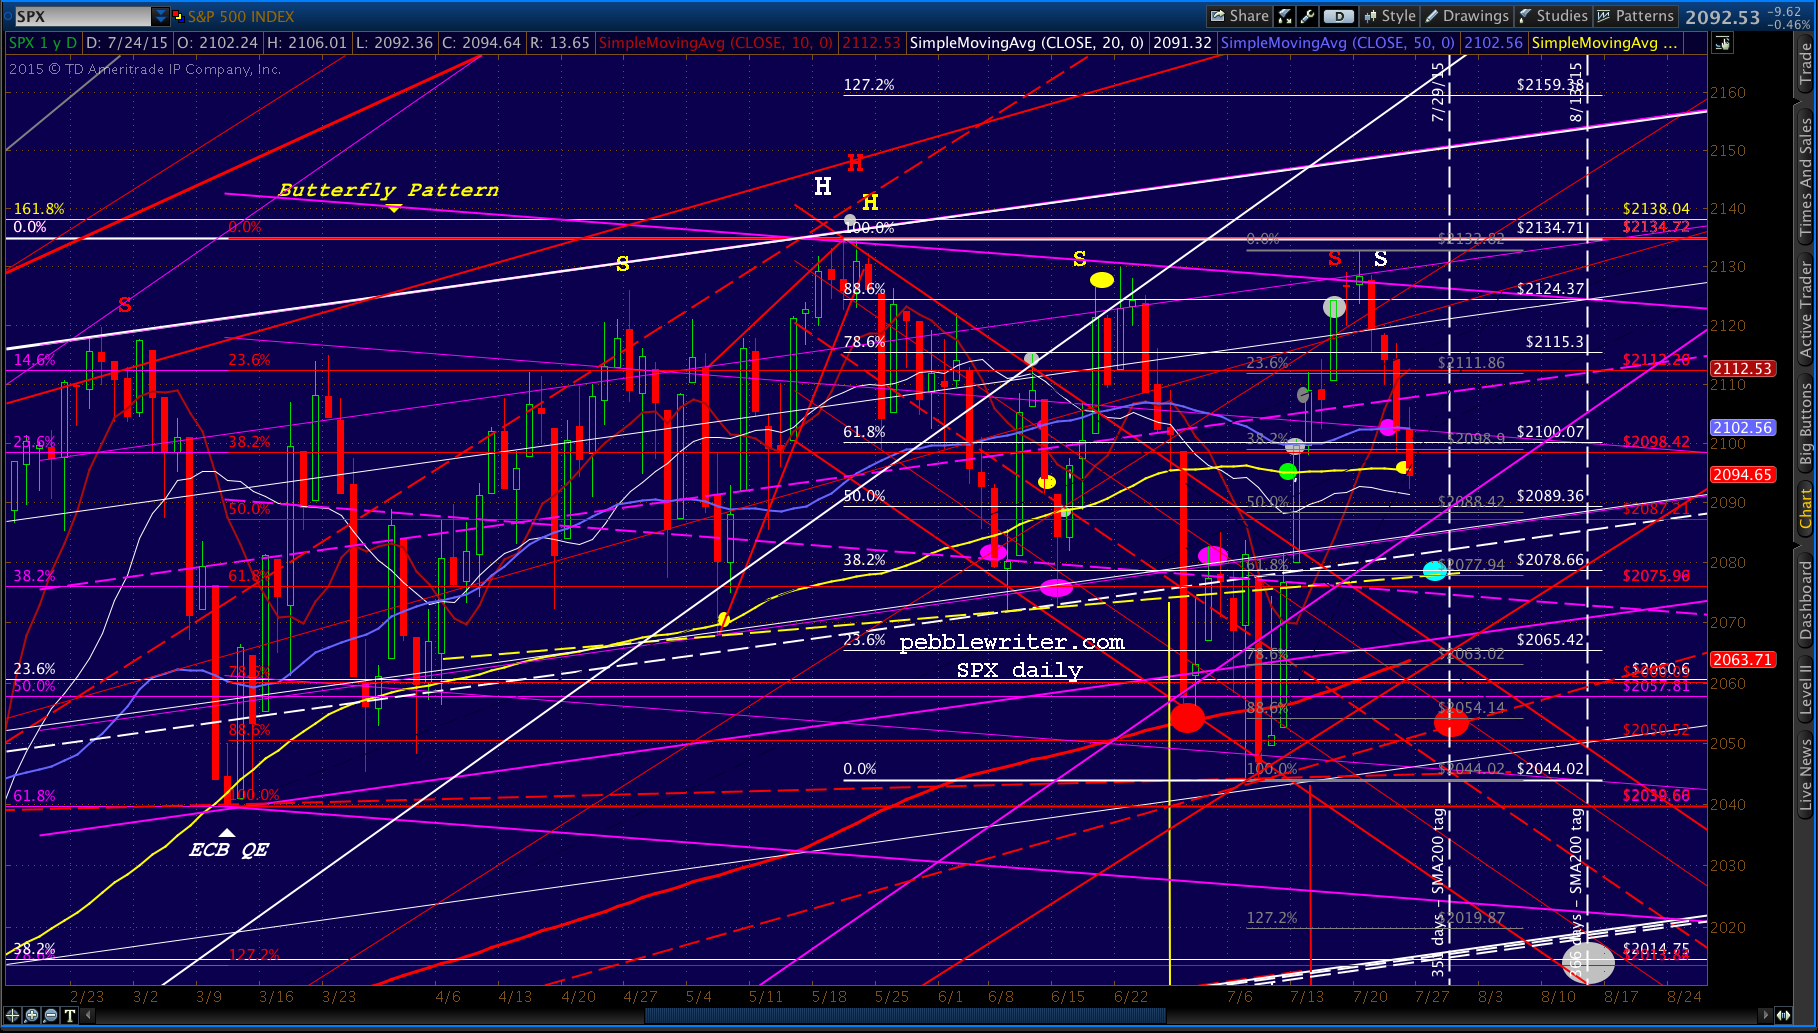
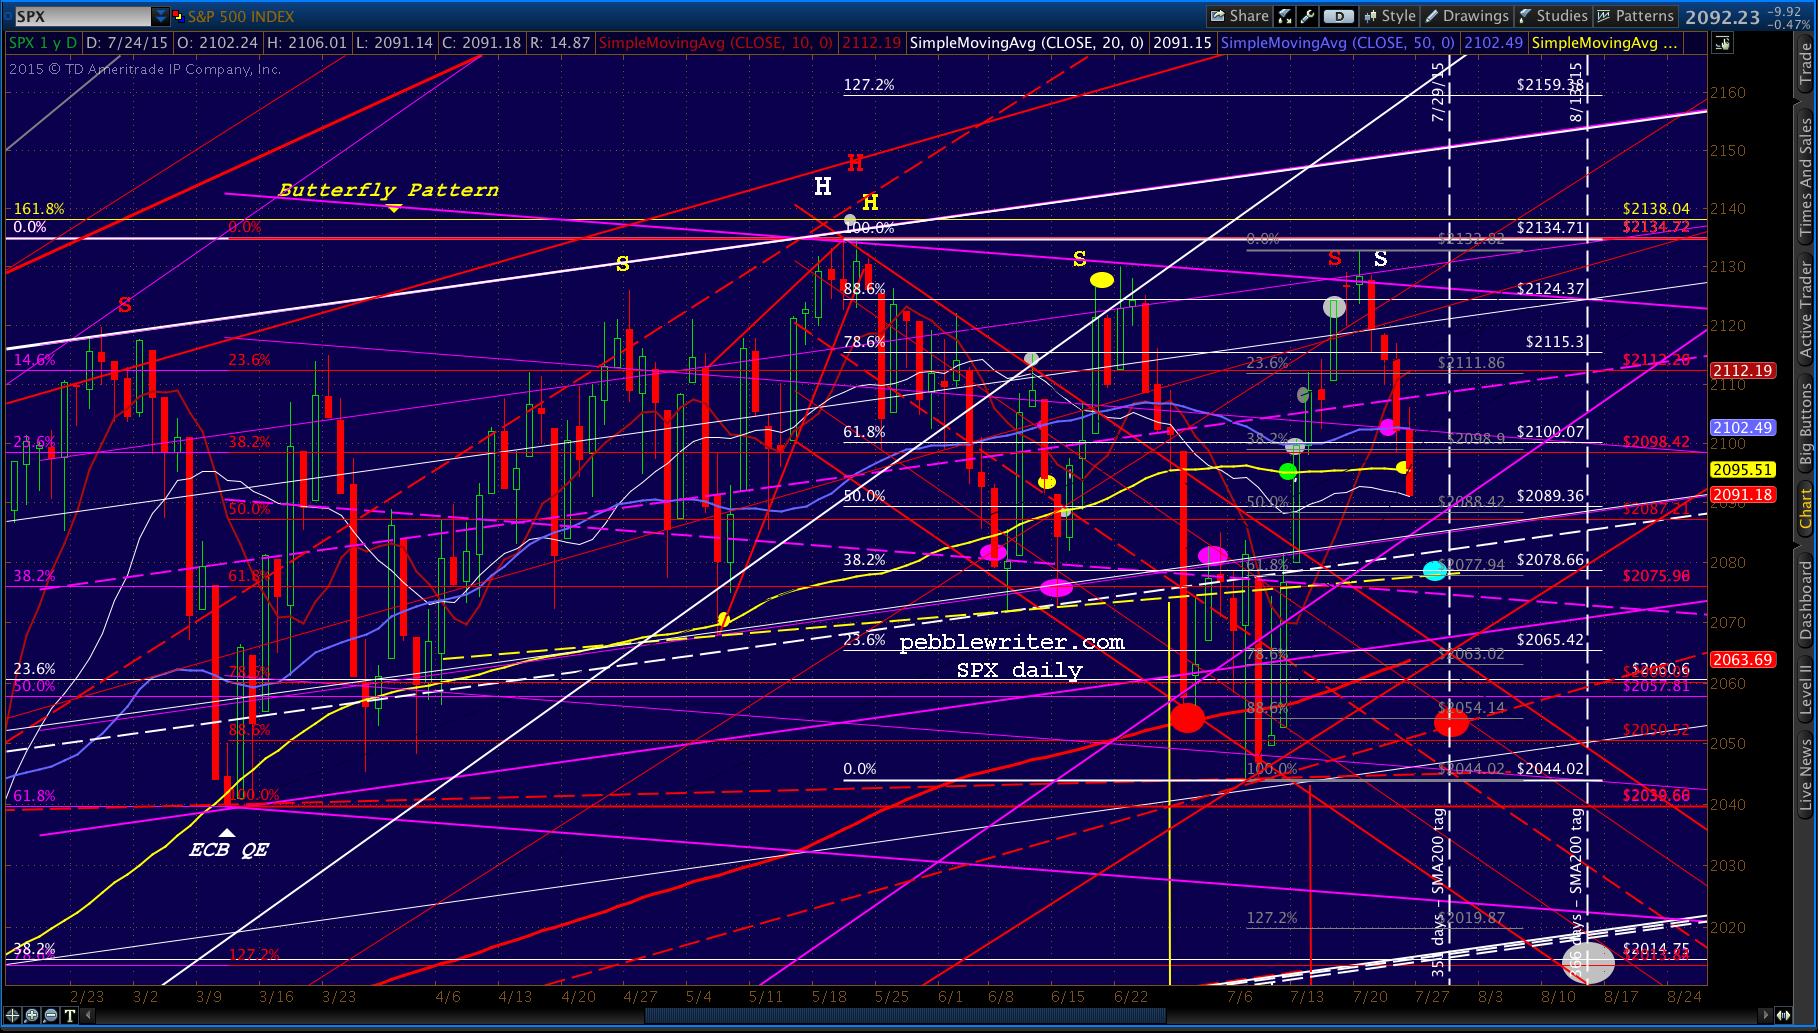
SPX came within a few points of our next downside target yesterday. I suspect we’ll nail it in the opening hour before getting a significant bounce. All of our targets from last Monday remain unchanged.
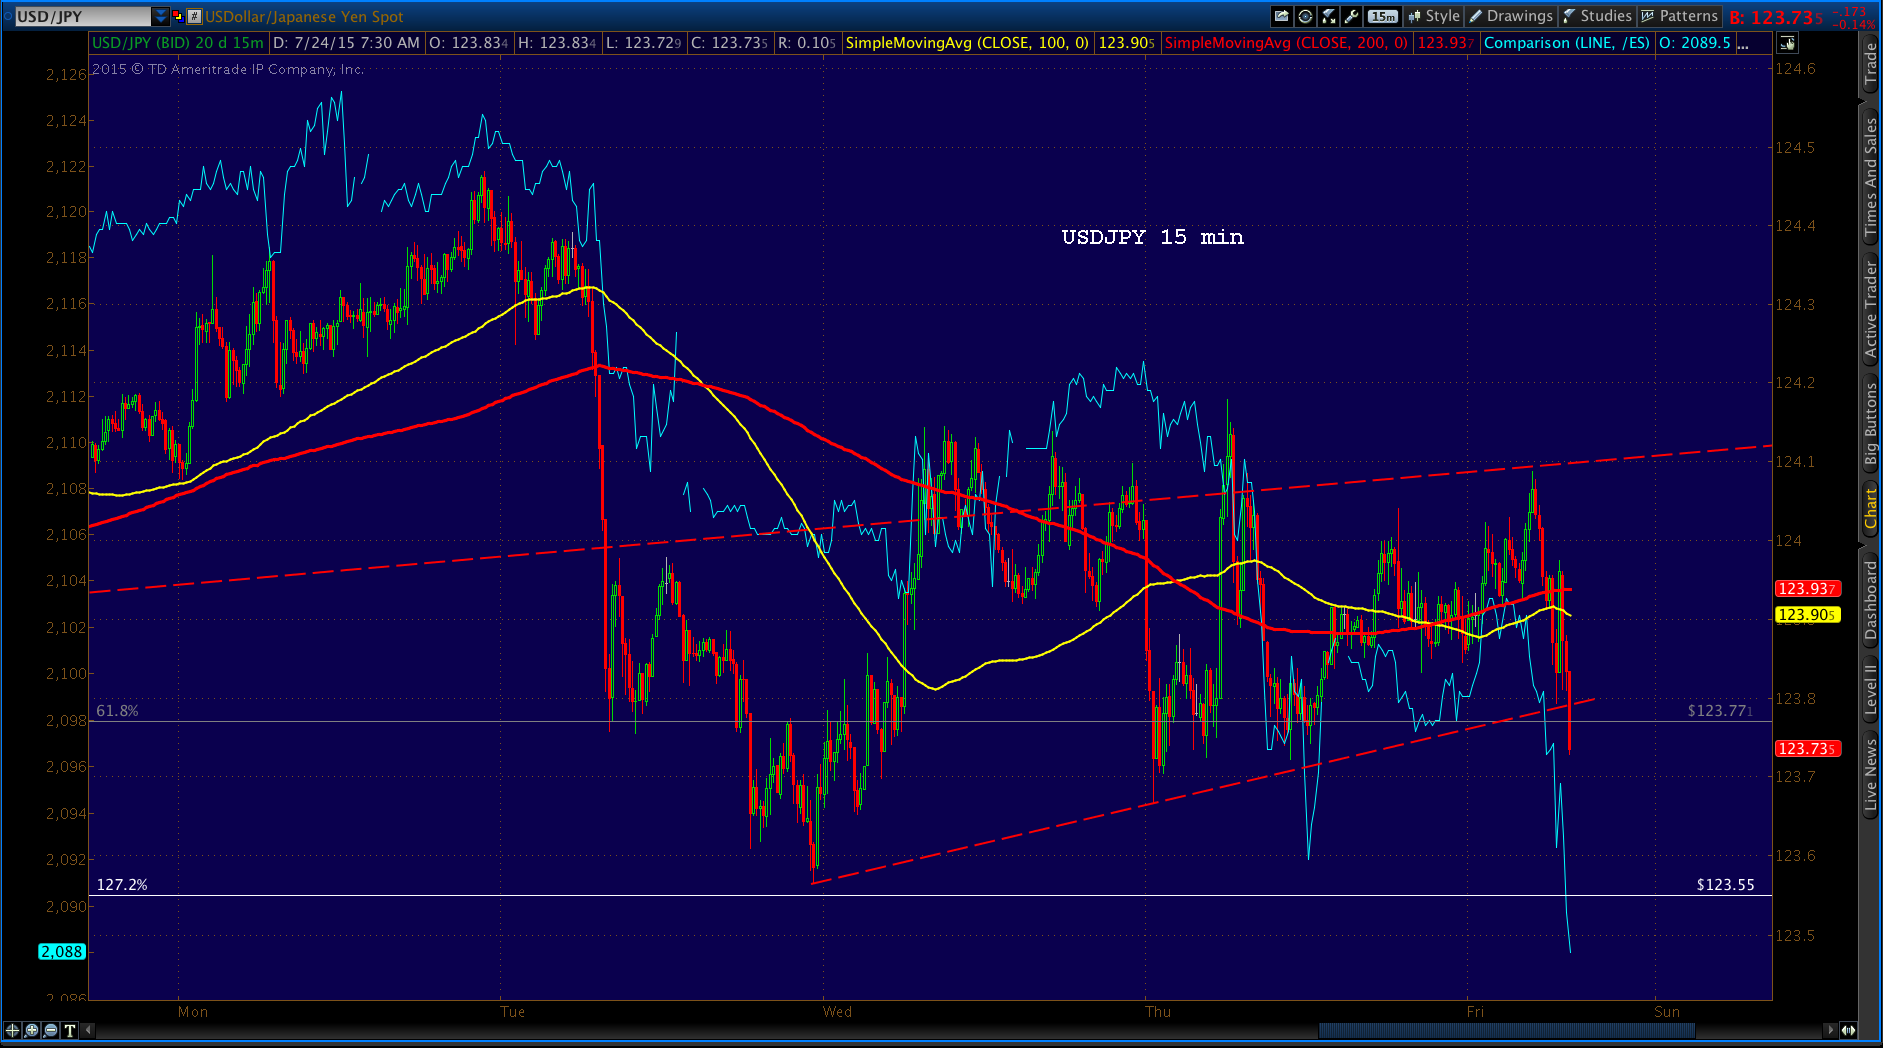
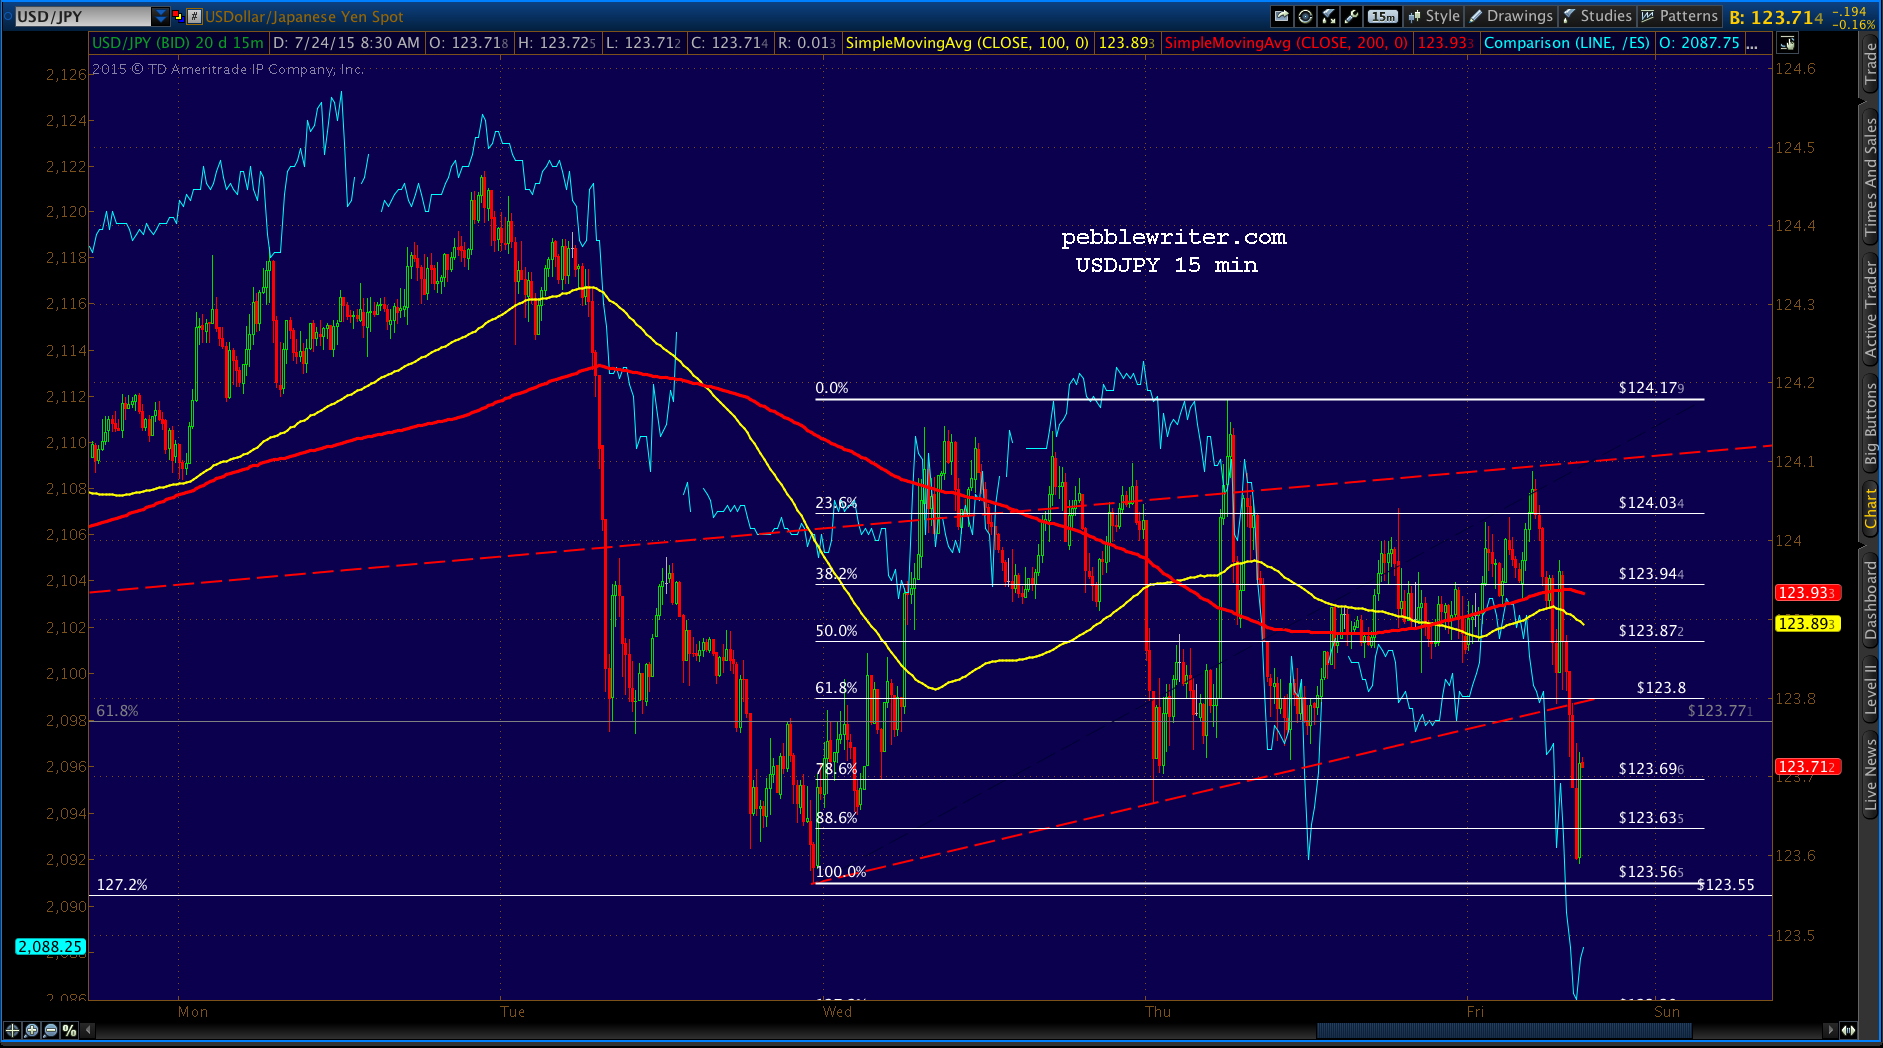
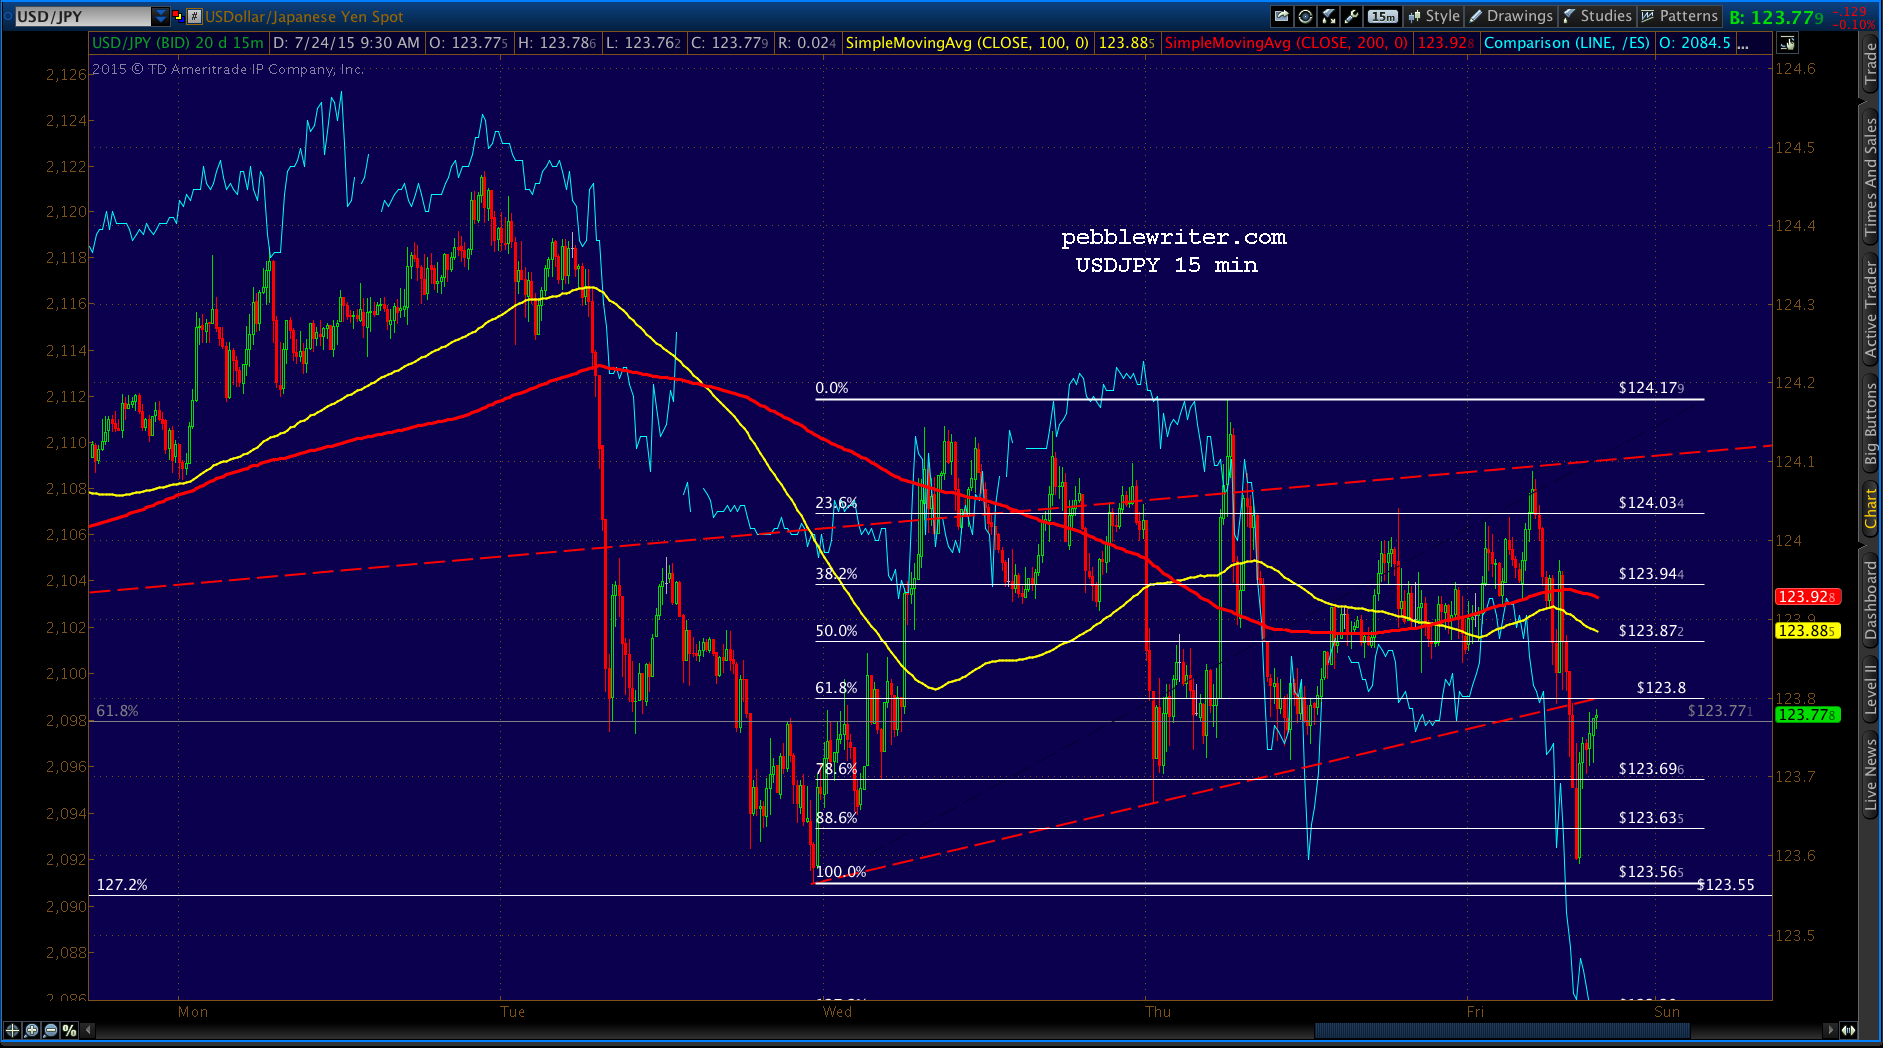
Going around the horn, USDJPY won’t hold off much longer…
 …CL continues to weaken…
 …and, EURUSD is pausing in a backtest before the next leg down.
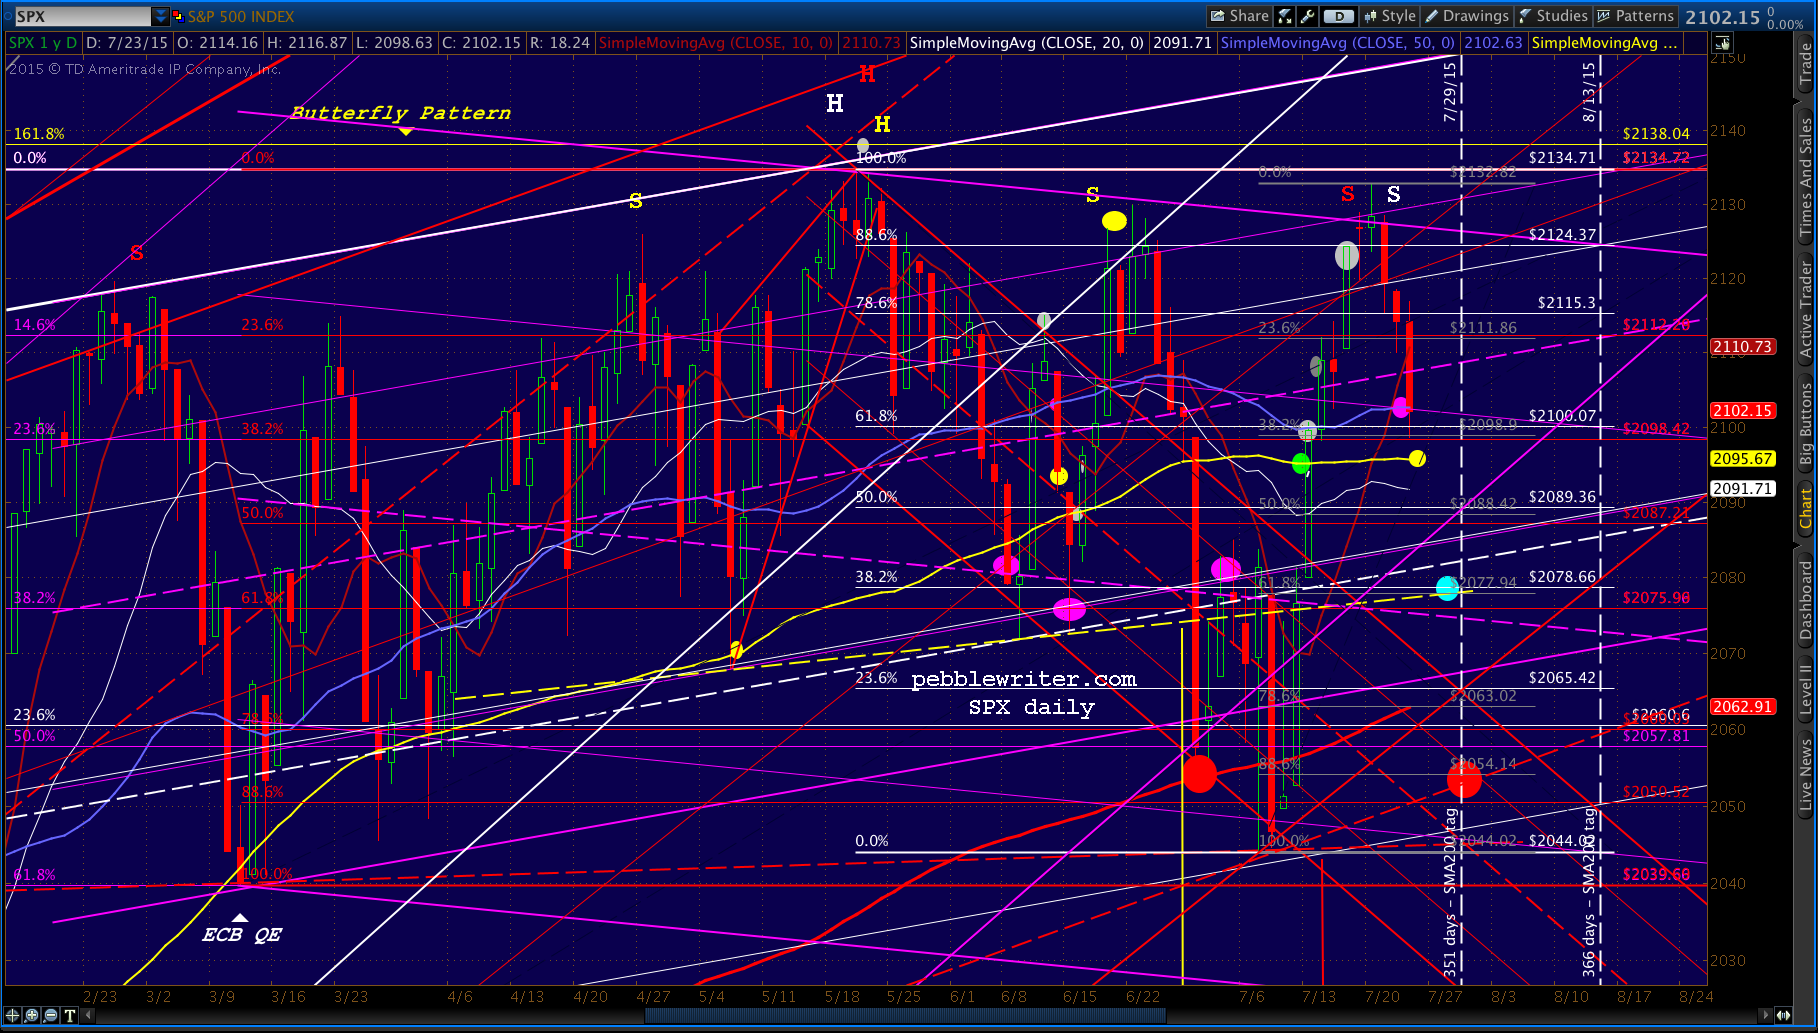
 A reminder of our downside targets:
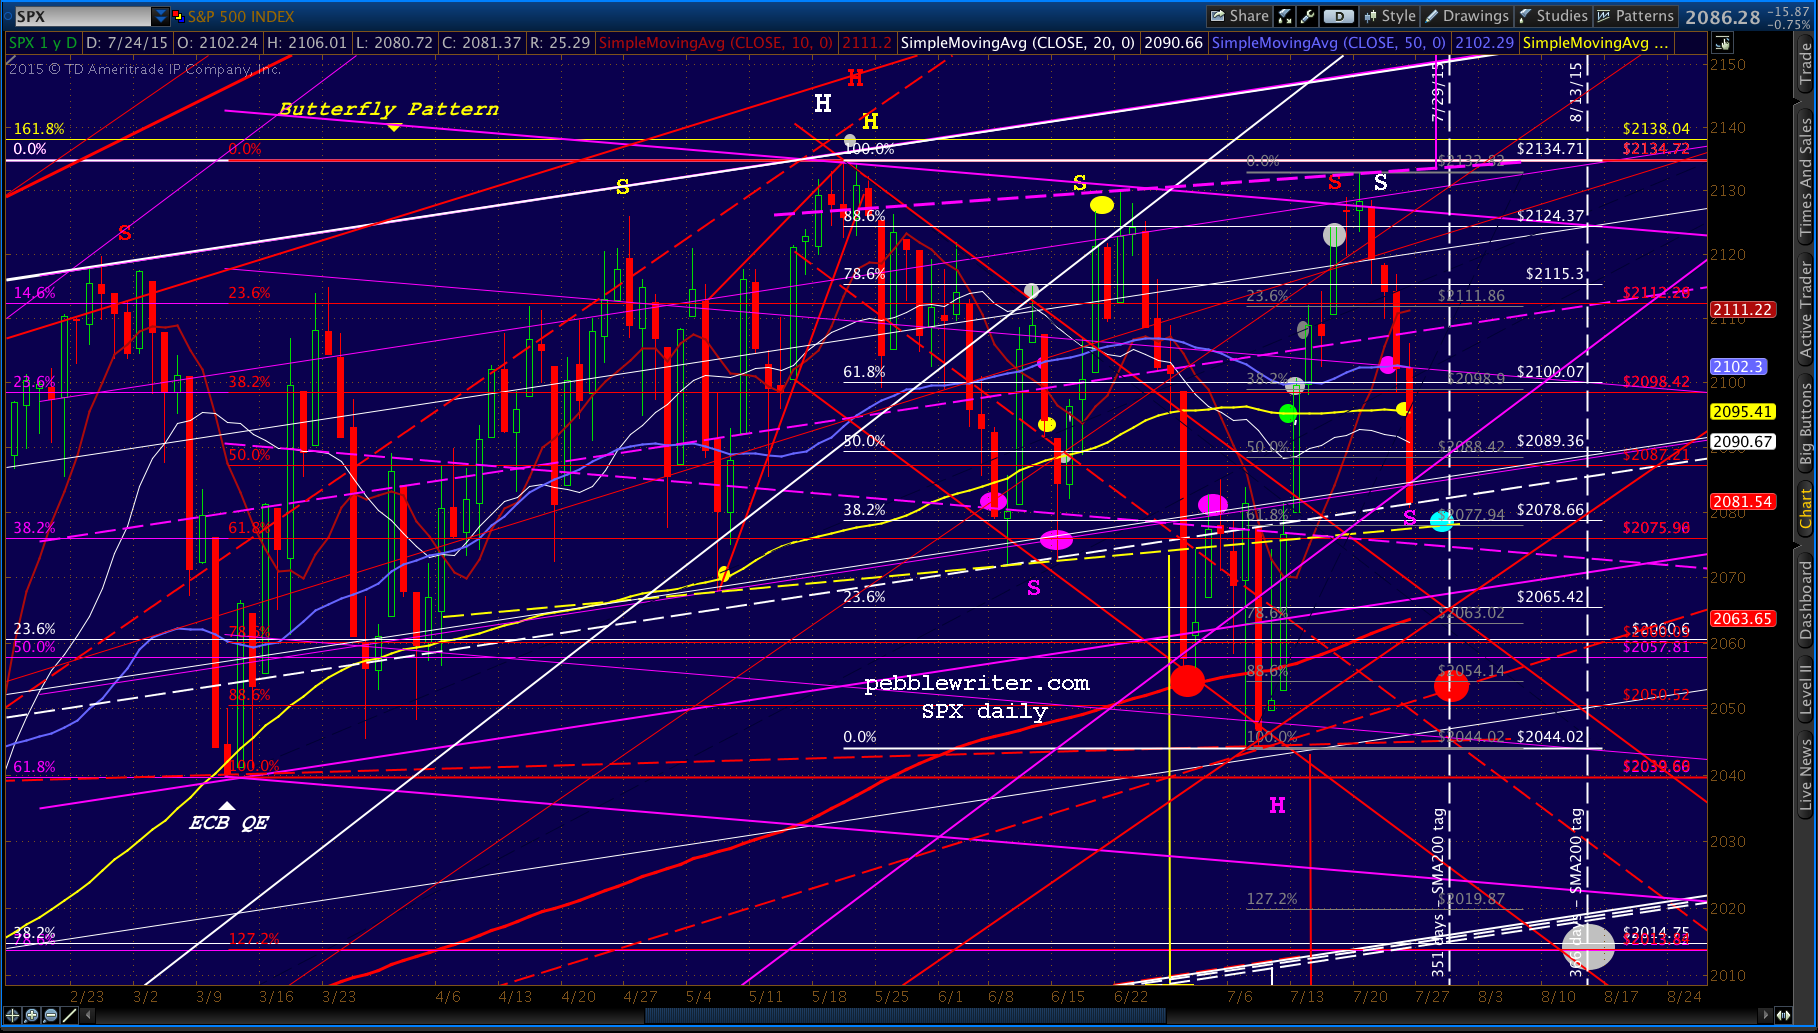
continued for members…The SMA100 (2095.59) remains the next target, with multiple ones to come — but probably next week. If the SMA100 doesn’t hold today, look for 2087, 2078.66, and 2065 to come into play. Initial bounce target for the SMA100 is the SMA50 at 2102.66.
The yellow neckline has been busted in both directions several times. So, I remain more interested in the red H&S Pattern that would complete at 2044. I think it would get central bankers concerned, while the white pattern at 2015 would get them downright panicked.
 UPDATE: 10:37 AM
SPX just tagged our SMA100 target. 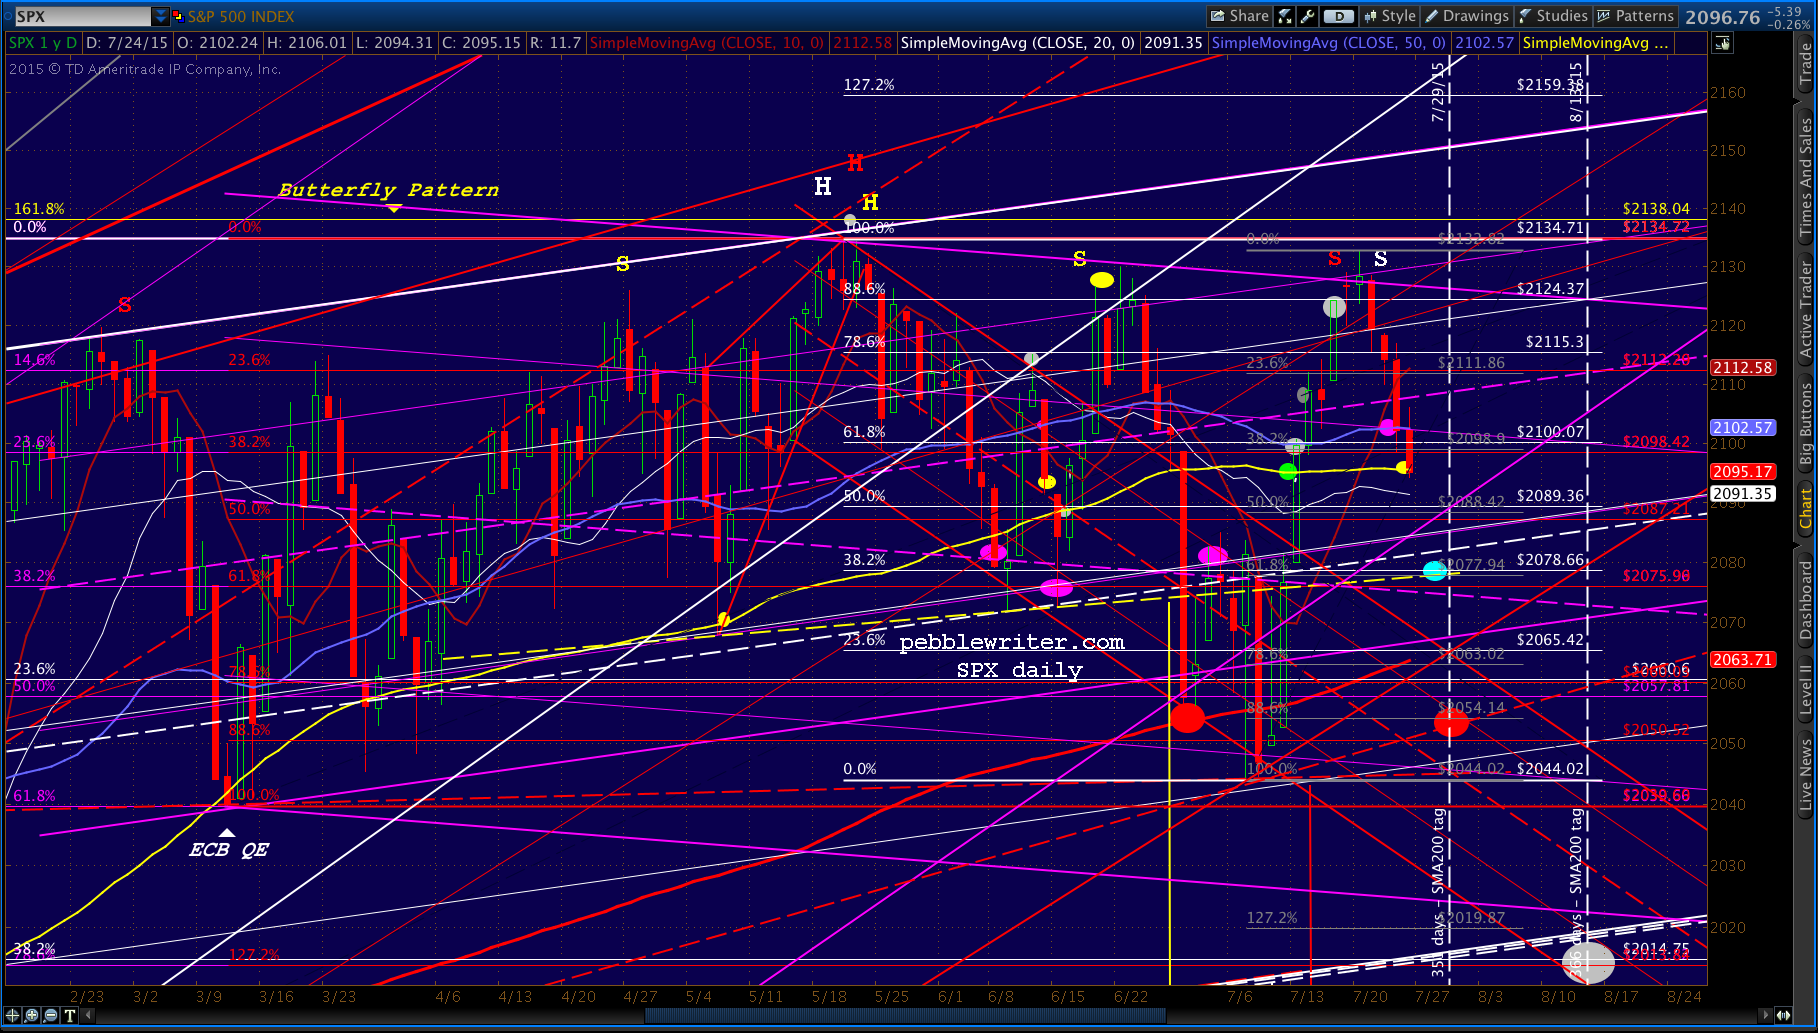 I’d quickly pull the plug on the suggested short, but this is happening over in USDJPY:
UPDATE: 11:27 AM
We’re getting a bounce into the european close, as seen on the USDJPY chart. SPX hasn’t even reached the SMA20 (2091.22), so I’d let USDJPY be my guide on that SPX stop. In other words, unless USDJPY retakes the TL I’d view this as a backtest of the SMA100.
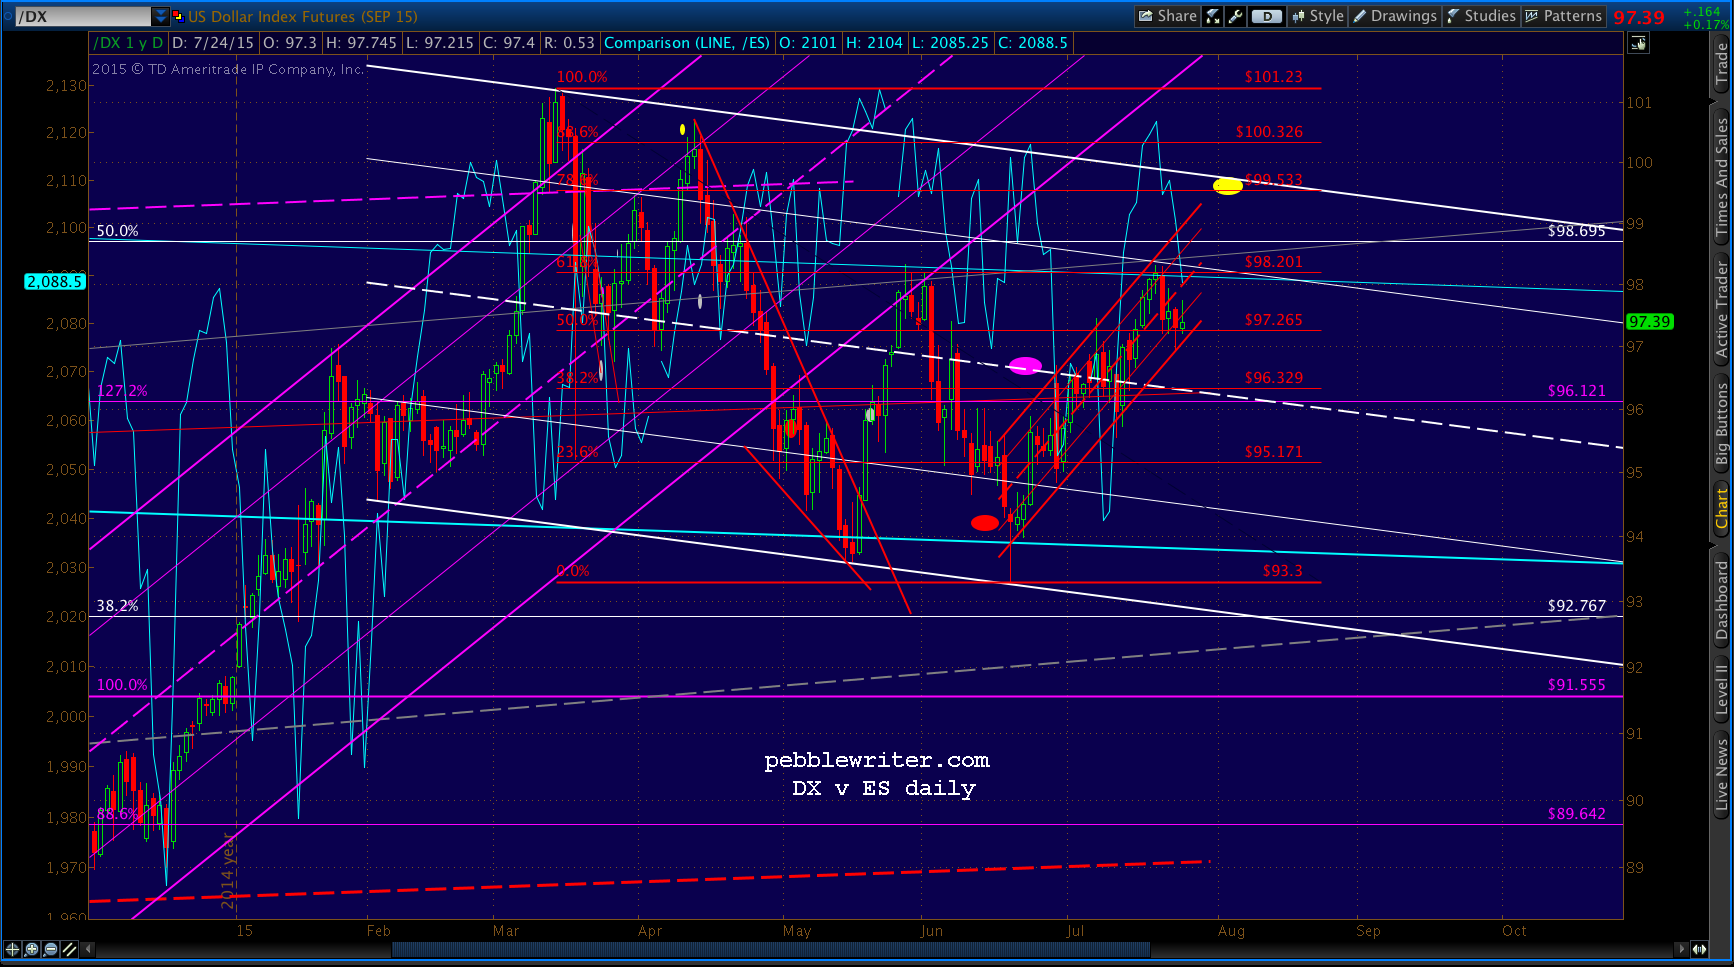
 A quick look at the dollar…
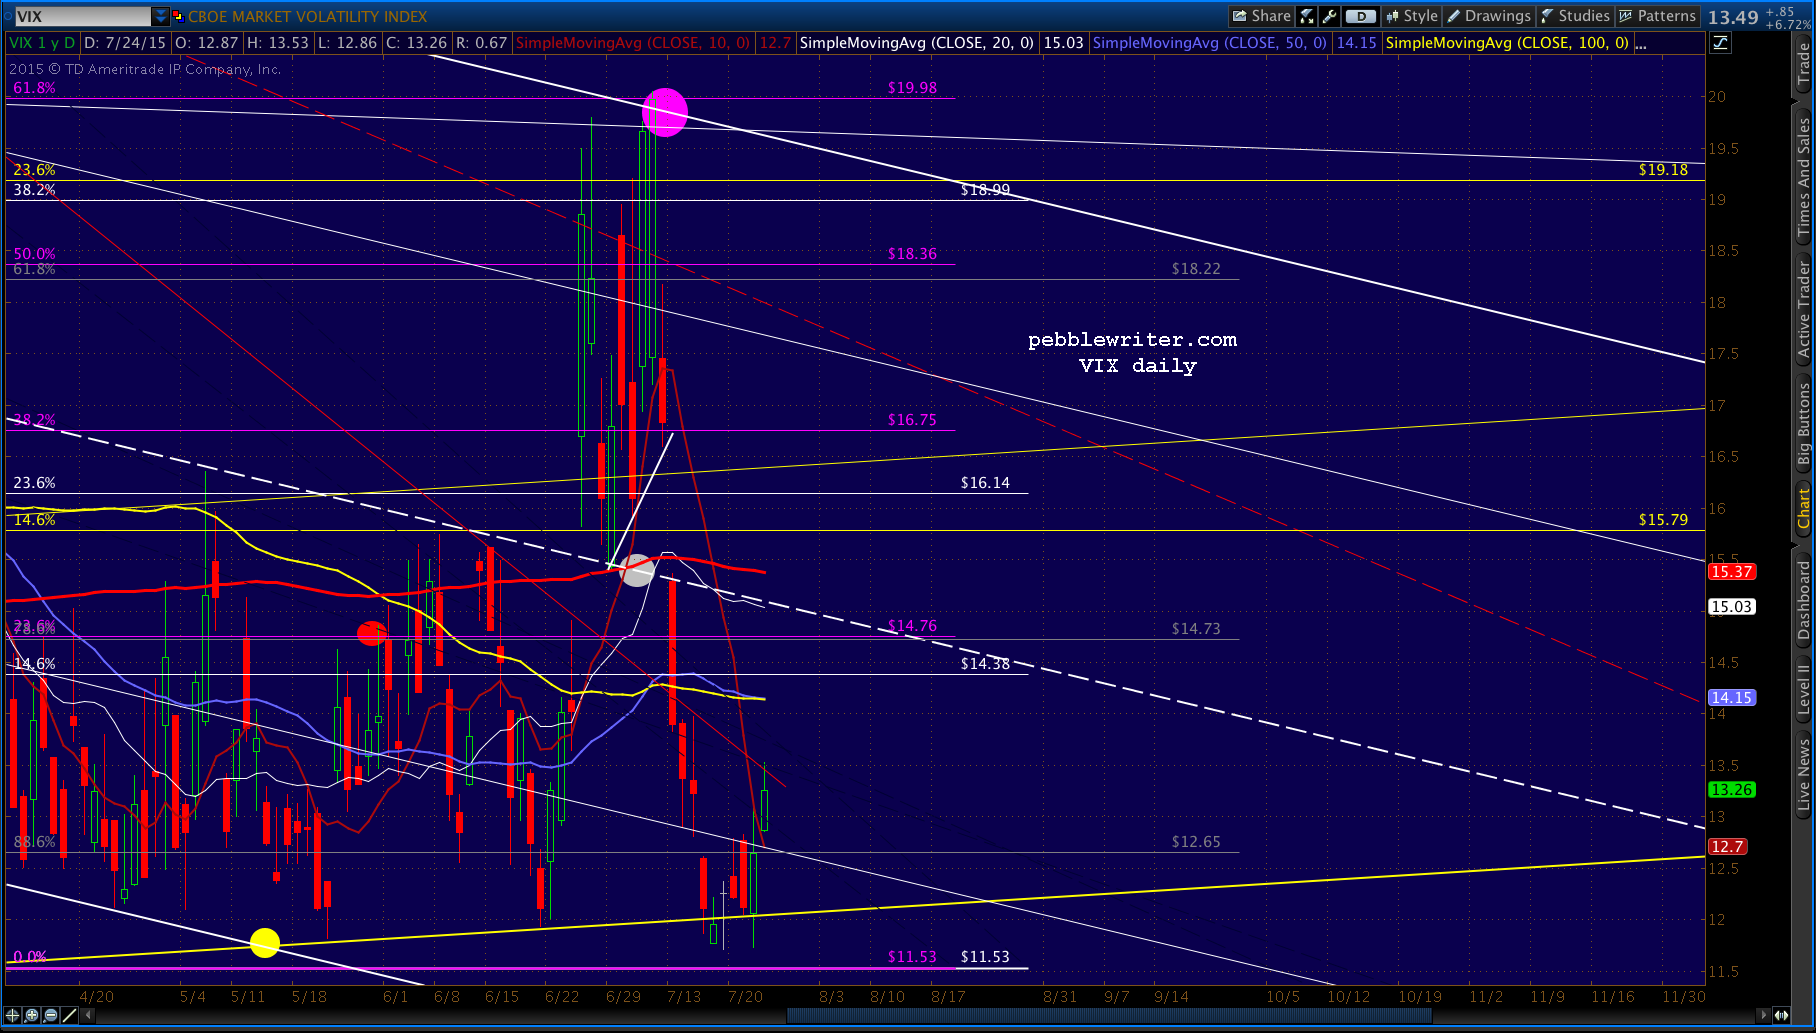
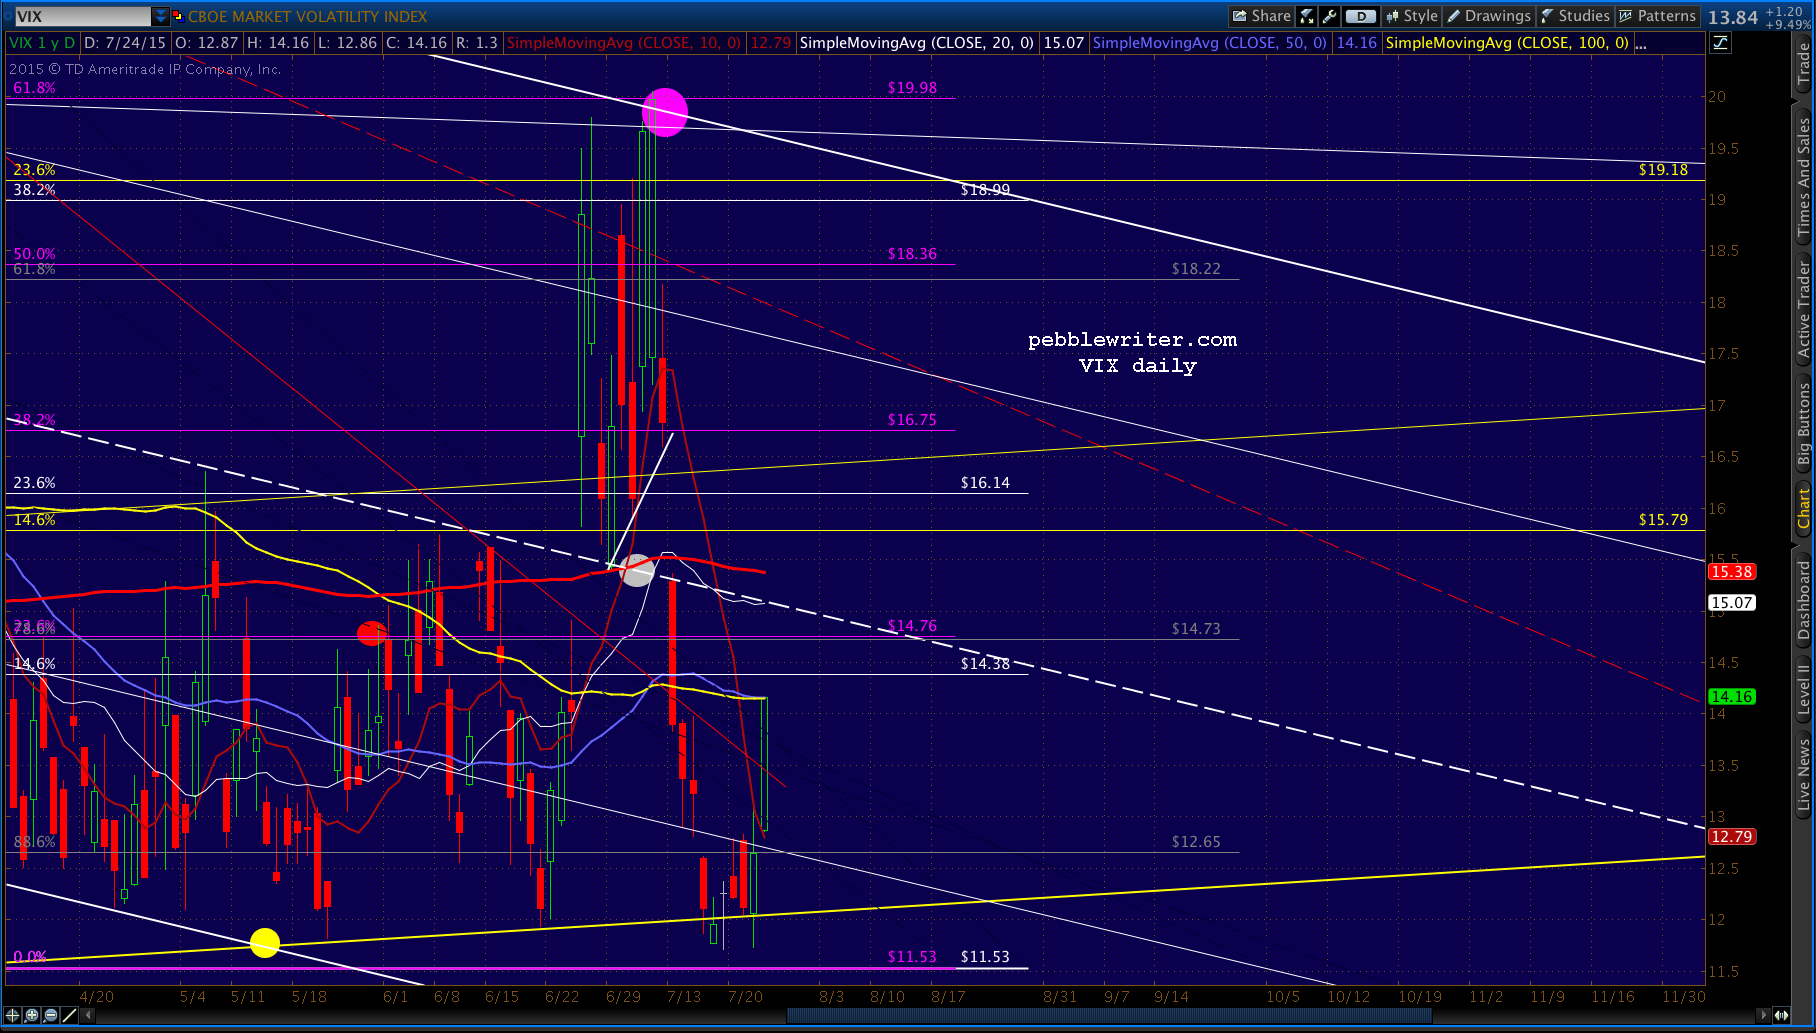
 …and VIX, which is back above the yellow channel bottom…but, ran into the TL from last October for the eleventy billionth time.
 UPDATE: 12:26 PM
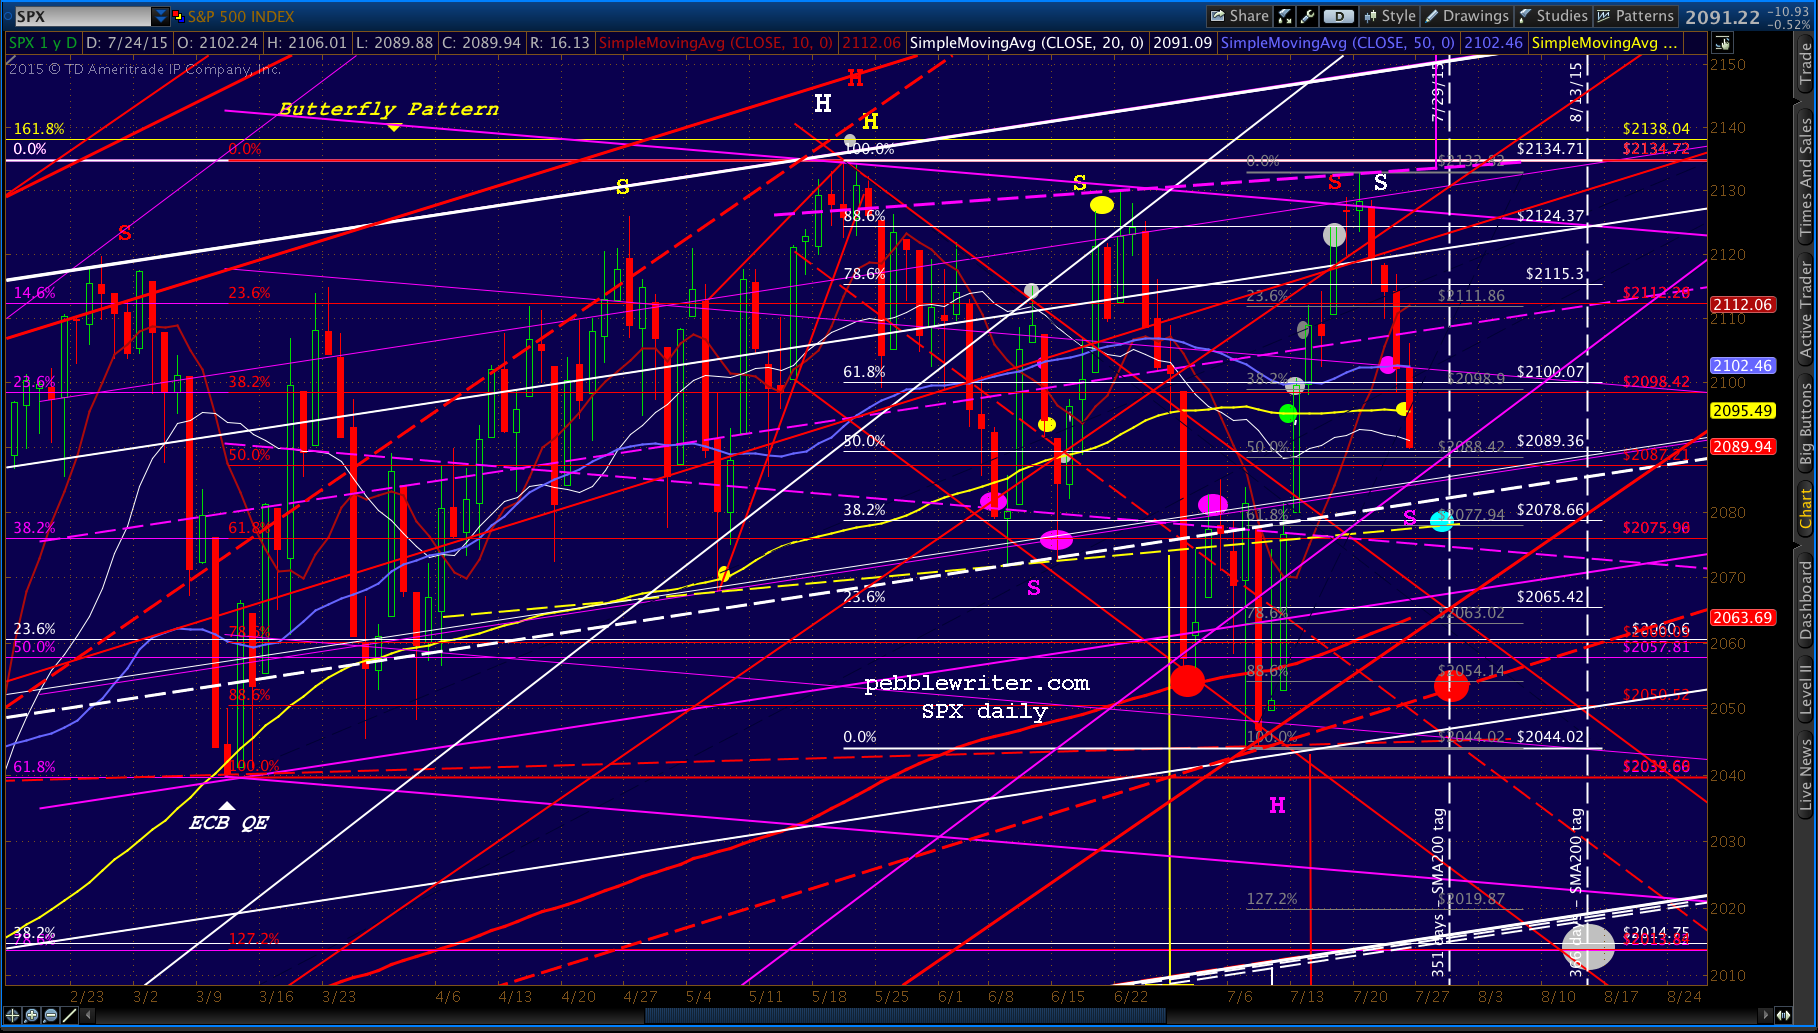
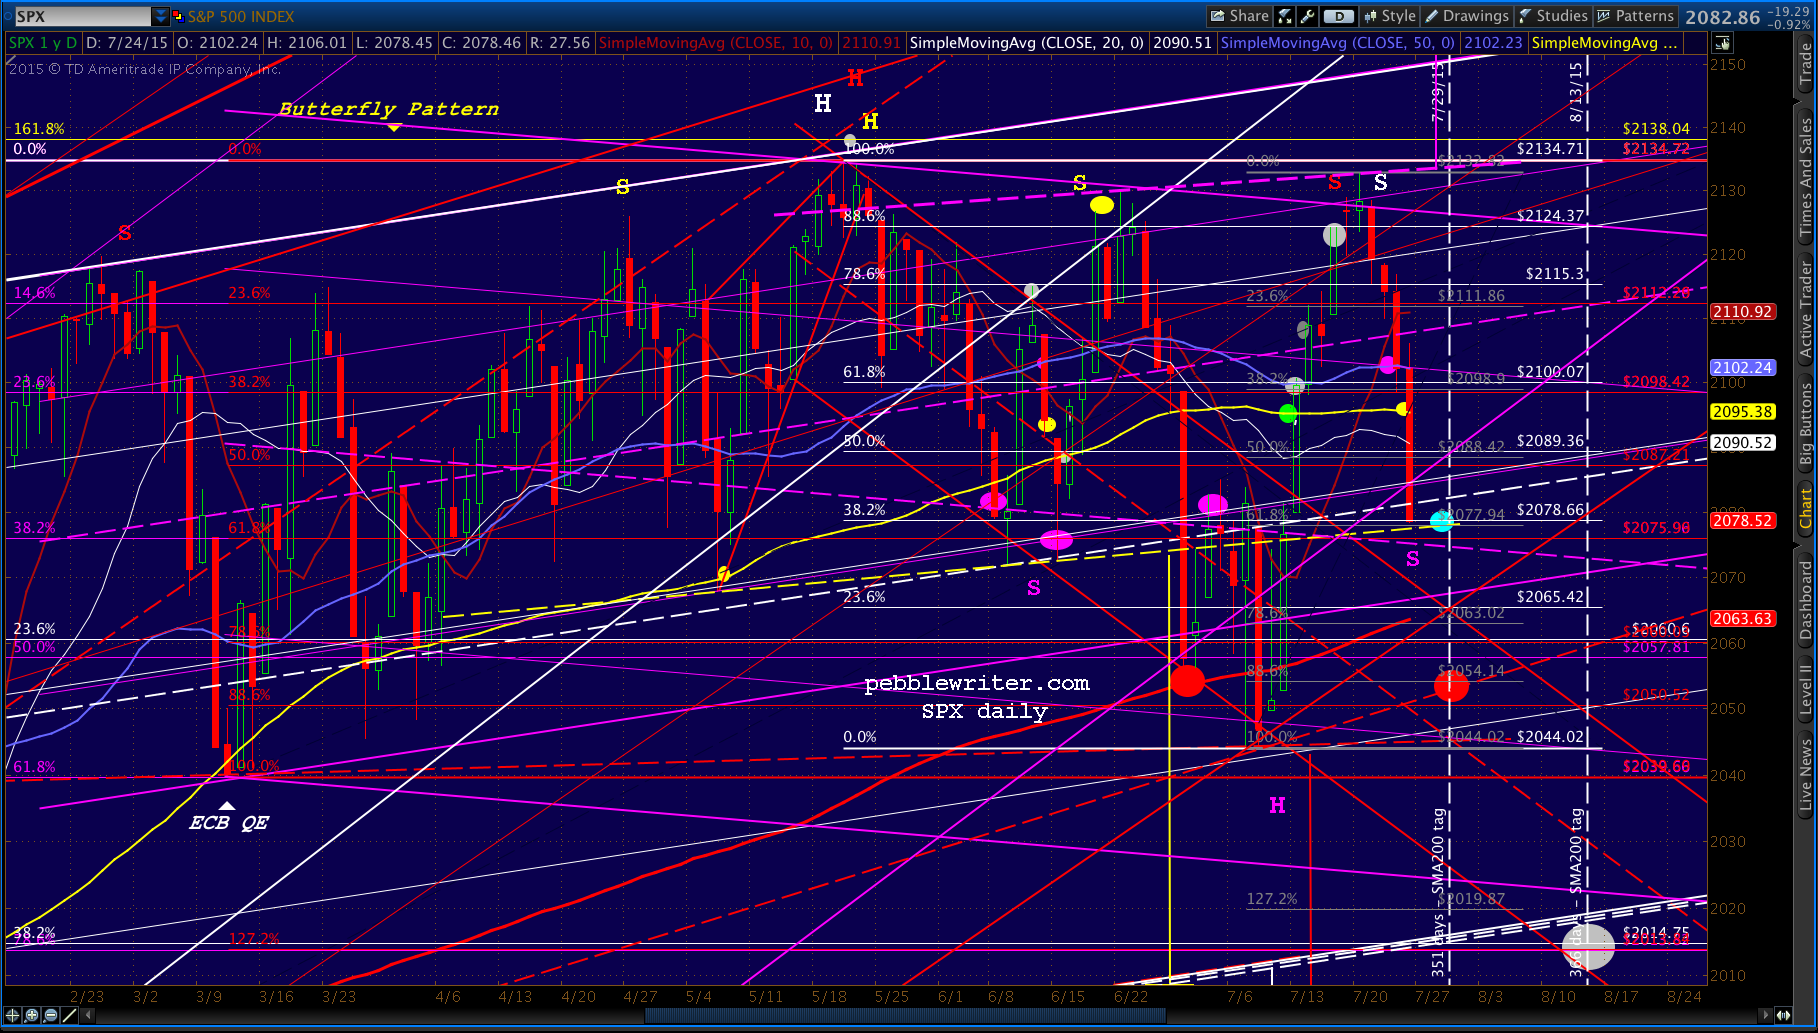
SPX just reached the SMA20…
 …as USDJPY is approaching the backtest of that TL. Keep an eye on it to see if it holds or shoots up past it as so often happens…
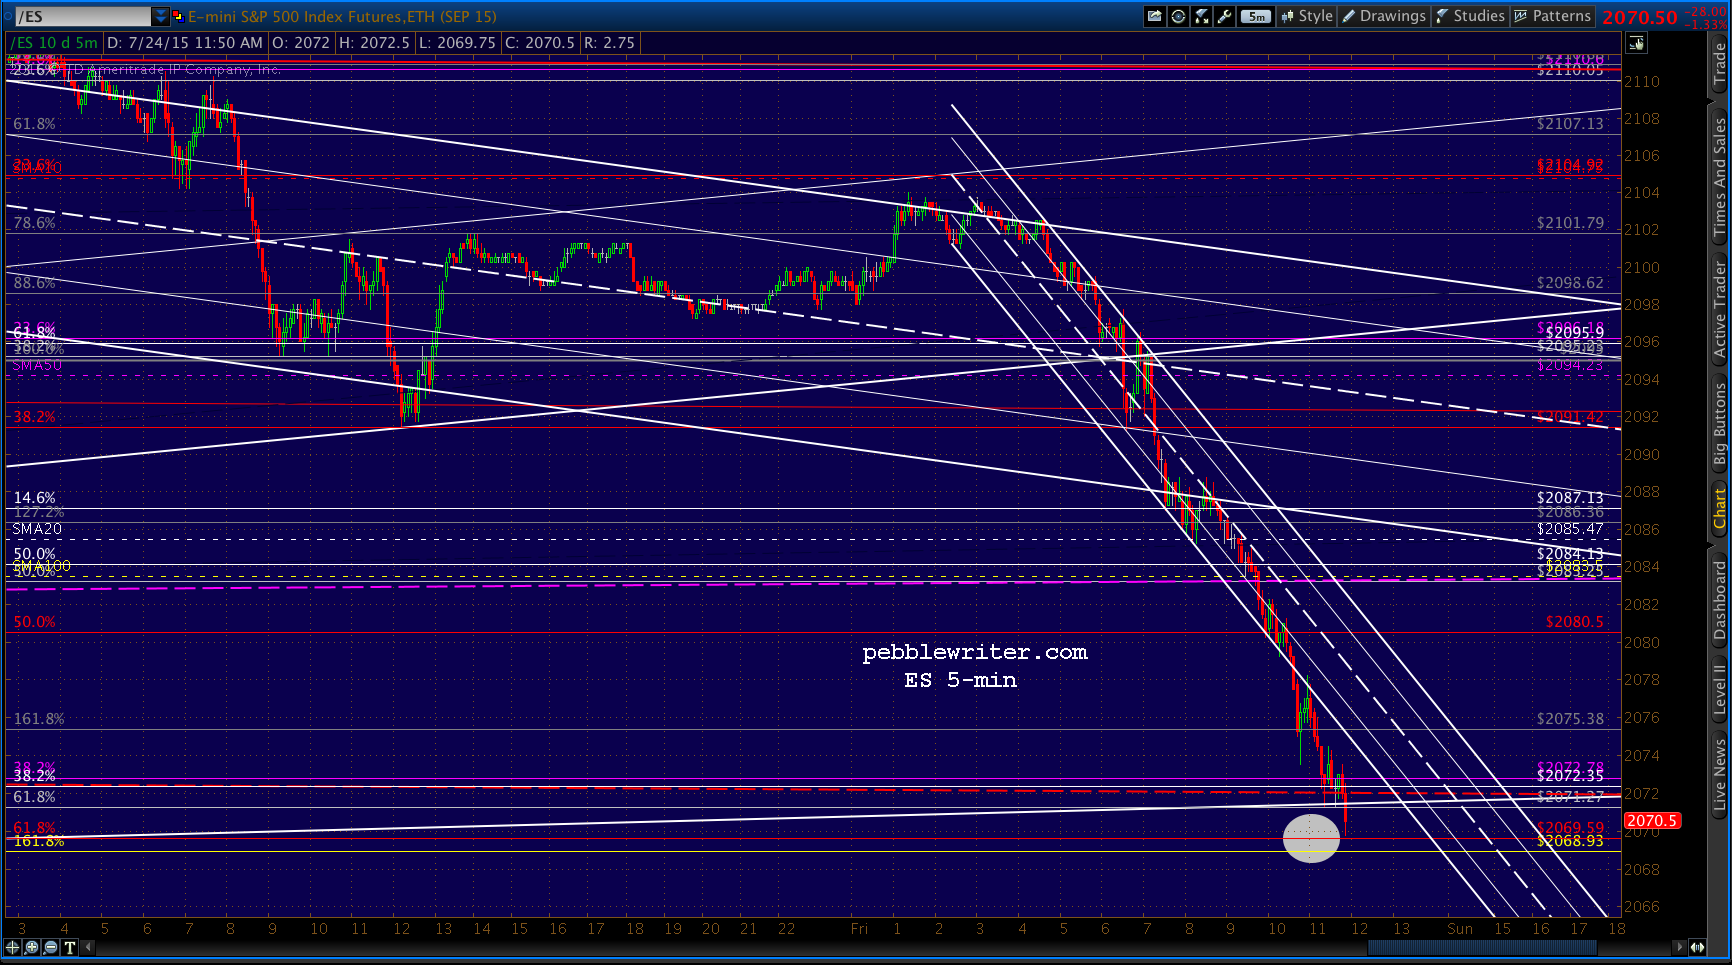
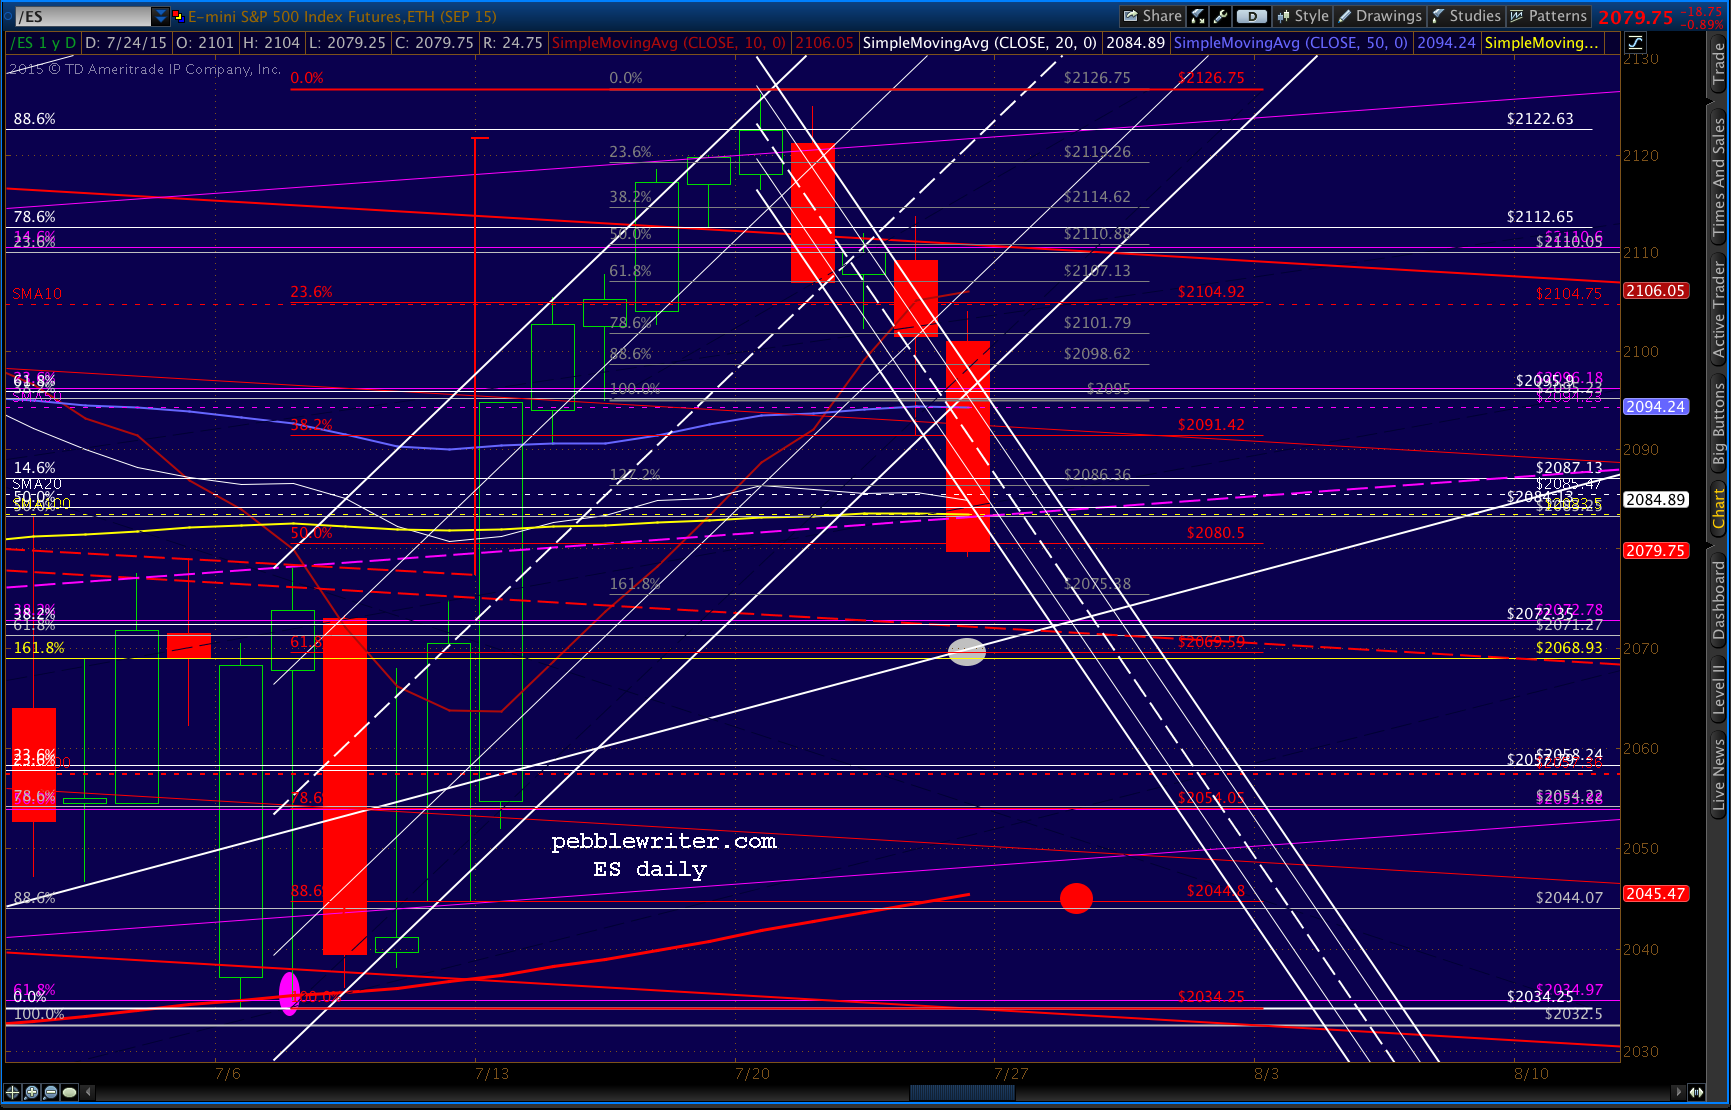
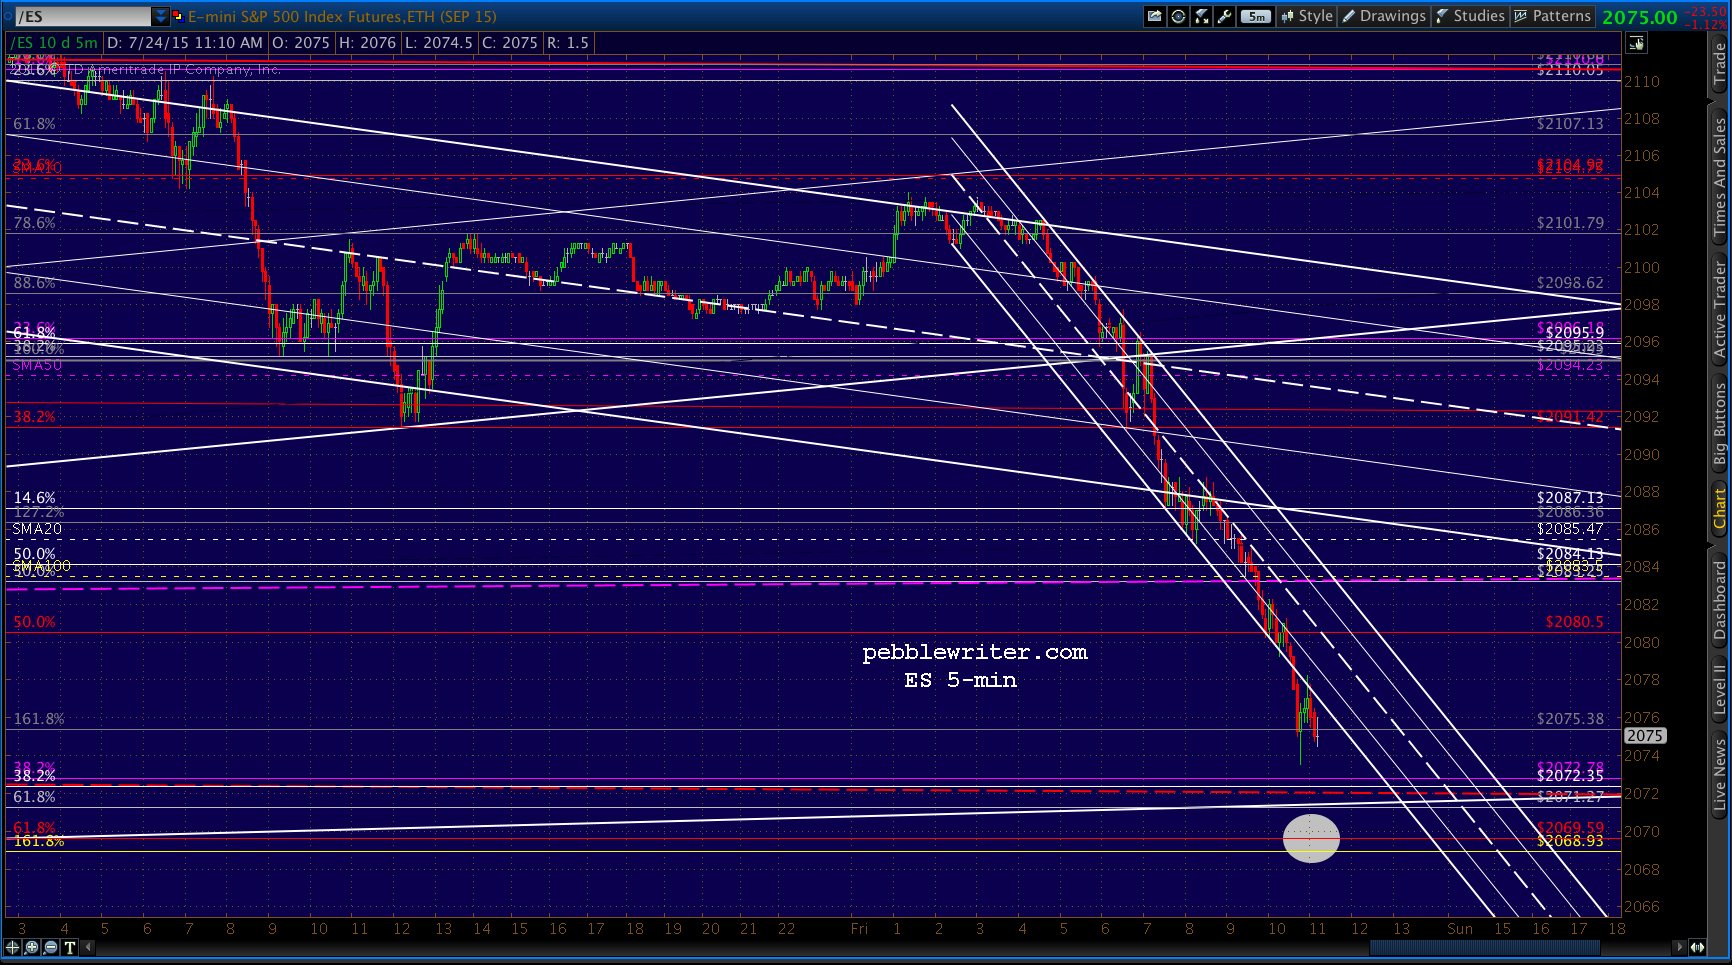
 I’m also keeping an eye on ES, which just tagged the SMA100 at 2083.50. A drop through should get SPX to at least our next target at 2087. ES’ next strong support is the .618 at 2069.59 — which translates into SPX 2076-77 — our white target.
Here’s SPX drawn with the IH&S Pattern (in purple.) It targets 2122, BTW.
 One last note for now: this meltdown — like yesterday’s — is ridiculously calm and methodical. It has the same feel as an algo-driven post-Yellen presser meltup. It gives me some additional confidence that the analog script reads as expected.
USDJPY is loitering just below that TL. I imagine we’ll know when the downside is over when it pops back above and makes a bee line for the red channel midline up around 124.1.
On the other hand, it’s been a while since we had a meltdown into the close on a Friday. These are terrifically unnerving, as they usually rebound strongly over the weekend — leaving shorts gasping for air. But, sometimes, especially when they’re trying to screw over traders, it’s a precursor to a gap down on Monday. Remember, we’re looking for lower prices with a possible bottom next Wednesday.
p.s. Just tagged 2087.31 as ES tagged the .500 at 2080.50. This would be a good place for a backtest of the SMA100 if it’s so inclined.
 UPDATE: 1:22 PM
Here’s the ES chart I’m watching. It’s toying with the .500 as support, but the .618 at 2069.59 is a much better target. A close there would be a real ball-buster.
 VIX, by the way, just tagged its SMA100 and SMA50.
 UPDATE: 1:47 PM
 60:40 chance that was a head fake. Keep an eye on USDJPY and ES 5-min. We’re up 50 points in the last week alone and have definitely topped last month’s 13.91%. Would be nice to capture another 5 points, but keep your stops where you’re comfortable.
 UPDATE: 2:23 PM
 UPDATE: 2:54 PM