

The long-awaited final movement of the analog we’ve been watching for four months is here. Originally floated on Mar 27, it has done a bang up job of signally the USDJPY’s moves which, in turn, have helped tremendously in our daily forecasting.
Though I’ve vacillated on the target price over the past couple of months, the timing looks to be rock solid. From our June 8 post:
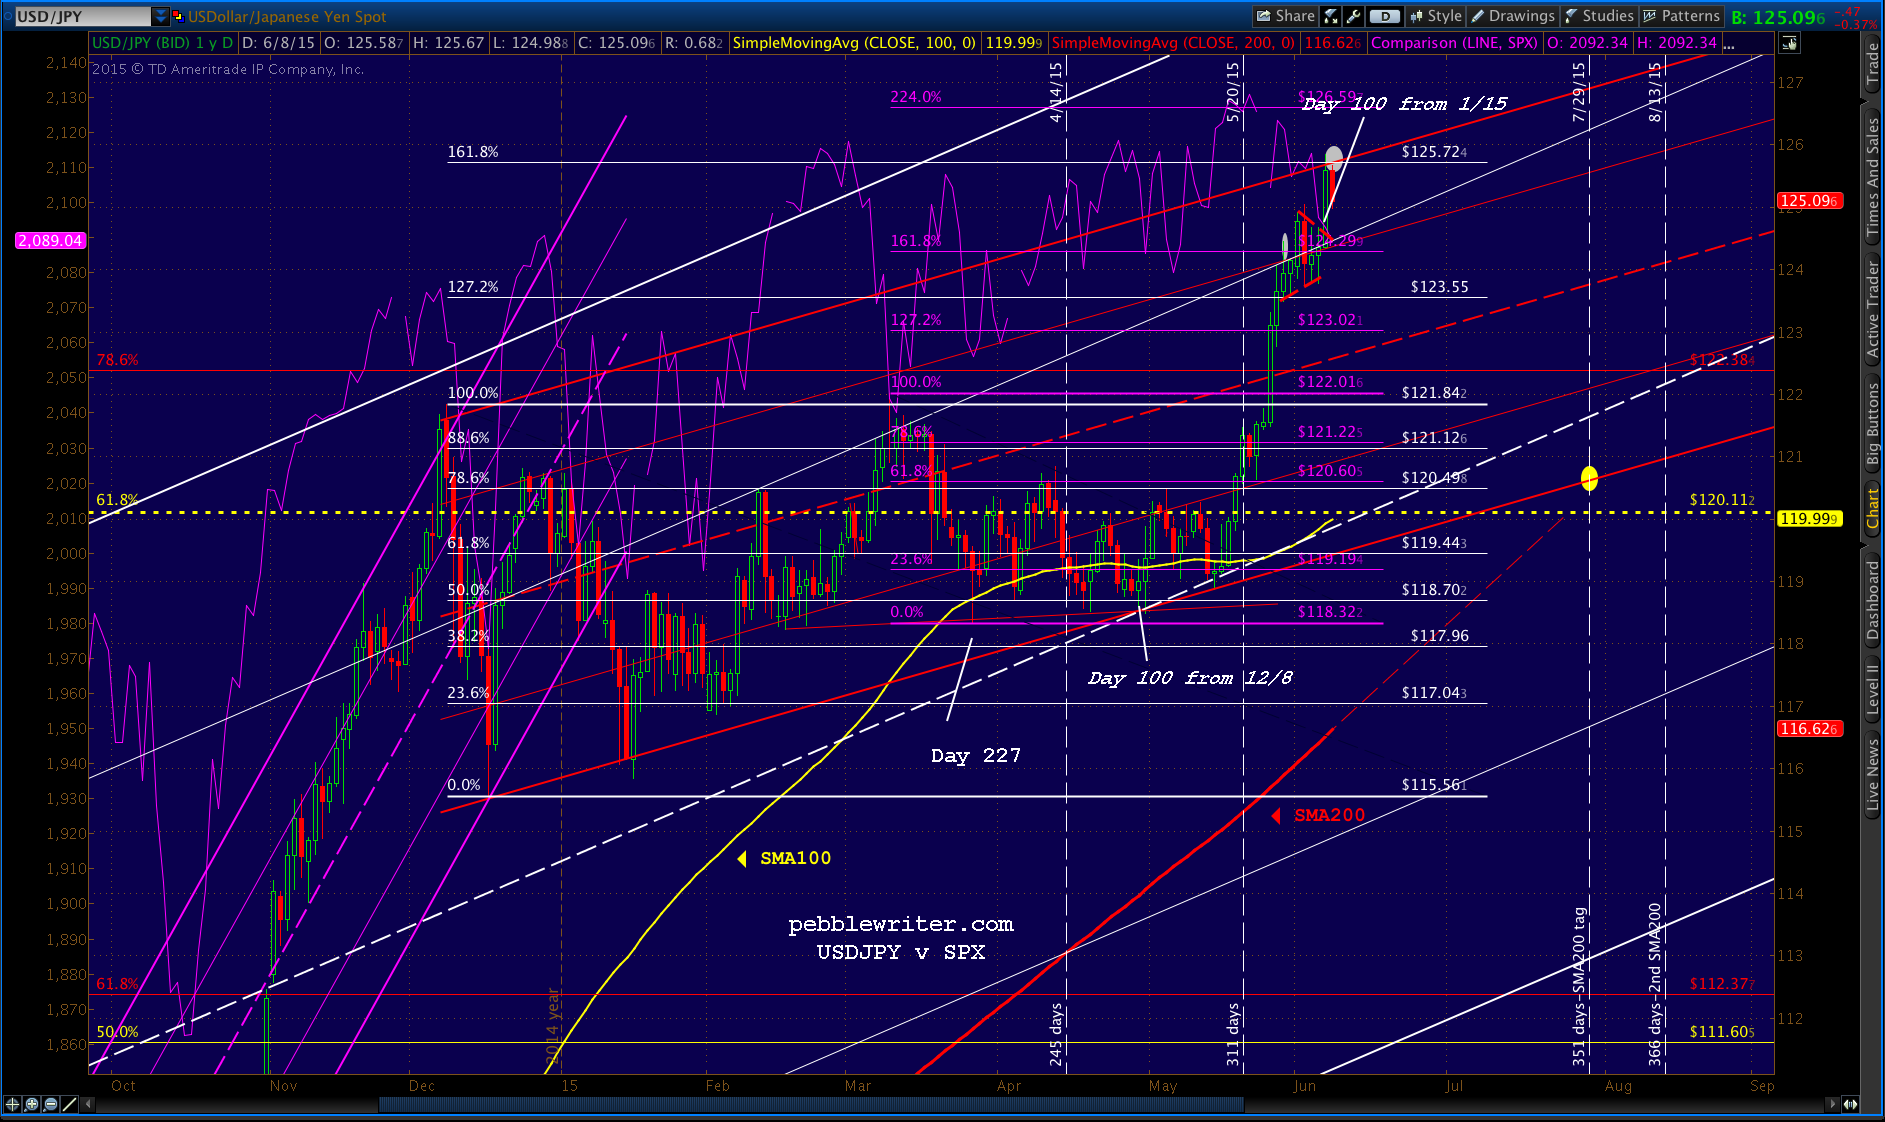
The next key date as originally forecast several months ago is this Wednesday, July 29. USDJPY is already tumbling…  …and, as we discussed last week, NKD is tumbling right alongside it — getting closer to that dreaded H&S Pattern we’ve anticipated.
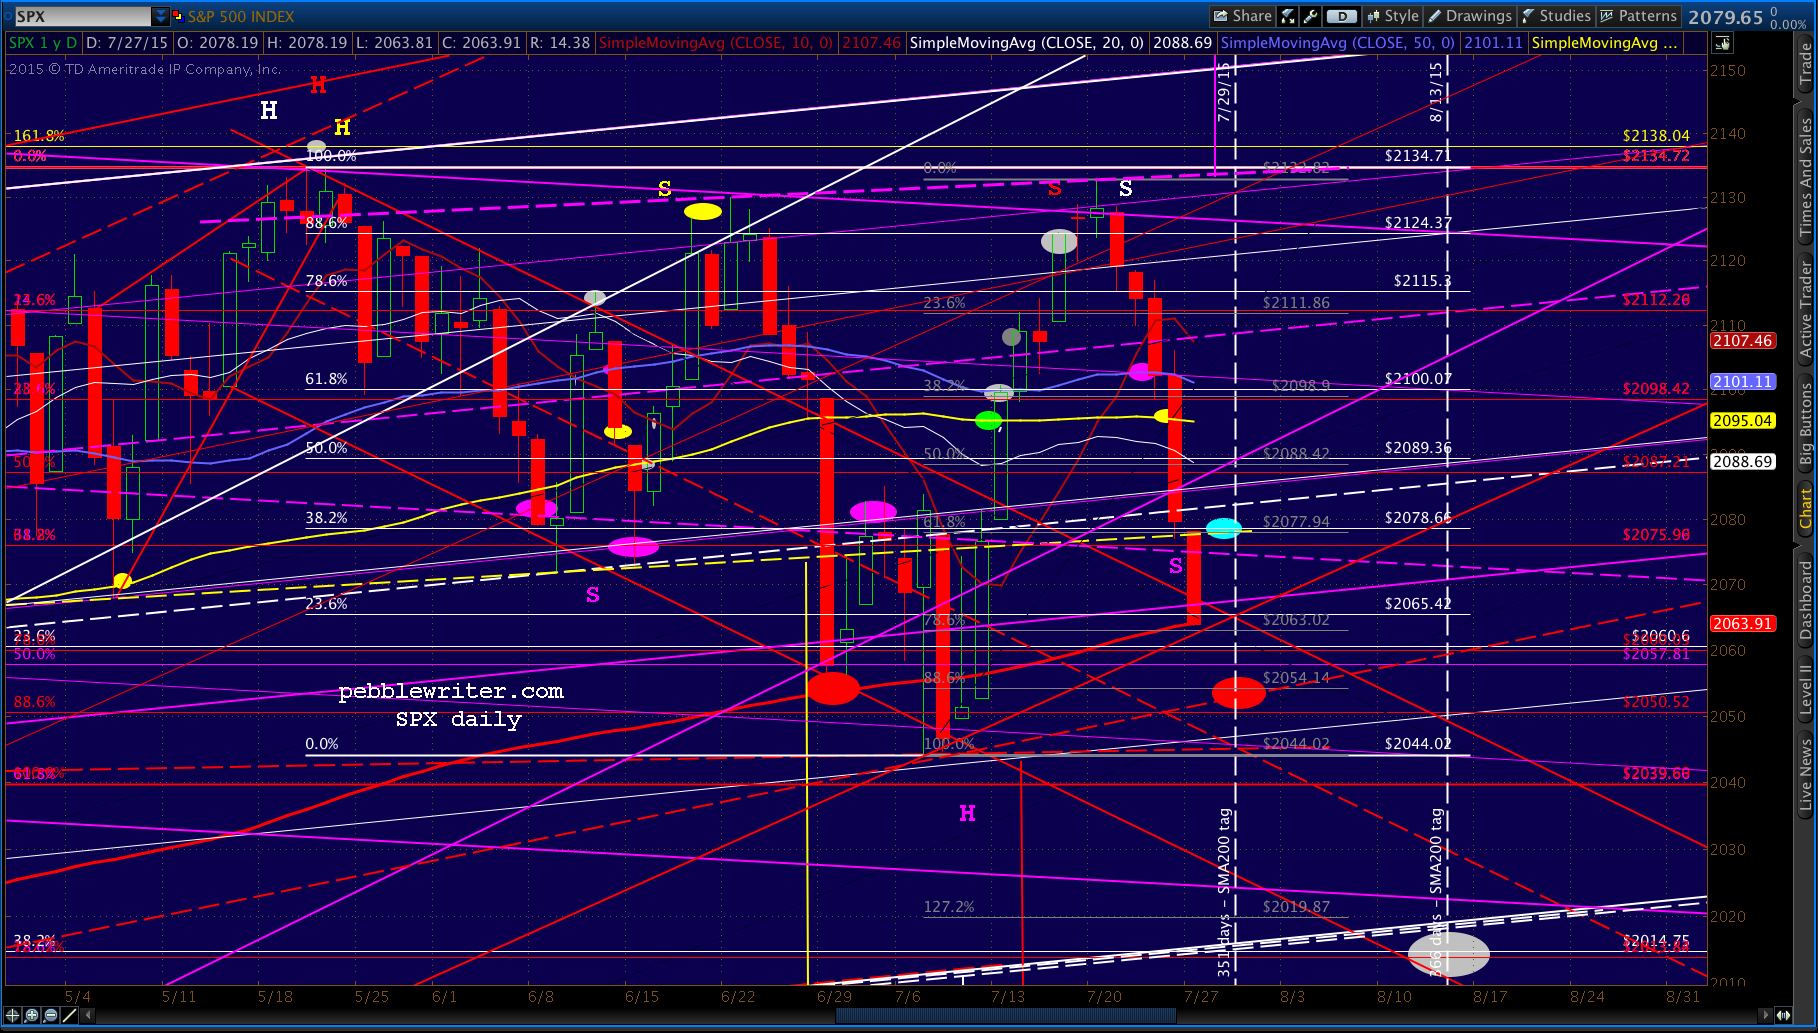
 SPX reached our next downside target on Friday a few days ahead of schedule — which means that target was probably too conservative.
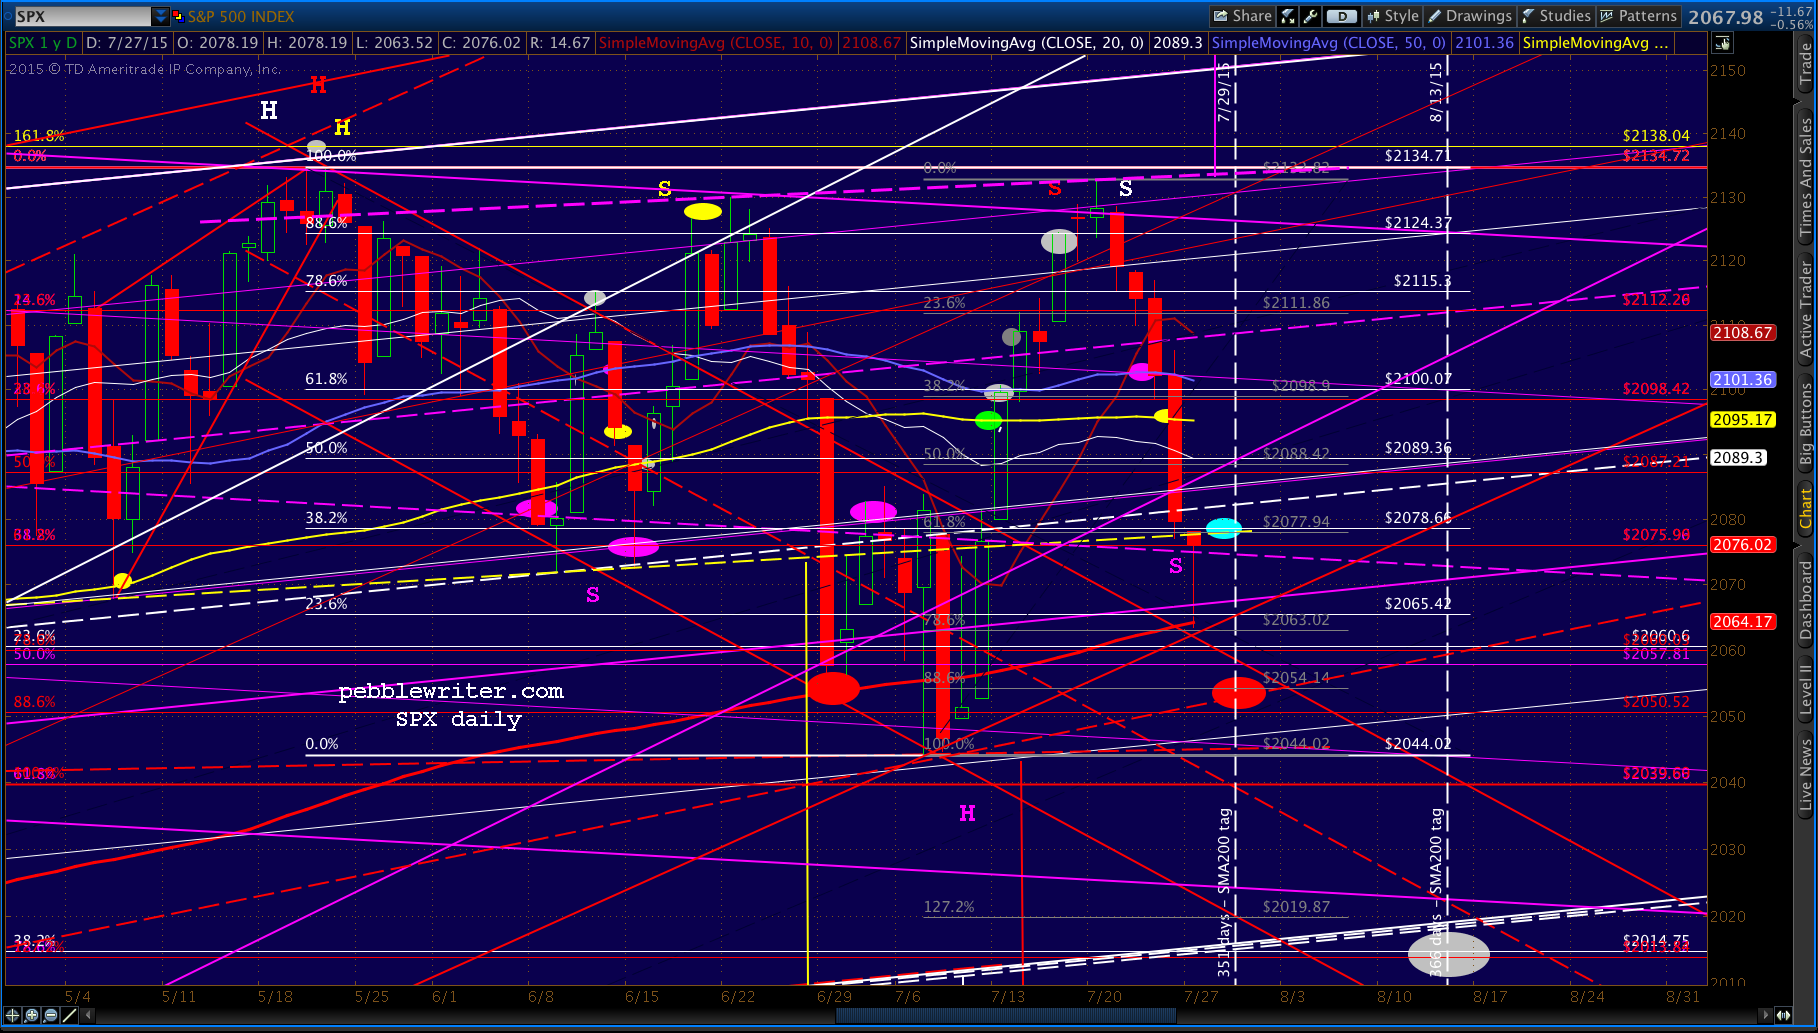
While there will no doubt be bounces along the way, the key is to remain short until we reach our next downside targets posted last week. It will probably be scary, but it should be a very profitable week.
continued for members…
I’ve bounced back and forth between the red target at the .786, the .886 or the former low at 2044. It’s still unclear to me. Let’s just say I think 2054 is quite doable today, though I’m very open to 2044. I’d be very surprised if SPX didn’t dip below the SMA200 today — currently at 2064ish.
UPDATE: 9:43 AM
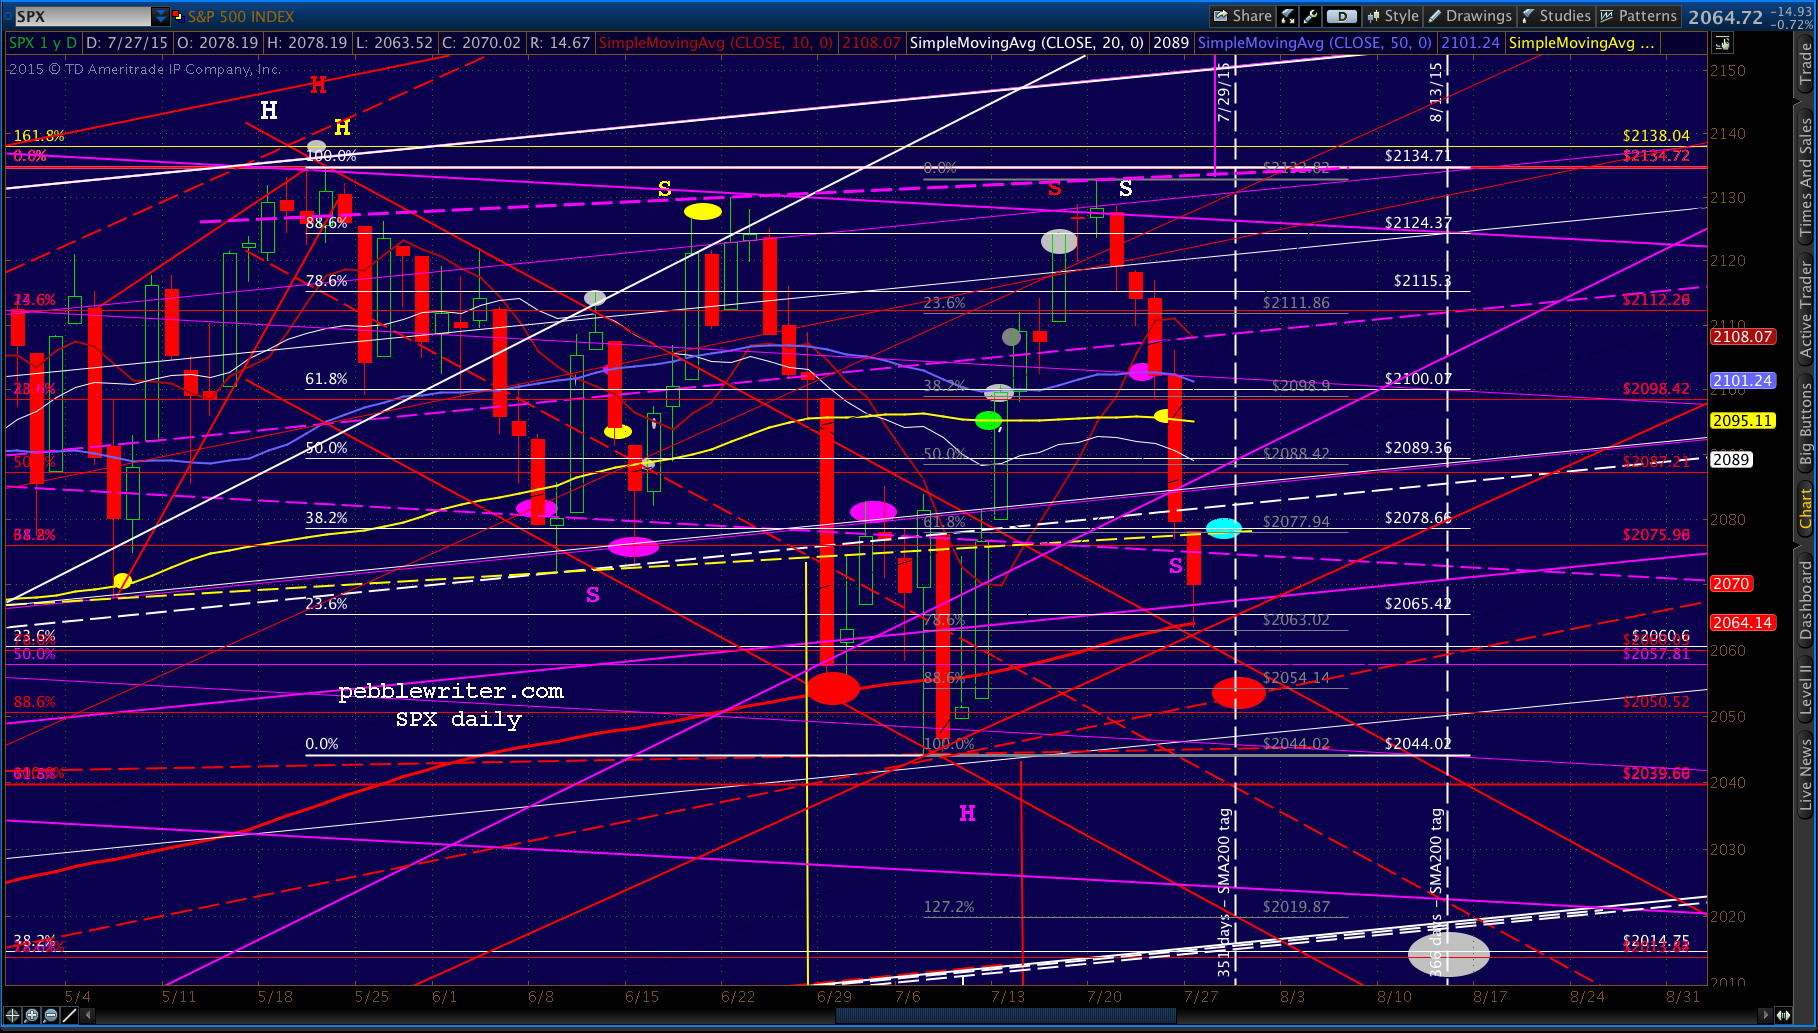
There’s the SMA200. Will likely get a bounce here at 2064 — but, only if USDJPY bounces.
 I’d not switch to a long position on SPX unless it does. Right now, it’s not looking like it wants to.
 Of course, it might be waiting for the gray .786 at 2063.02 or .886 at 2054.14.
UPDATE: 9:47 AM
That’s what it was. SPX needed a slightly lower push — came within a few cents of the .786. USDJPY rebounding now.
 If it does break out, the upside target for SPX is the purple midline intersection with the yellow neckline at 2075-2078.
Coming up on 10AM, here’s a progress report:
 UPDATE: 10:00 AM
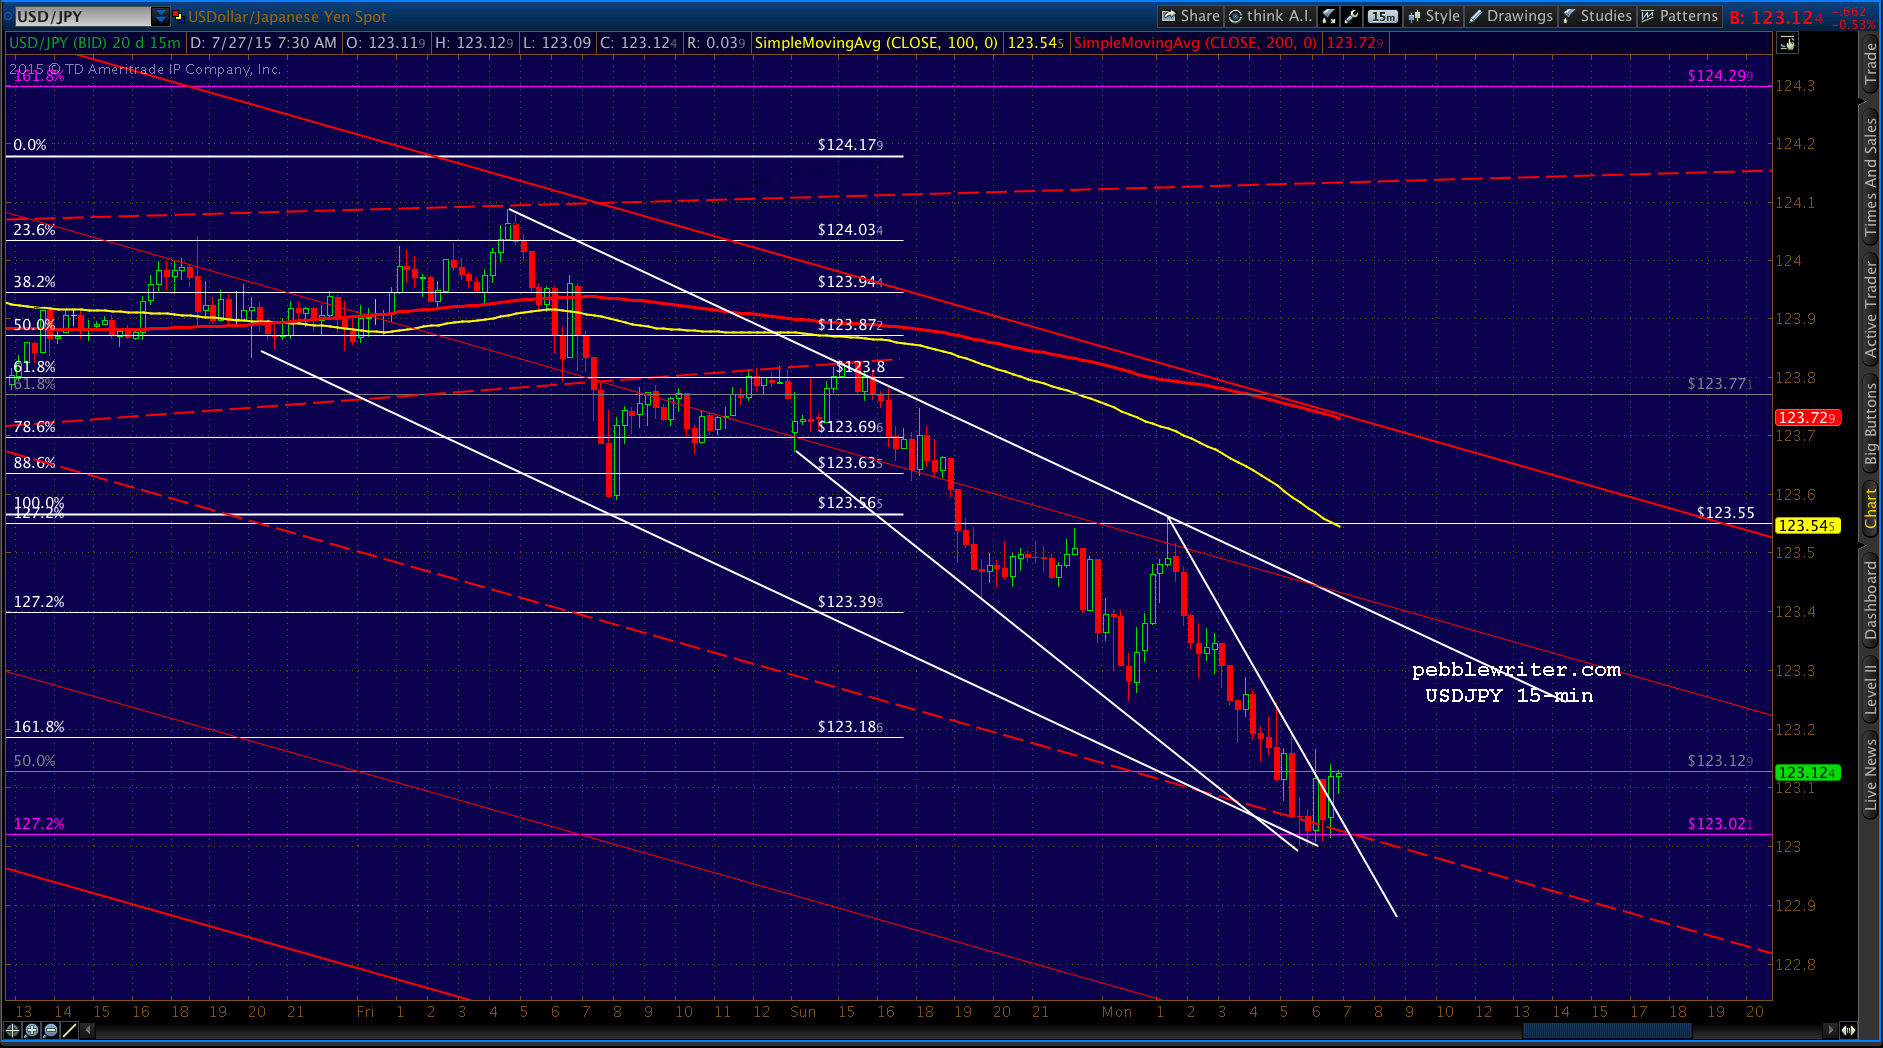
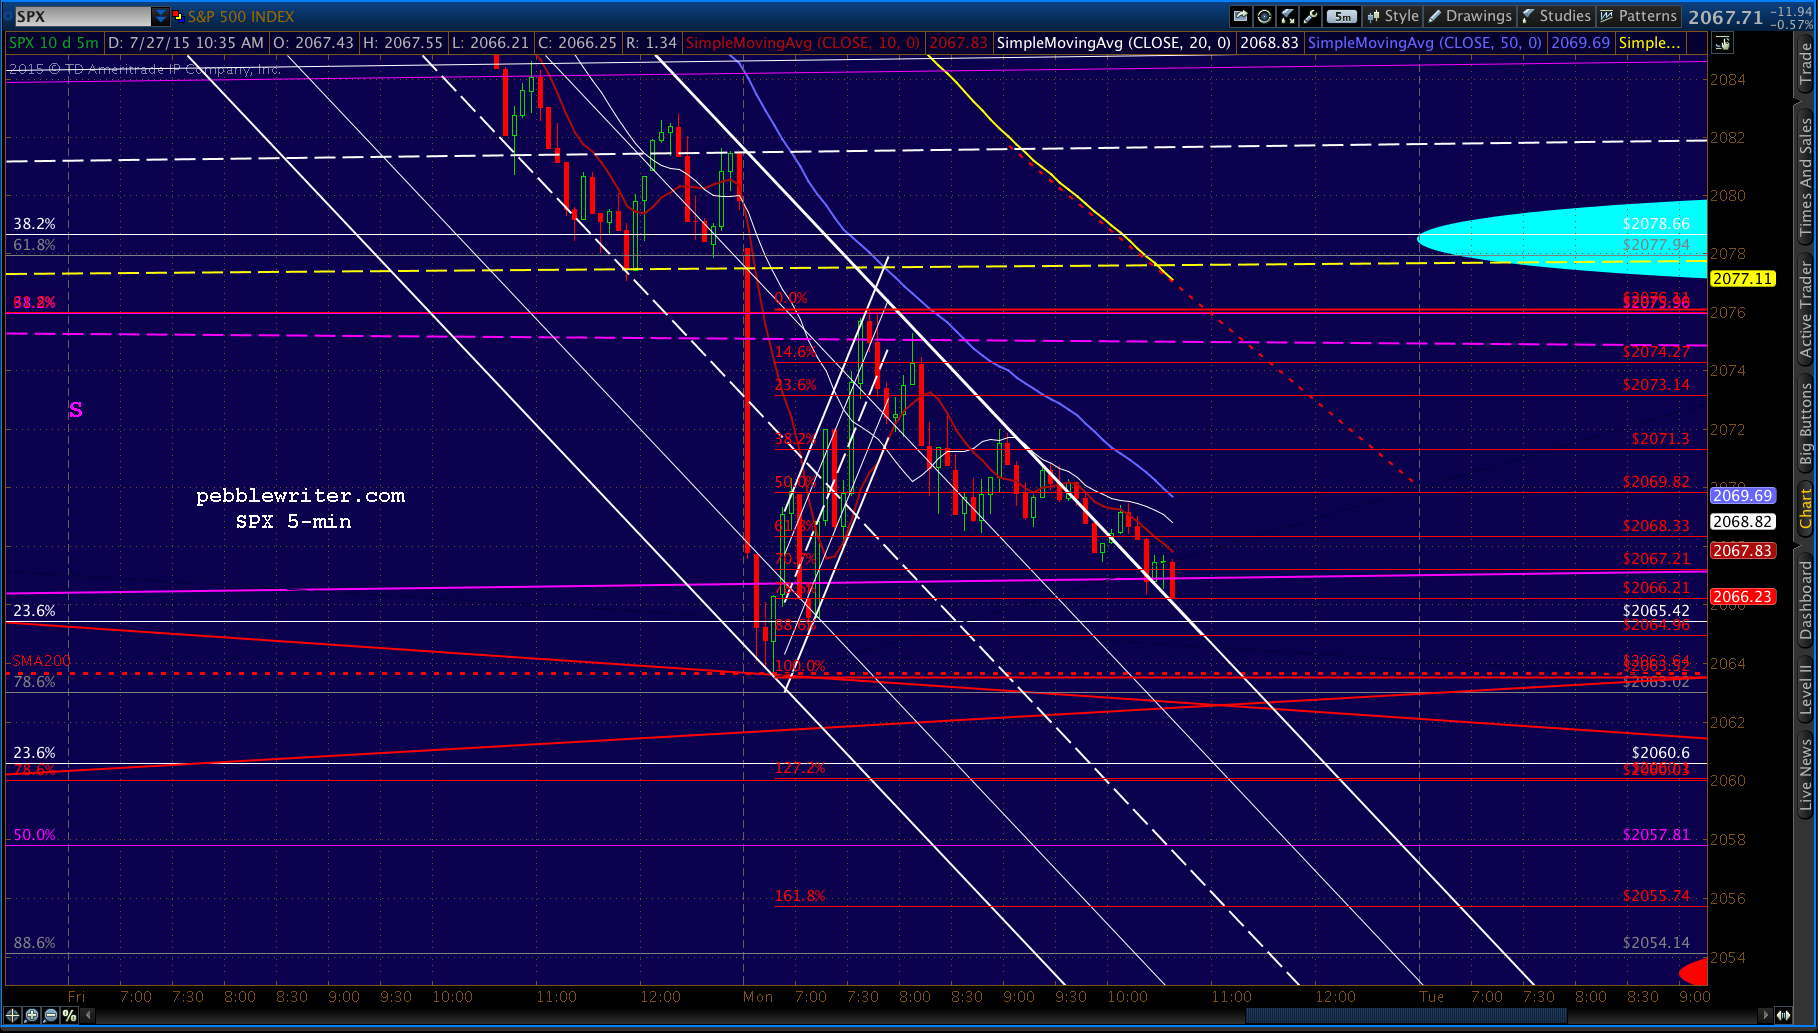
 The key price for USDJPY is 123.02. Also, be aware that DX is very close to channel midline support.
 UPDATE: 10:30 AM
Note that USDJPY hasn’t broken above the earlier bounce — just broadening the wedge. Swing traders should do fine staying short.
 Note that a nice .786 reversal in SPX suggest a Butterfly Pattern, and the 1.272 extension is at our white target of 2014.75. Updated charts in a few.
UPDATE: 10:40 AM
 UPDATE: 13:02
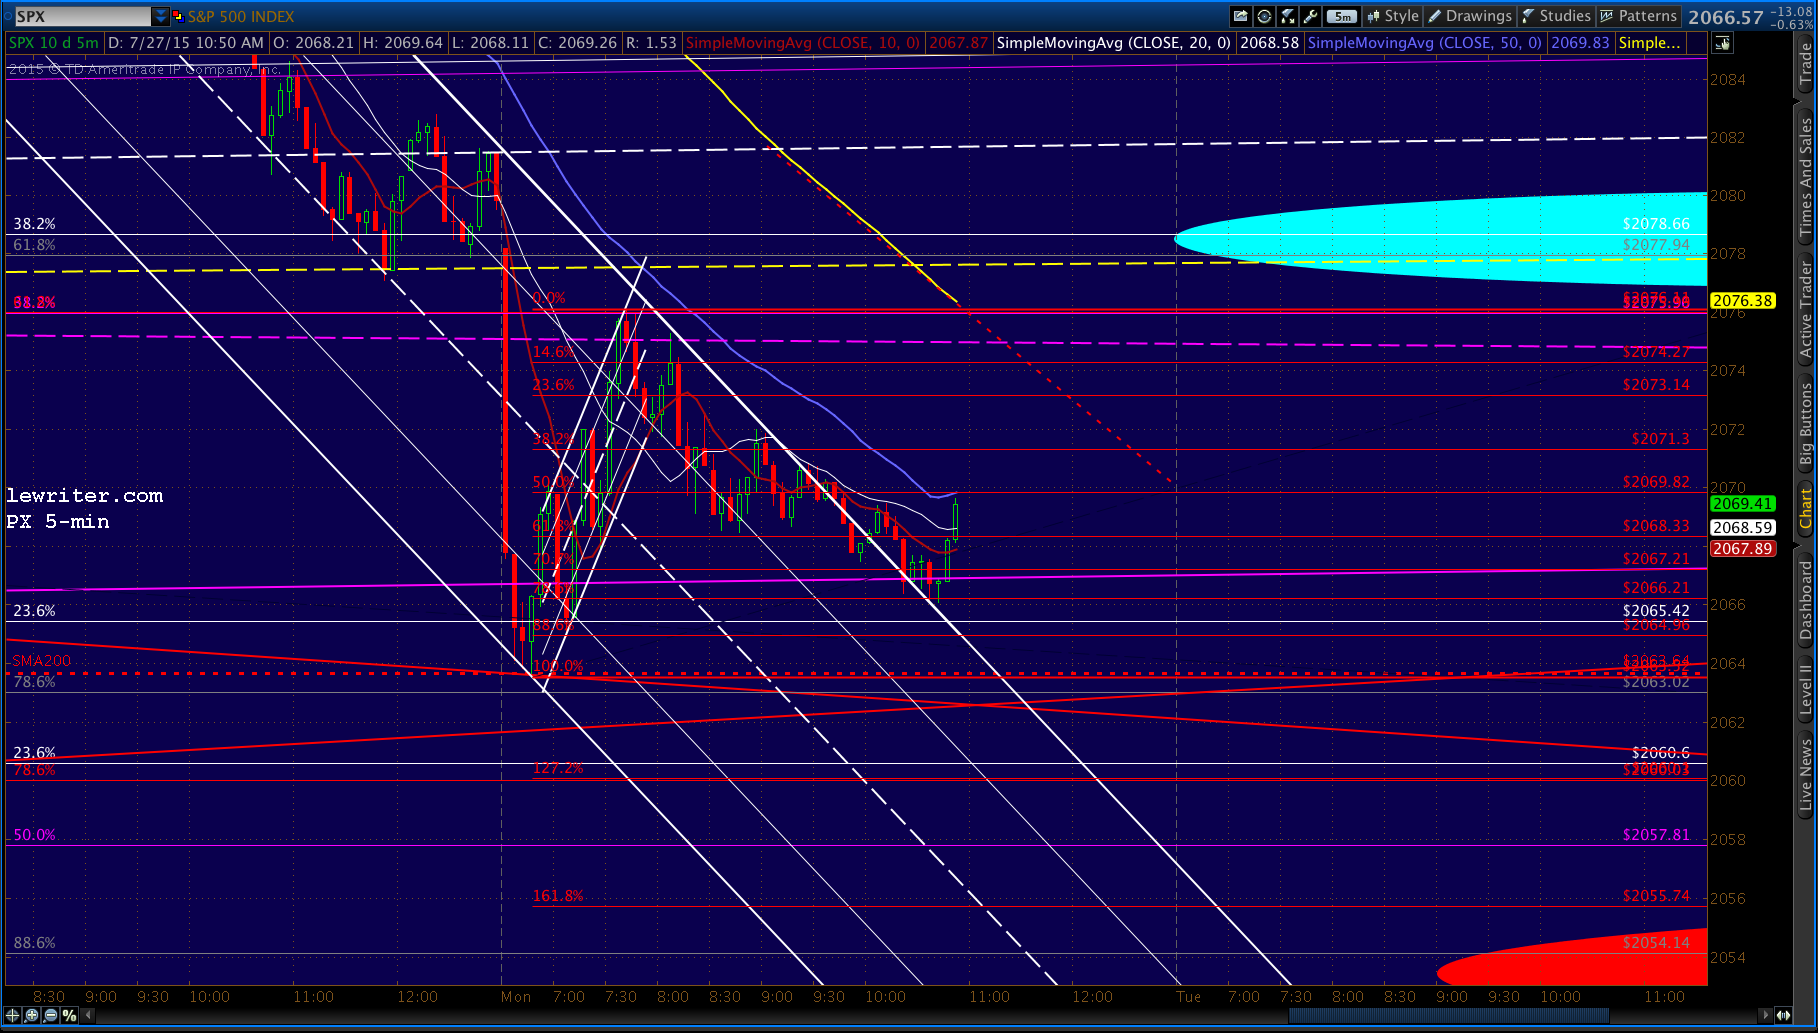
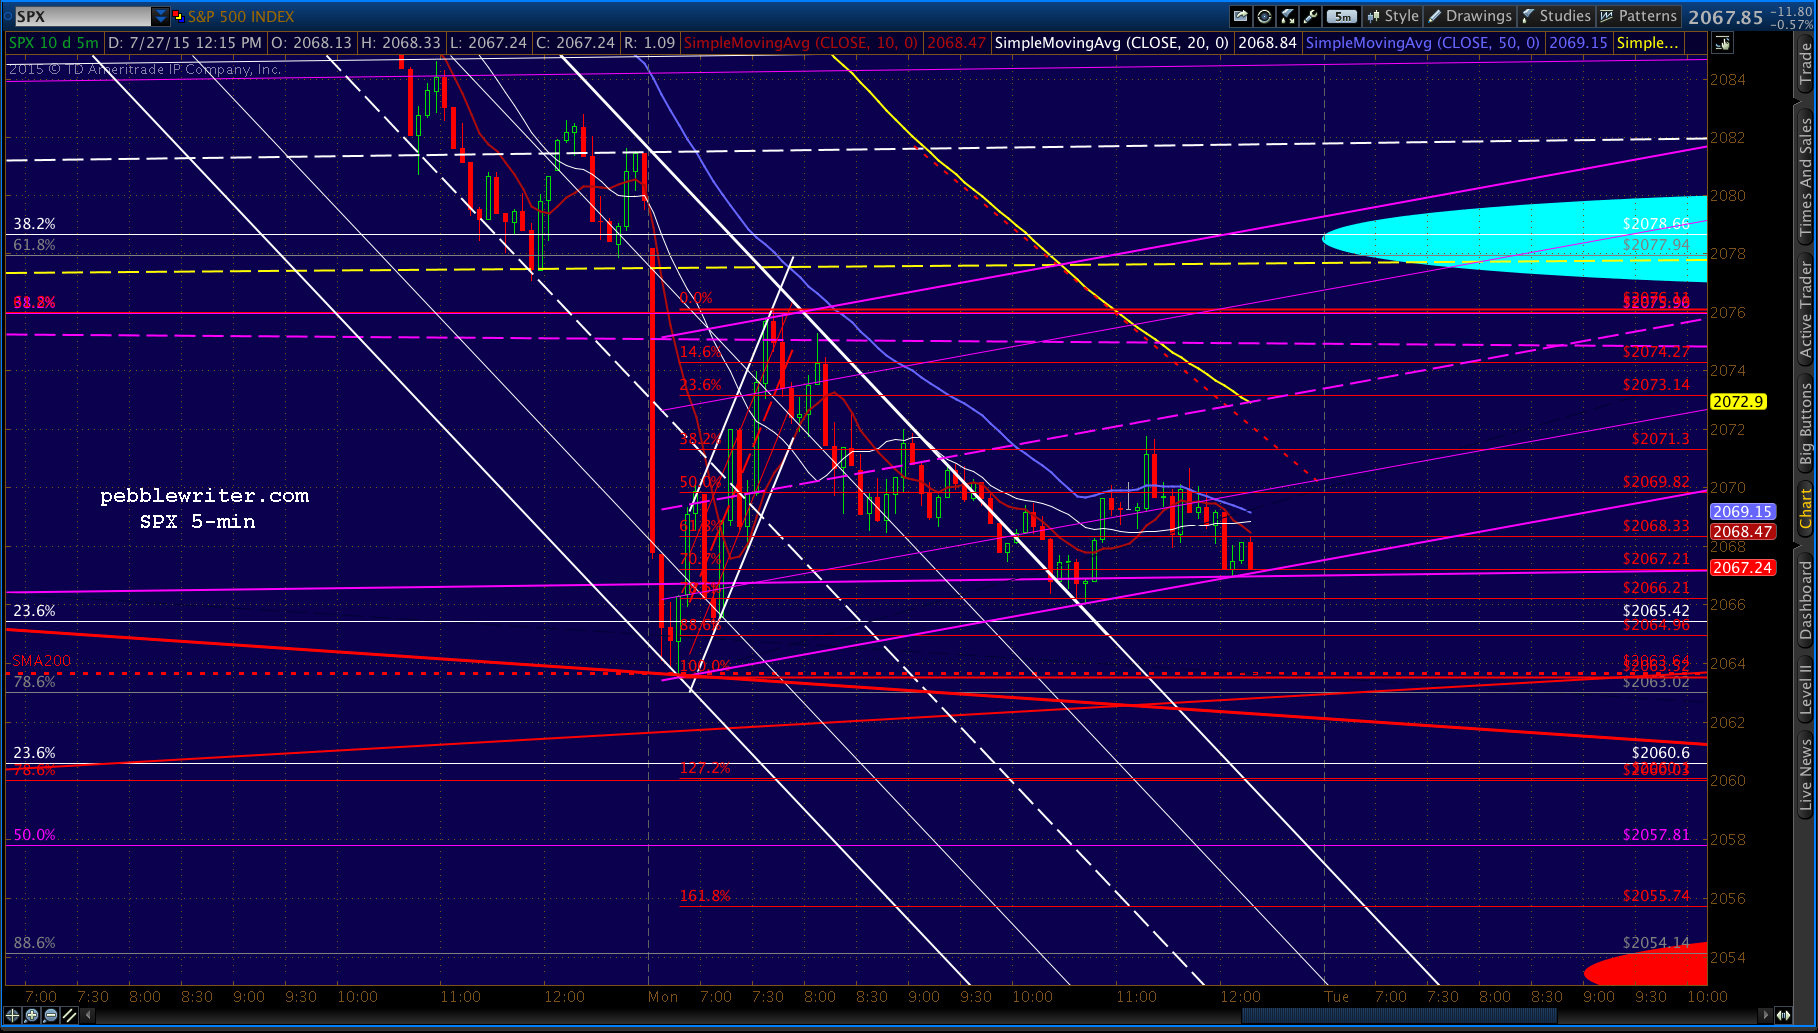
SPX edging lower since our last call — 9 points to the good. It appears that TPTB have a lower bounce point in mind than 2063.52, but we’ll see. I’ll be watching the white channel and SMA10 on the 5-min chart — which is often a good momentum shift indicator.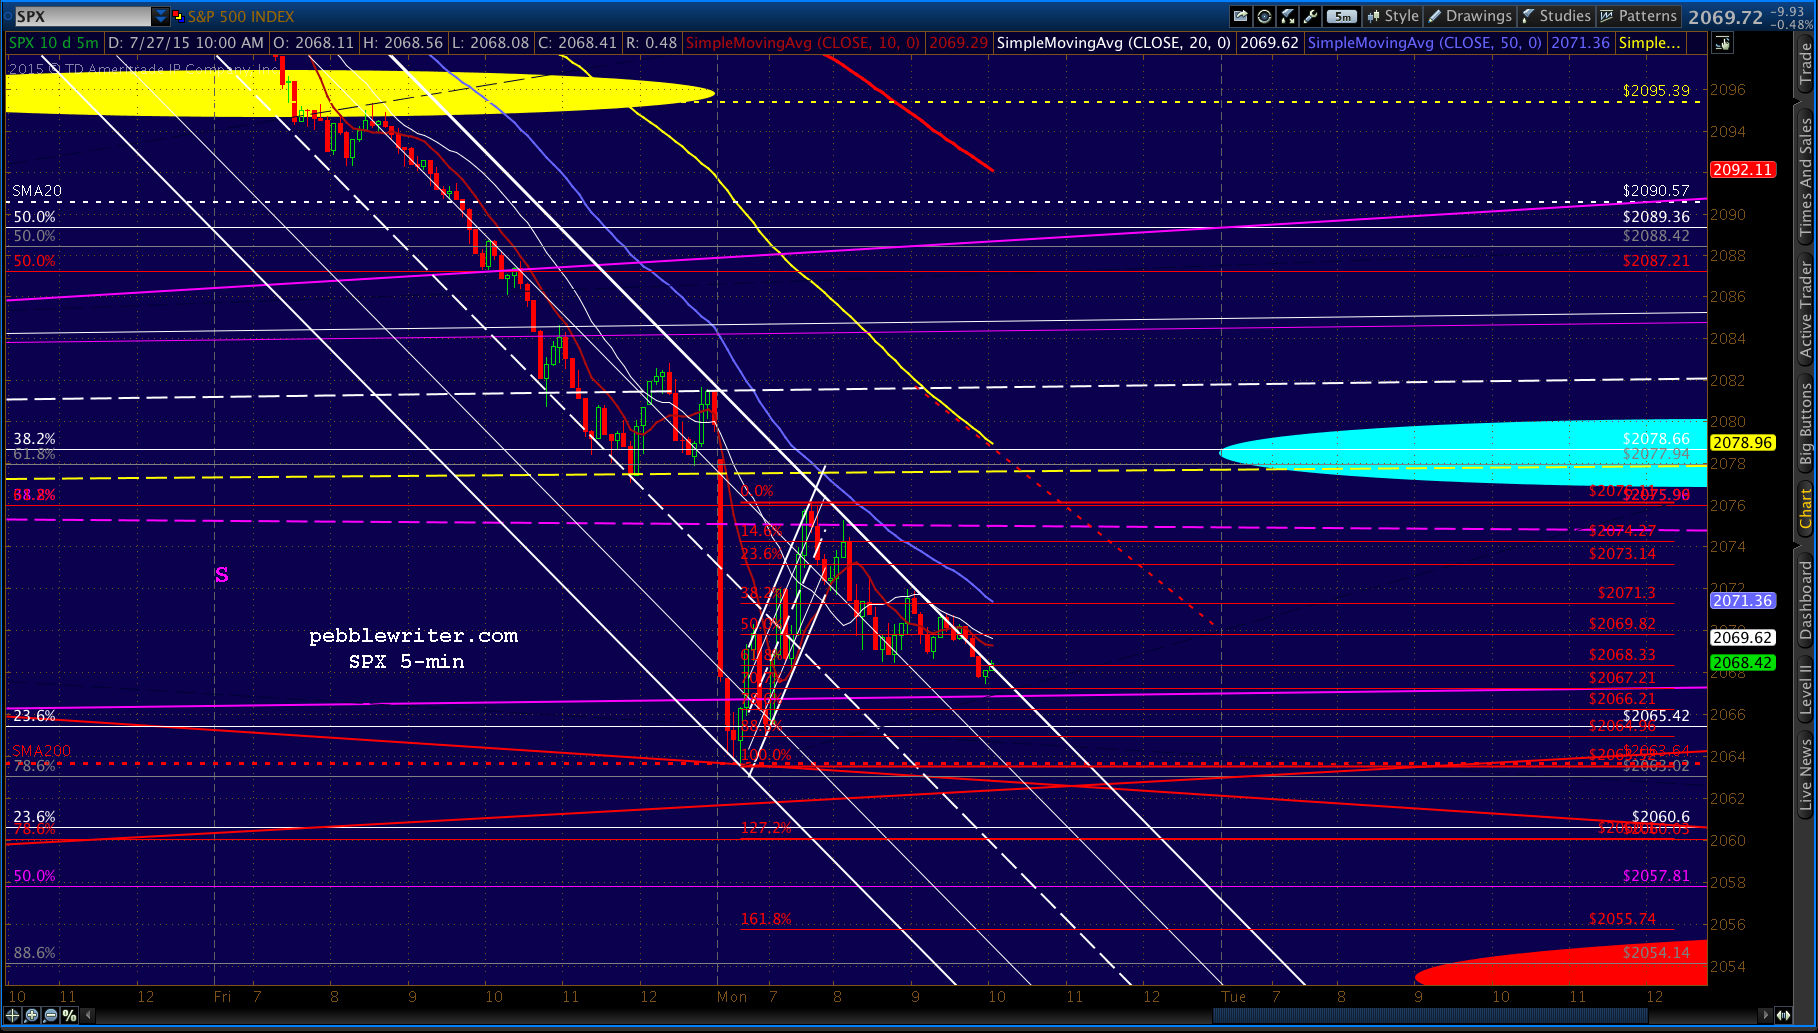 USDJPY’s FW suggesting a possible channel, but not terribly convincing since we know what’s coming. What we don’t know is where the bounces will occur along the way…
 UPDATE: 1:36 PM
SPX just reached a .786 retracement (2066.21) of this morning’s lows. Time to tighten up those stops…
 UPDATE: 1:51 PM
 USDJPY backtesting the rising white channel, so probably just a head fake. In any case, this is very likely just a temporary bump on the way lower. So, the question is how far they’ll take it before letting go. For anyone playing the bounce, I’d set stops around 2067 just in case.
UPDATE: 3:20 PM
 USDJPY coming up on channel top and SMA200 on 5-min.
 Both should be lower tomorrow. Note the usual caveats: stay short only if you can hedge or deal with the risk of a ramp.