Author: pebblewriter

  • That Escalated Quickly!

    It was just last Tuesday we asked “where’s the bounce?”  SPX had gapped lower and failed to rebound the way it always seems to has for the past year.

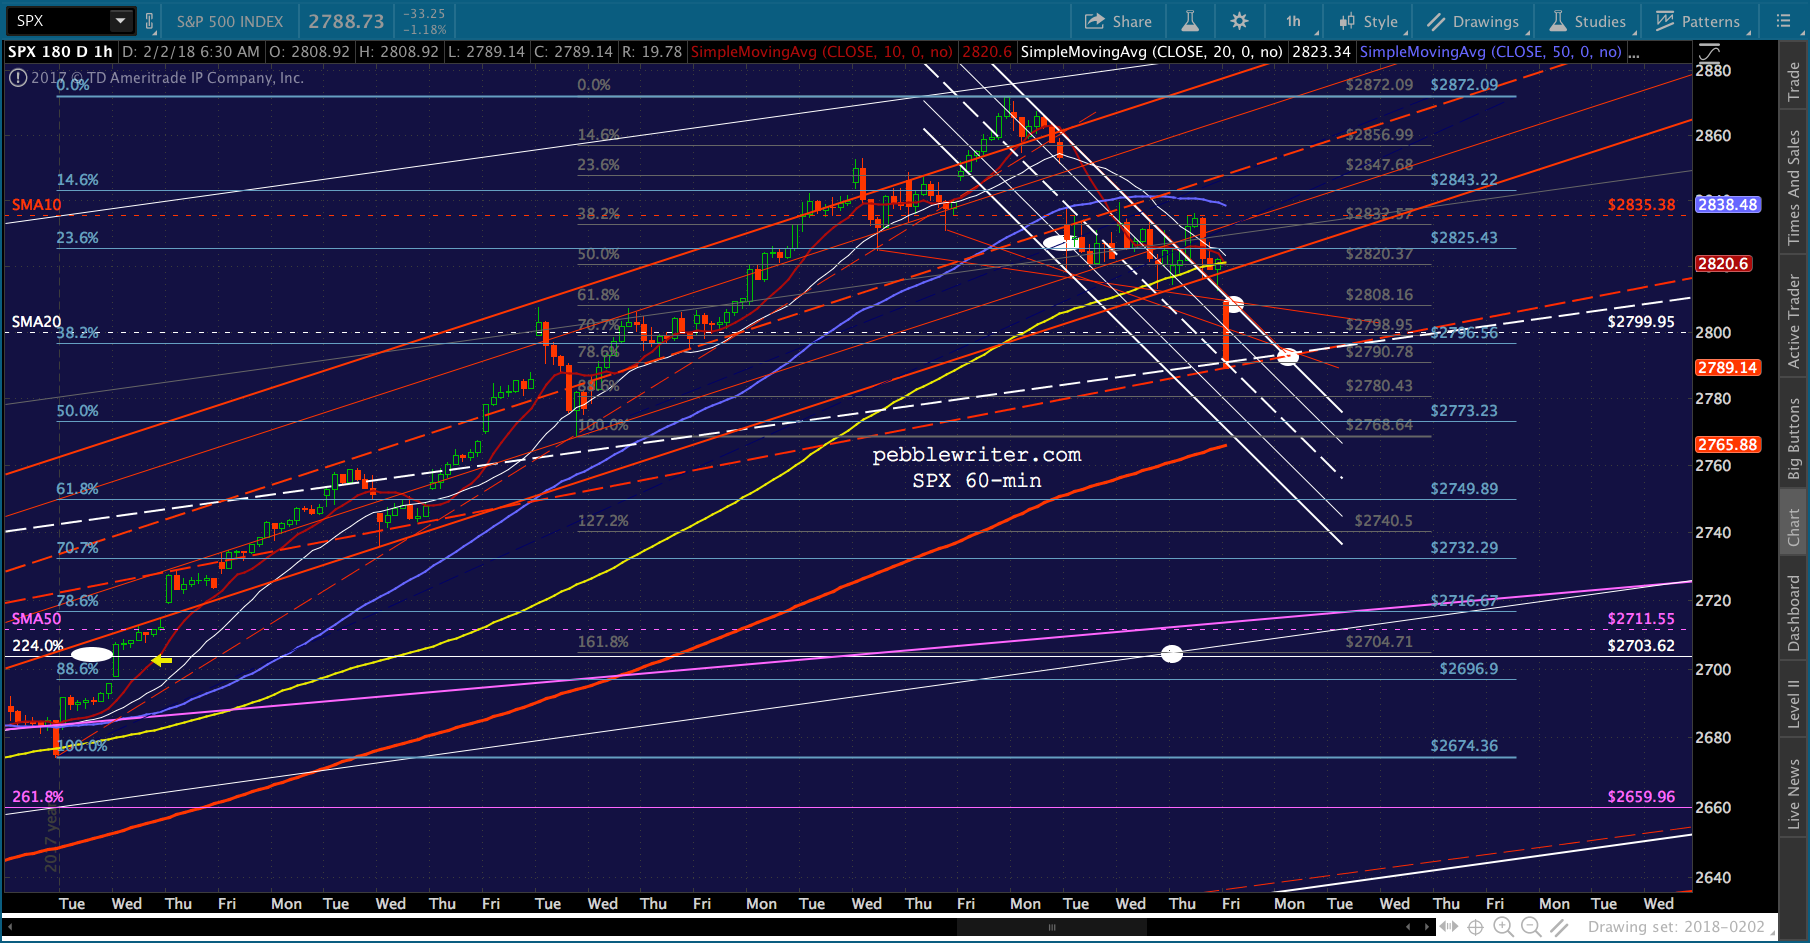
    We had watched a trend line dating back to Dec 29 (below, in red) break down, and were wondering about the small, white channel.  From Where’s the Bounce?

    After that, it gets a little messy. ES has an important backtest at 2773, which would be 2730 on SPX — nothing all that important in the vicinity. Below that, however, the white 2.24 at 2703.62 remains very interesting. It would be a hell of a drop from here: 117 points or 4.1%.

    The closer we got to 2703, the more plausible it seemed.  When we reached it today, though, SPX leveled off for only about 10 minutes before plunging lower.  Why?

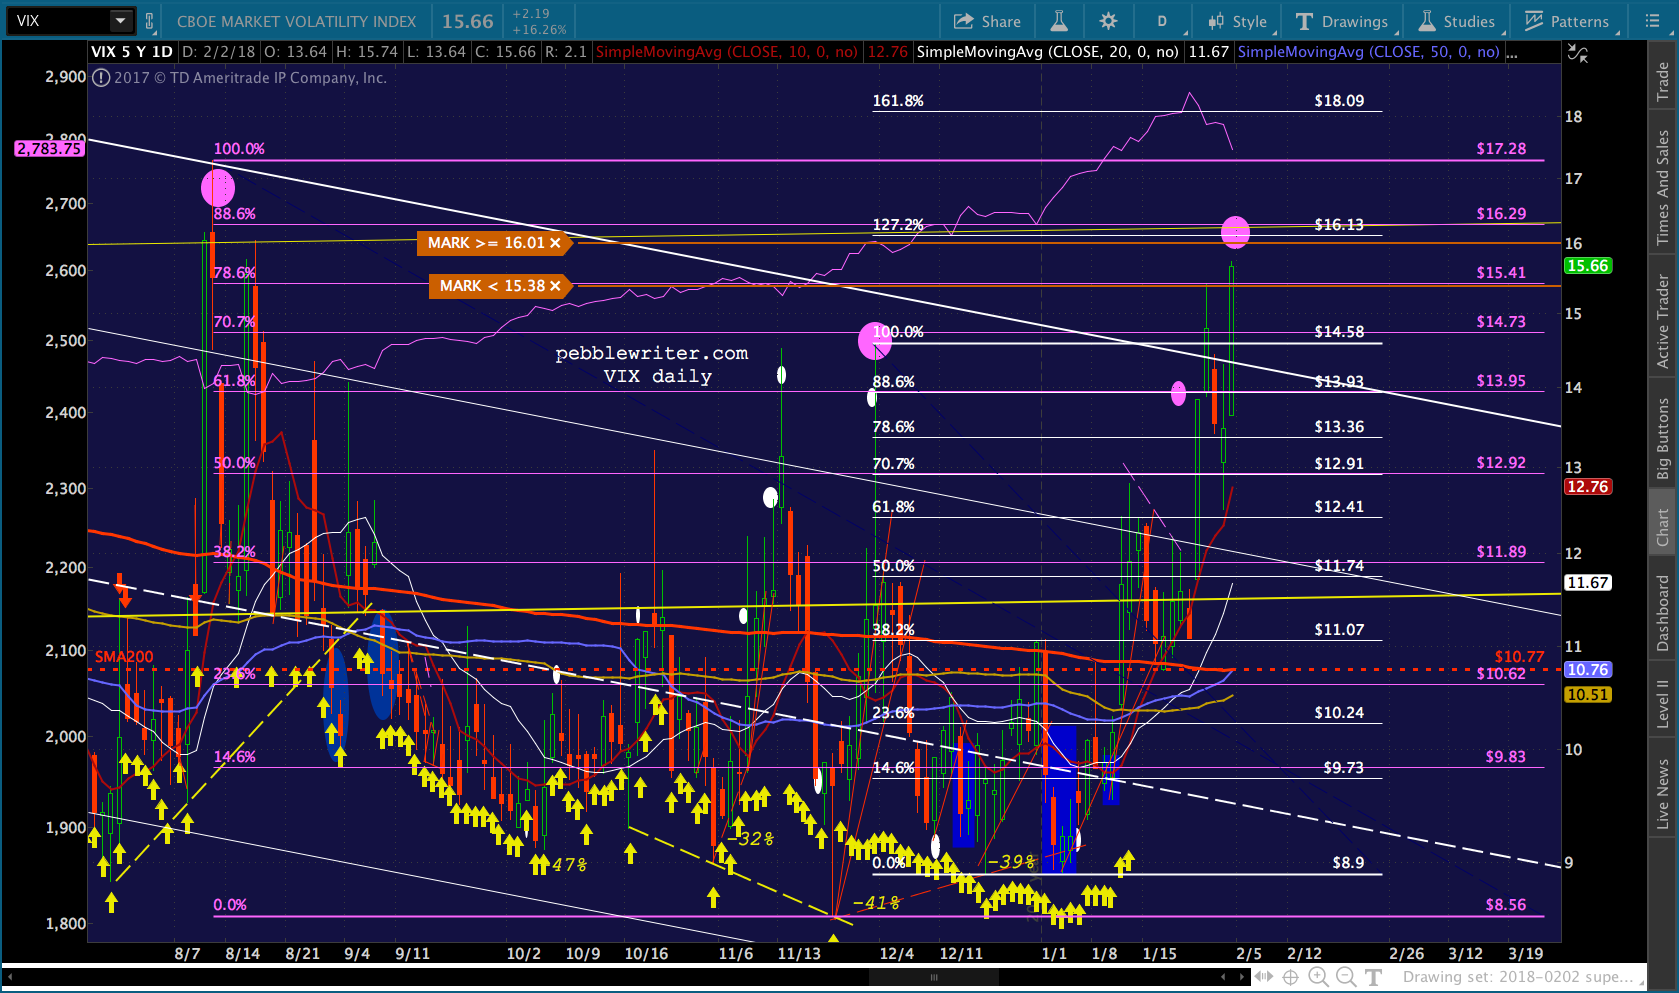
    There are two primary reasons.  The first, of course, is VIX.  Was there a single session this past year when I didn’t bitch about the degree to which timely beatdowns in VIX were triggering algos to bid up stocks?  Doubtful.

    After VIX broke out of the falling channel on Friday, Our charts suggested it would reach 16.29 and, if/when that broke, 25.65. 

    When 25.65 broke, at approximately 11:48 this morning, it triggered an additional wave of selling from those very same algos which have learned so well to take their clues from VIX’s every twitch.  Live by the sword…

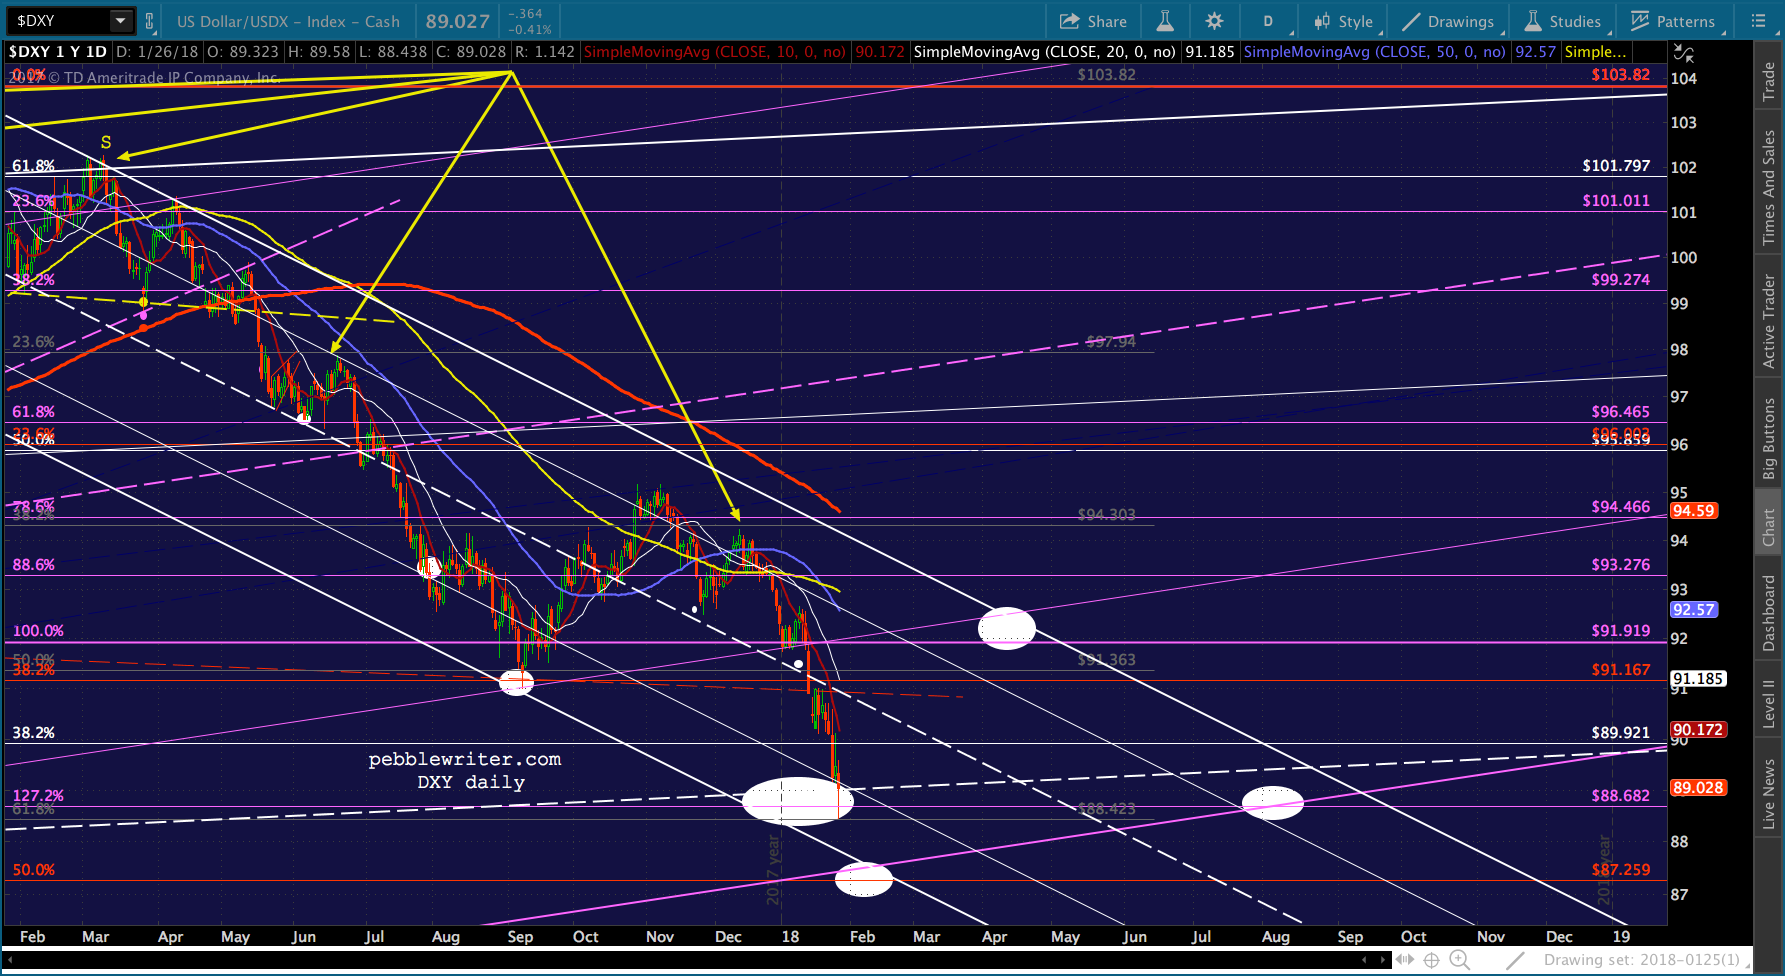
    The second reason was USDJPY and the ubiquitous yen carry trade.  As we noted in our last update [see: Jan 24 Update on USDJPY], the pair reached a channel bottom which represented important support.

    We’ve reached the bottom of the rising white channel which has held on four previous occasions since its origin in late 2012…Bottom line, USDJPY isn’t necessarily done until DXY is done. We had bounces at the .500 and .618, so an overshoot to the .786 at 108.90 or even the .886 at 108.16 is a distinct possibility.

    As it so happens, the white channel bottom didn’t hold.  Despite Kuroda’s desperate jawboning, USDJPY has continued to falter.  It backtested trend line resistance yesterday — all well and good.

    But, instead of catching support as it almost always does, it broke down.  At 11:56, it dropped through a tiny trend line of support.  Seconds later, when that TL broke down……it broke down through a larger TL of support.

    Bottom line, VIX and USDJPY are the two most powerful drivers of algos there are (oil occasionally takes the lead.)  When they were going strong…melt up.  The slightest hint that they’re not…melt down.

    SPX bottomed out yesterday at 2638.17 and closed a good 55 points below the 2.24 Fib.  While it’s always scary to see major Fibonacci support fail, there was an obvious effort to keep the uptrend alive.  Note the SMA100 crosses the bottom of the rising channel which was established with the Feb 11, 2016 lows.  In other words, it’s important.

    Significantly, the channel bottom was defined by the Nov 9, 2016 lows.  If that date sounds familiar, it was the election night in the US.  And, it was the last time a major effort was made to salvage important Fibonacci support. [see: Why the Trump Rally Is a Fraud.]

    It worked spectacularly, resulting in a 38% rally.  All it took was a 17% spike in USDJPY, a 55% rally in oil, and a 63% collapse in VIX.

    How about now?  The algos are primed and conditioned to respond.  I’m sure Jim Bullard still knows his way to Bloomberg’s studios.  Can TPTB manufacture another recovery?  For the answer, we need only to examine two similar, previous meltdowns: the night of the US election in Nov 2016, and August 16, 2007.

    continued for members(more…)

  • The Beat (Down) Goes On

    With VIX finally unshackled from its falling channel, the question of the day is “how bad can this get?”

    It all depends on whether ES or SPX will be in the driver’s seat.  ES closed at our purple TL target, but as we discussed last week, its 2.24 Fib extension is a little lower at 2728.79 — the equivalent of SPX 2730.Now, 2730 isn’t terribly significant on SPX’s chart — a .707 Fib and well above SPX’s 2.24 way down at 2703.62.  So, we have an important conflict.The way this sort of conflict is usually resolved is a bounce at the higher target, followed by a leg lower or…. a nonsensical V-shaped recovery.  Which outcome do the charts suggest?

    continued for members(more…)

  • Are We There Yet?

    Despite yet another ramp job, ES fell overnight to our next downside target at 2797.99.  It is currently holding just below its SMA20, with a very good chance of putting SPX in a position to at least tag its channel midline (2790ish.) This is made possible by TNX which, at 28.43, came within 0.13 of our upside target……and, ZN, which has reached our 120’315 target.One notable holdout in this morning’s TagFest is VIX — which is still languishing below 15.  If our forecast is correct, it has further to go — as do stocks.

    Keep an eye on oil and gas, which are also due for a tumble.

    continued for members

    SPX’s targets from yesterday — the “channel is holding!” headfake.  UPDATE:  10:05 AM

    TNX has reached 28.54 and SPX has reached the white midline.  RB and CL are helping a great deal, though RB is at potential support and ES just reached its gray .786.  We should see a bounce here.Should see a bounce here for RB, at channel support, and CL — to hold the white midline.
    Note that ES still has another 20 points to go in order to reach its channel top backtest at 2773.  Since it and SPX are already down 30 points, I imagine we’ll get a bounce before it plumbs much lower.There is still plenty of dry powder in the form of EURUSD, which is backtesting its neckline after pushing as high as 1.2521 yesterday… …and, DXY, which is pushing up past its white midline.  As we’ve discussed many times, the question is timing.  Will they rip the bandaid off or let things cool down a bit first?UPDATE:  12:00 PM

    I’ve had a lot of charts point to Feb 12 as a potentially important date.  Here’s another one. I believe this bounce is probably going to fail, and we’ll get more downside next week.  For brave souls, I’d consider staying short with relatively tight stops.

    On the assumption that DXY is going to make another dip, I’d also take a chance on GC bouncing here and revert to long.  Probably early, though…The tricky thing is VIX.  If it tags 16.13 today, where does that leave it with respect to an 86+ point drop?  I don’t believe it could accommodate that without blowing out of the falling white channel that it’s already poking out of.  I had assumed it would snap back into it after reaching 16.13.  At this point, that assumption is looking iffy at best.Updates on the rest… Note that USDJPY has bounced back into the rising white channel, but has backtested the red TL connecting recent lows.  For nimble traders, this probably represents interim resistance — especially if DXY is going to complete a trip to 87.26-87.45. UPDATE:  13:23 PM

    A look at the daily chart on VIX.  If we’re going to reach SPX 2703, a breakout in VIX might be just the ticket.  Still, cautious traders might want to either take profits at 16.13-16.24, or at least consider trailing stops.The biggest problem with SPX 2703 is ES 2728.79 — the 2.24 extension of its decline between 2007-2009.  It’s the equivalent of 2729 in SPX — a good 26 points away from Fib support.  Looking at it the other way around, reaching 2703 on SPX would mean 2700 on ES — pretty much no man’s land in terms of Fibs.

    Sure, we could get an overshoot after hours — happens all the time.  Just know that there’s a conflict there.  The easier, safer course for TPTB would be to hold SPX at the white midline — about 2787, or even let it drift down a little lower in order to get the VIX tag before snapping it back above the midline by the EOD.  But, judging from VIX, they might have either misjudged it, or even lost control.

    UPDATE:  2:00 PM

    Keep a close eye on VIX.  I don’t trust it to hold these levels and worry that it’ll retreat to 14.33 into the close in order to close below the channel top — perhaps to pop up to 16.13 on Monday?

    We originally got in at 9.33, so this is a pretty nice 68% gain already — especially since almost all of you got in with options or futures.  At the very least consider some stops.

    UPDATE:  2:24 PM

    Probably a decent place to exit if you’re not planning to hold short over the (long, risky) weekend.  VIX is at 16.21 — right between our two upside targets — and ES just tagged our next downside target.  I’d be right back to short, though on any move through these levels. Though I haven’t mentioned it today, remember that EURUSD and DXY could complete their moves after-hours either today or on Sunday.  VIX also “trades” for 15 minutes after SPX closes. In other words, there’s no guarantee that any of these will have any effect on SPX.  Would it surprise anyone if SPX bounced back to the white midline (2789ish) in the final hour?

    UPDATE:  3:00 PM

    Well, here we go! Just broke below 2770 in ES and SPX with VIX popping above 16.29 (next stop 18.09.) Next support is 2760, followed by ES 2748, 2728, 2712 and 2701.  SPX: 2760, 2749, and 2703.  If 2703 doesn’t hold, things will get very ugly.  The next major support is the SMA100 at 2632, and then the bottom falls out: the SMA200, currently at 2533.

    Trailing stops are strongly advised at 2770ish, as we don’t know when the PPT will cry “uncle.”  If VIX crashes back to 14.30, SPX/ES could backtest 2790.

    Unfortunately, I have to run out for a meeting.  So, I’ll be watching from my laptop.  Best of luck everyone.

    UPDATE:  6:00 PM

    Nice acceleration into the close, but ES stopped at the purple TL — meaning the jury is out on follow through on Monday.  Here’s the picture on SPX…

    We start with the large purple channel from 2009……within which we have the more steeply rising white channel which originated at the 1823 stick save (the 1.272)……within which we had the rising red channel that lifted SPX past the white 2.24 at 2703.  SPX closed Thursday at the bottom of that channel.  It went on to break down today.

    Also breaking down, the white channel midline.  This is important, because the next stop on a drop through a midline — especially after the .786 line is tagged — is usually the .236 line.  In this case, that .236 line just passed through the 2.24 Fib at 2703.Right behind it is the purple channel .786 line that SPX broke above via the red channel.  The purple channel .786 line passes through 2703 next Friday.  And, a falling channel (white) which contains the recent highs and a reasonably significant low intersects with 2703 next Friday.

    Bottom line, a drop to 2703 would backtest the 2.24, the bottom of the falling white channel, the purple channel .786 line and the white channel .236 line.  That’s a lot of support.  The only problem with that scenario, as we discussed earlier, is that 2703 on SPX would mean a drop through ES’ 2.24 at 2728.

    So many times, ES takes precedent over SPX — especially when it reaches support ahead of SPX.  If we get capitulation, ES’ SMA200 is around 2532, roughly in line with SPX.  Unless VIX reverses immediately, I’d say that’s a very good possibility.


  • The End is (Probably) Near

    Rarely, do multiple charts point to the exact same outcome.  When they do, I pay strict attention as it means something big is about to happen.  And, more often than not, it flies in the face of the conclusions one might draw from fundamental research.

    Such is the case with the US dollar and a handful of related charts: the DXY, EURUSD, interest rates and gold.

    The falling US dollar has been in the news almost daily, as a series of FOMC rate hikes have done nothing to prop it up.  In fact, the past year’s hikes have done a great job of signaling further declines — a point we made just last month [see: Will the FOMC Minutes Save the Dollar?]

    With more hikes presumably on the way (the Atlanta Fed just raised their Q1 GDPNow forecast to 5.4%), one might assume the dollar might continue falling.

    Equally newsworthy, these days, is the meltup in interest rates.  I’ve seen numerous warnings of rates spiraling out of control should the 10-yr top 2.5%, 2.65%, 2.75%, etc.  While it’s true that TNX popped up past a long-term trend line in January, it wasn’t the line that mattered.

    Here’s how I see it playing out.


    10-YR Note Yields (TNX):

    Some would argue higher rates are a good sign of a rebounding economy and surging confidence.  I would agree, if the US weren’t on the hook for $21 trillion (a multiple of that if we count the off-book liabilities.)

    Here are the trend lines that got everyone’s knickers in a knot.  Don’t get me wrong.  I like trend lines.  They’re usually very important.  But, I think there’s more going on here than just trend lines.

    I see TNX running out of juice around 2.856 — the .382 Fib retracement of the drop from 53.16 to 13.36 where it intersects with a channel line from prior to 2000.  It might seem somewhat arbitrary, but will hopefully seem less so after we look at DXY and ZN.

    Note that the midline of a rising channel (red) also passes through this same level.  This is a bit of a cheat, since the channel broke down in early 2016.  But, it broke down for a reason, and has since respected that midline.

    If I’m wrong and TNX rises through 28.56, the next more serious resistance isn’t until 36.50.  But, I think it’s much more likely we get a significant reversal here.As an aside, note that each plunge in 10-yr rates corresponded with a plunge in stock prices…except one: the 2014 decline (purple arrow.)

    This particular plunge was offset by a critical breakout in USDJPY (in service of the yen carry trade) and allowed SPX to break out past resistance for a 14.8% gain. And, while we’re looking at USDJPY, note that it recently reached important support at the bottom of the steeply rising white channel. In fact, it has dipped slightly below the channel bottom. It’s as strong an argument as I can think of for the US dollar to bounce here. Look for the BoJ to go for broke with its next iteration of QQE.


    10-YR Note Prices (ZN):

    This one is fairly clear cut in the near-term, but less so further out due to an overshoot in 2011-2012 (when USDJPY plummeted in the wake of Fukushima.)  The key chart pattern here is the (slightly) falling white channel which intersects with the rising white channel .236 line at 120’315ish.The only hitch with this chart is that the yellow channel originally suggested by the 2012 highs would result in a midline that makes no sense at all.  If we write off the yellow channel and go with the white one (which features a well-placed midline supporting ZN between Sep 2013 – Nov 2016) then we end up with a three way intersection right at 120’315.With any luck, ZN will tag that level at about the same time TNX is tagging 28.56.  If I’m wrong, we should know it pretty quickly and can then set our sights on the bottom of the yellow channel, probably much later in the year at 119’180.


    EURUSD:

    Though the yen is more important to equity prices, the euro is more important to the US dollar.  The EURUSD just poked through the neckline of a huge Head & Shoulders Pattern, but is running into the top of a large falling channel (in red) that dates back to 2008 as well as a key Fib level at 1.2597.  It wasn’t initially clear whether or not the pair would wait for the Fib and the channel top to intersect with the neckline.  So, while I’m fairly confident in the price, I’ve been uncertain about the timing.

    If DXY drops through 88.423, then we can safely assume the tag is imminent.


    The Dollar Index (DXY):

    DXY ties it all together in a nice, neat bow.  It fell from 2001 to 2008, and has since been in a rising white channel.  Following Fukushima, however, DXY fell enough to establish another rising channel, shown below in purple.  That channel has determined almost all of the important highs and lows since April 2011.  Though, between Apr 2014 and Apr 2017, an important trend line (purple, dashed) took over.  When that trend line broke down last April, it signaled the 11% drop we’ve seen over the past 9 months.

    Last May, it wasn’t clear whether the white midline would hold.  But, it was important enough to serve as a downside target [see: Update on US Dollar, May 1, 2017.]

    If the purple midline breaks down, the next major support isn’t until 91 in early September and 87-88 as early as the end of the year.

    This past Friday, DXY dropped through the white midline, came within .015 of a key Fib level, then popped back above it.  It seemed as though the purple channel bottom tag might have to wait [see: US Dollar: Capitulation?]

    Today, it dropped back down through the midline at the very same time that TNX and EURUSD moved up through their necklines and ZN started dropping like a rock.

    To make things interesting, gold is even creeping higher after a breakdown of its rising channel from December. There’s no guarantee, of course, that DXY will bounce at the support offered at 87.259-87.365.  There’s also no guarantee that the 10-YR will run out of steam or that EURUSD will reverse.  But, I’m pretty sure that gold won’t be allowed to rise above 1380 — the neckline of an Inverted Head & Shoulders Pattern dating back to Sep 2013 that points to 1720.

    The folks pulling the levers on the markets are very good.  But, they’re not perfect.  If I’m wrong about all the above, it would mean that DXY, TNX, ZN and GC all have much further to go.  It might also mean that the Fed has lost control.  Higher inflation and interest rates could dominate the investment landscape for many months, if not years.

    Stay tuned.


  • Güten Tag

    ES just tagged our next downside target of 2810.98 — a good tag, if you’ll pardon the bilingual pun.  It came within 3 points yesterday before a sudden VIX beatdown and rally in oil sent it soaring 24 points into the close — par for the course for this “market.”

    Recall from last week’s US Dollar: Capitulation that we listed 2810 and the bottom of the rising red channel at 2788 as targets.

    ES continues to hold the white channel bottom as it backtests the red channel top. If it breaks down, there’s support at the SMA10 at 2810.60 and the red channel bottom around 2788.

    By delaying the mini-correction, ES is able to tag the bottom of the rising red channel at 2810.  Pretty clever.

    If it can hold right here, we should see SPX tag our 2808.16 target.  If the channel bottom doesn’t hold, then the larger white channel midline (2790ish) comes into play.  If the midline doesn’t hold, then watch out below.  The 2.24 at 2703 is in desperate need of a backtest.

    continued for members(more…)

  • FOMC Day: Jan 31, 2018

    Today is the final day of our membership promotion. For a great opportunity to do well by doing good, CLICK HERE.

    *  *  *


    SPX and ES both closed below their SMA10s yesterday — the first time that’s happened in 2018.  Although futures rebounded strongly overnight, the current gain of 9 points is only enough to prompt a backtest on the open for SPX.

    Today should be interesting as we have not only the FOMC rate decision/statement, but pending home sales and EIA inventories.  I’m still looking for overshoots from our currency pairs and DXY, oil and gas are tumbling, and VIX is nearing our next upside target.  All in all, it should be an interesting day.continued for members(more…)

  • Where’s the Bounce?

    If you’re looking for a scapegoat for this morning’s slide, look no further than USDJPY.  After reaching initial channel support on the 24th [see: Jan 24 Update on USDJPY] it slid down for a near tag of the .886 retracement at 108.16.

    Instead of a nice, big bounce back above the channel bottom, however, it appears to be coming back for more.  ES, which finally saw its rising white channel break down yesterday, is not amused.  It has now re-entered the rising red channel from which it broke out on Jan 22.Almost all of our currency pairs, commodities and indices have landed right where we expected. But, they have yet to take the next step.

    After months of almost immediate, V-shaped recoveries, traders might be forgiven for wondering “where’s the bounce?”

    continued for members(more…)

  • Update on VIX: Jan 29, 2018

    VIX just reached 13.84, just a smidge away from our 13.93 target dating back to several weeks ago.  From China: It’s Not Me, It’s You:

    VIX jumped up and tagged its SMA200. For those still sitting with a long position at 9.33, this is the easy money — a second chance for those who wished they’d sold last week. For diehard bears, the most likely upside target is 13.93 (ideally Wednesday, Jan 17) with a reach target of 16.13.

    continued for members(more…)

  • Update on Bonds: Jan 29, 2018

    The good news is that TNX tagged our next upside target this morning — the neckline of a fairly large IH&S Pattern that we first detailed back on Jan 9 [see: China – It’s Not Me, It’s You.]  The bad news is that this isn’t shaping up as a clean reversal.To see why, we must examine DXY — which also isn’t shaping up as a clean reversal.  Recall that DXY tagged our downside target range last Thursday [see: US Dollar – Capitulation.]  It was a precise tag of our range (88.438 versus 88.423-88.682) but it stopped just short of an important channel bottom.

    Likewise, TNX has resistance just overhead that could come into play in (a) an overshoot, (b) a reversal and later thrust higher, or (c) never.  Fortunately, the upside potential from here is relatively limited, enabling traders to get out ahead of it.  Ignoring cries of “the sky is falling” might prove to be the tougher challenge.

    continued for members…
    (more…)

  • Update on Gold: Jan 26, 2018

    If you don’t believe in chart patterns and technical analysis, good luck trading gold.

    GC has been buffeted by bad guys, bullied by Bitcoin, and bolstered by central bankers.  Yet, despite massive manipulation, it has behaved in very predictable ways — though not without plenty of headfakes.

    Most recently, GC popped back above a critical trend line that represented a clear separation of bullish and bearish paths.  The long call was made easier by the USD behaving as expected.  From 1250 to 1365 (yesterday) is a nifty 9.2% gain.  Score one for the chartists.

    continued for members…

    As I noted the past few days, GC is sitting just below the neckline of the huge IH&S that could result in a significant breakout.  The fly in the ointment: I don’t think TPTB will let it break out.  So, you should either take profits here in the 1348-1365 range, or at least set your stops at this level.

    There’s a 50:50 chance that it pops higher, but only if DXY can reach its channel bottom at 87.50ish. Since DXY tagged our 88.423 target earlier today, I suspect it’s due for at least a bounce.

    Therefore, my gut tells me that GC will suffer the same fate as in September, when it reversed at the very same .886 Fib.  If so, look for it to pull back to at least the .236 channel line, currently around 1315, with secondary support at the rapidly rising SMA50/SMA100 (1295).Stay tuned.