Author: pebblewriter

  • Oil & Gas: The Payoff

    For months, I’ve been pounding the table on oil and gas being overpriced.  Algos have relied heavily on rising oil and gas prices to keep stocks from melting down again.  Central banks, however, could not keep interest rates under control as long as inflation was being driven higher by rising oil and gas prices.

    A few of our recent missives:

    Between Iraq and a Hard Place
    Oil & Gas, Inflation and Interest Rates: A Delicate Balance or Goal Seeking?
    Oil & Gas: Important Role Players
    Oil: Stocks’ Co-Pilot

    Our premise has been that oil and gas prices, which have ignored supply and demand-based pricing on countless occasions in the past, would be driven lower out of necessity.

    With May’s CPI data about to written into the history books, we’re finally seeing the payoff from that stance.  Gas has tagged our initial downside target from May 21 [see: Once More, With Feeling], with oil close behind.To make matters even tougher on stocks, Italy is (again) not quite as fixed as the Masters of the Universe would like folks to believe.  This has driven the euro progressively lower……and opened the door for the interest rate decline we’ve been expecting.
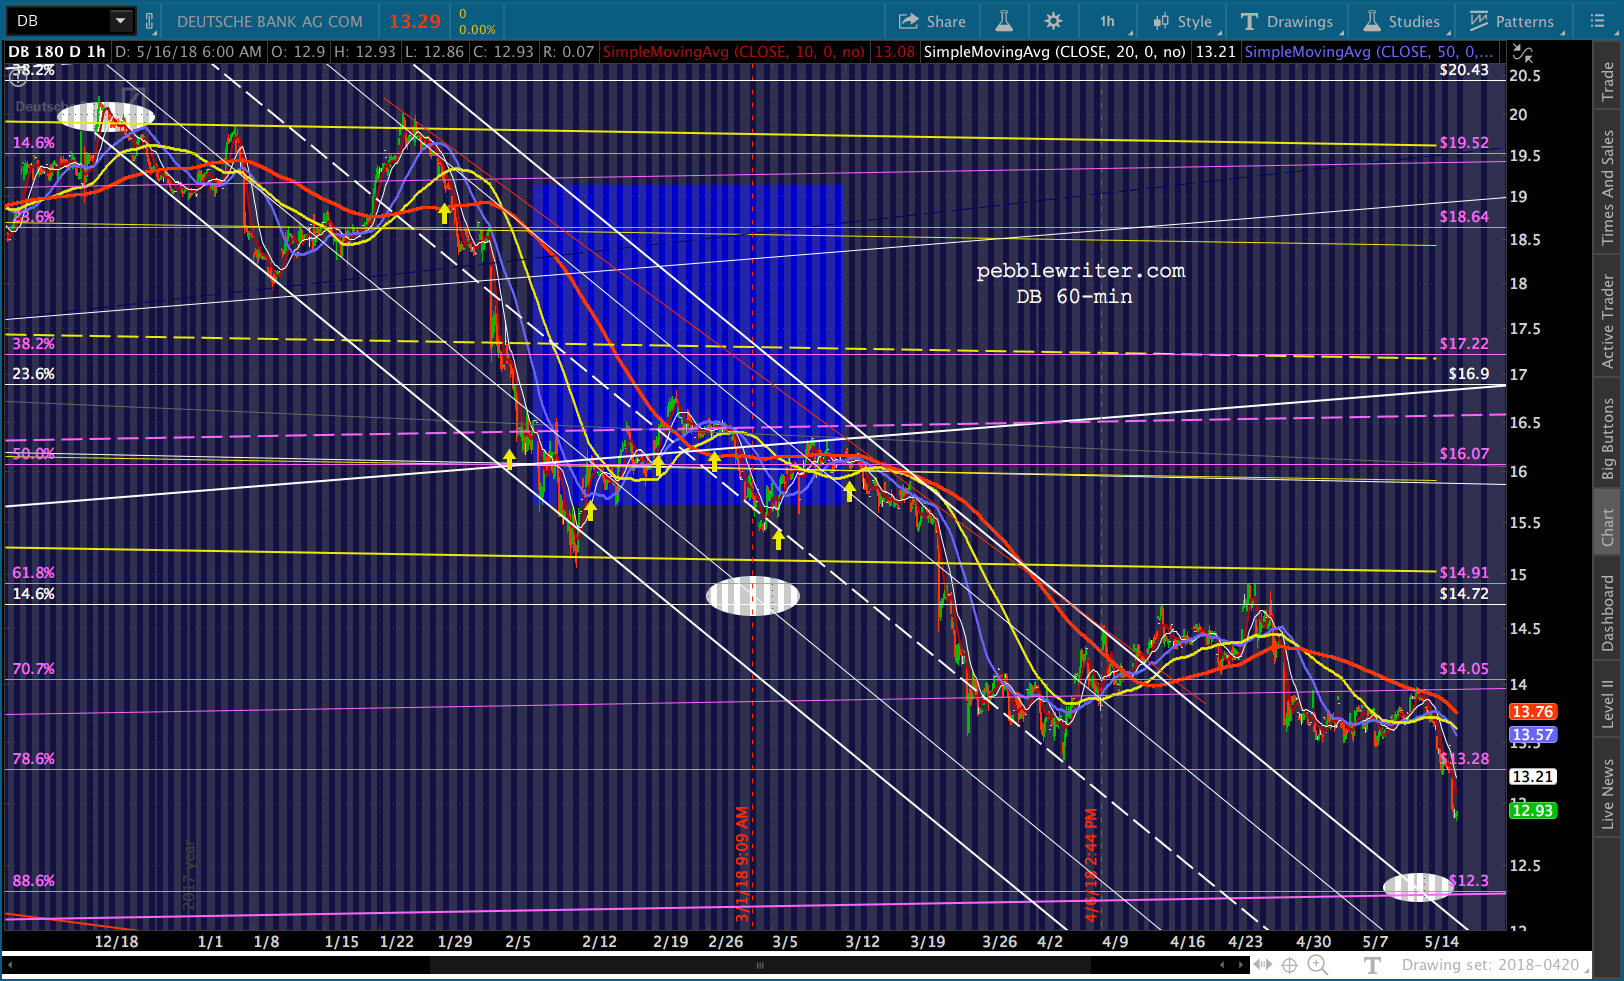
It even made it possible for DB’s next downside target to be tagged.The big question this morning: can the damage be contained, or is SPX’s 2703 support in jeopardy again?

    continued for members(more…)

  • Deutsche Bank: On the Ropes

    In Sep 2016, a hedge fund client asked for my take on Deutsche Bank [DB.] The stock had broken down and fallen 33% in three months.  Priced at around 11.23, they were considering shorting it.

    A few hours later, it became apparent to me that DB was not only not a good short, but was a strong buy.  Somewhat skeptical, they thanked me and authorized the publishing of my work on our website [see: Deutsche Bank: Will it Survive?]

    Deutsche Bank: Charting Bliss

    As it turned out, DB bottomed out two days later at 11.19 and began a very nice bounce, tagging successive upside targets over the next four months.  [see: Deutsche Bank: Another Pause or More?] At that point, it seemed vulnerable to me.  I set some downside targets and pretty much forgot about it for a while.  My client had lost interest, and I was on to more interesting issues.

    It was probably just as well, because after reaching our 20.43 upside target DB entered an extended period of chop, gaining and losing 20% over and over again.

    My interest was piqued again in the midst of the market meltdown this past February.  With $40 trillion in derivatives (in 100 euro banknotes laid end-to-end, it would nearly reach Mars), I wondered how Deutsche was faring.  With the stock at 16.13, I posted three downside targets of 14.91, 14.72 and 12.30 [see: What is Deutsche Bank Trying to Tell Us?]

    And, if things go badly after Apr 3, then the red channel would break down and open the door to 12.30 – another 24% drop from current levels.

    Yesterday, DB reached the lowest of the three, capping off a tidy 150% return over the past 20 months and again raising the question: will Deutsche Bank survive?

    continued for members(more…)

  • Why the Market Will Crater…and, Why it Won’t

    Once upon a time (1896), there was an index of 30 industrial stocks. It included such household names as the American Cotton Oil Company, the National Lead Company, and the US Rubber Company.  Since then, the components have changed 51 times.

    Today, it contains many non-industrial companies such as Disney, Intel, Goldman Sachs and Apple.  It’s price weighted, so only high-priced, high-flying stocks need apply.  Losers are quickly jettisoned — which is why the only original cast member, GE, might get kicked to the curb if it doesn’t shape up soon.

    Because the Dow can be reconfigured whenever need be, it often outperforms broader indices — making it a favorite of the cheerleading financial press.  Plus, it just sounds more bitchin’ to say “the Dow is up 300 points” than “the S&P is up 20 points.”

    Because of its increased visibility, the Dow serves as a bell cow — the one everyone focuses on to get a handle on market health.  So, it’s a big deal when it makes major moves: breakouts, breakdowns and reversals.  Looking at the weekly chart below, we see plenty of each.Not to get into the weeds, but the Dow broke out of the rising red channel and above its 1.272 Fib extension — which would have been a natural turning point — back in 2014.  It struggled a bit, as the S&P completed a huge Butterfly Pattern and reversed in 2015.

    But, after a couple of years of consolidation, it was off to the races — slicing through its 1.618 extension like nobody’s business.  When it popped through the 2.24 Fib at 23781, it also broke out of a Rising Wedge — a very, very bullish thing to do.  It only ran out of gas when it reached the 2.618 Fib at 26702 in January.Since then, it has not only been fighting to remain above the 2.24 Fib and its 200-day moving average, but it has been struggling to remain “broken out” of the purple Rising Wedge.It has had much help over the past few years.  We’ve documented the various machinations at play in Nov-Dec 2016 that rescued the market from the US election night near-disaster [see: Why the Trump Rally is a Fraud.]   But, the early 2018 spike through resistance was no less impressive.

    In addition to VIX plumbing new lows on a daily basis, that’s when oil and gas broke out of long-standing channels.  The algos which account for the lion’s share of volume these days aren’t picky.  But, the oil and gas breakout was manna from heaven.It drove the Dow through that 2.24 Fib and up to its 2.618.  At the same time, the inflation implications sent interest rates soaring and bolstered the dollar at a time when it really needed a lift.But, as we’ve discussed ad nauseum, there is such thing as too much of a good thing.  Interest rates above 3% rightly scare folks who worry about balancing budgets and overleveraged families, corporations and governments.  A quick glance at the latest economic data tells the story.  We delved into the interplay in detail in Oil & Gas, Inflation and Interest Rates: A Delicate Balance or Goal Seeking?.

    For the past few months, our premise has been that the economic powers-that-be would not allow the oil and gas rally to continue.  At some point, the interest rate pain would become too much and we’d see a correction that would bring CPI back down to 2%ish.  It appears to finally be under way.

    The previous instances of CL or RB dropping through important trend lines of support and short-term moving averages sent stocks scurrying for shelter — i.e. the case for stocks cratering.  The extent of this drop will surprise traders, who are overwhelmingly long.

    But, I would be remiss if I didn’t remind members that VIX is sitting right at important support – the top of the purple channel which marked all of its important tops (market bottoms – aka stick saves) between Jan 2016 and Jan 2018.

    As such, it is just one good shellacking away from dipping back below the bottom of the long-term yellow channel.  Recall that dipping below this long-term support was a key go-to strategy for driving stocks higher ever since Dec 2016 (the yellow arrows, previously a once-a-year occurrence.)This, of course, is the case for the market not cratering.  If volatility can be (artificially, or otherwise) suppressed during the course of the oil & gas correction, it will go a long way toward supporting stocks.  If things get out of hand, the USDJPY stands ready to spike higher.

    continued for members(more…)

  • Let’s Not and Say We Did

    When the Fed says they’re not particularly concerned about inflation… it’s not because they’re not concerned.  It’s simply that they know the economy cannot function with higher interest rates — not with the level of debt sitting on personal, corporate and government balance sheets.

    They recently started slipping in the word “symmetric” to describe their inflation goal because it will accommodate a rise well above 2%. What this really means is that they failed to address the inflation elephant in the room (looking at you, oil and gas) but explained their inaction as a judgement that inflation isn’t a problem.

    Bond investors are hip to these verbal contortions — meaning TNX has finally broken a minor trend line and can now take a crack at the one from last November.Of course, as rates moderate, so will the dollar — unless an equity selloff driven by falling oil and gas prices keeps it on the rise.Equity selloff?  Not so fast, insists VIX.  For now, at least, the algos are listening.  But, I doubt they’ll be able to ignore the yelps of pain from oil and gas longs.continued for members(more…)

  • What Synchronized Recovery?

    Sometimes, the narrative gets a little ahead of reality.  The latest data out of Japan and the euro area suggest the narrative was on a different planet.It’s been difficult to be patient – waiting for markets to catch down with hard economic data.  But, we got our first taste of reality in quite a while yesterday, with more to come in the days ahead if/when SPX 2703 breaks down.

    So far, “when” has a solid lead on “if”:  USDJPY is tumbling, VIX is on the rise, and oil and gas might have finally lost their momentum.  With Fed minutes coming out later today, will we finally see some acknowledgement of the inflation problem?continued for members(more…)

  • Charts I’m Watching: May 22, 2018

    Yesterday’s near-breakout was tempered by a failure of VIX to break down.  The indecision carried over to this morning, where VIX remains in a consolidation pattern that promises a significant move — one way or the other.

    The major indices are essentially in a holding pattern, which typically indicates a sell-off lies ahead.  Our yield curve indicator is singing the same tune.

    continued for members(more…)

  • Once More, With Feeling

    While SPX has pushed above its 2.24 Fib extension multiple time over the past two months, and has remained safely above the critical support for the past seven sessions.  ES, on the other hand, has really struggled.  Following a failed rally on Mar 21, ES didn’t even tag its (2728.79) again until May 11.  Since then, it has made numerous failed attempts to hold support.

    Will this latest attempt hold?  Or, is it simply the latest effort to stave off a coming decline? Those with razor sharp memories might remember May 21, 2015 was an important day for SPX.

    Keep an eye on the dollar.  If USDJPY — which has nearly reached our upside target — is any guide, it might have run out of steam.

    continued for members

    And, with a little over a week left before May’s CPI is written in stone, it’s time for CL and RB to implode — at least to their initial backtest targets.The lower targets would put CPI back at 2%, but could be a drag on stocks.

    A reversal candle for DXY…

    …and, a failure of VIX to break down yet…

    …means SPX’s pop on the opening might mean a slightly higher high for (ii), but it might not hold.  By all means, play along if it does.  But, I wouldn’t be surprised if it fails.We’re been wondering for a long time whether SPX has been clinging to 2703 in order to mark time.  Today, we should finally get our answer.  The line in the sand for SPX is 2742.10 — the May 14 high.

    It would be much easier to feel confident about the COMP SMA200 dip if there were an obvious point where the SMA200 would intersect with a chart pattern – a channel line, etc.UPDATE:  10:50 AM

    Decision time…  For those who want to take a shot at a downdraft, this is it.  Mind your stops. Obviously, VIX could spoil things for the bears with a drop through the TL. UPDATE:  12:20PM

    So far, so good.  VIX hasn’t broken out, but it got a nice bounce off the red TL. COMP looks very unlikely to break out.SPX is hanging in there, but the .886 is safe for now. And, as an aside, GC has still not broken down.  Should be a safe entry point for those not already long – objective 1380ish with stops around 1250ish.And, as another aside, TSLA is backtesting its neckline. So much negative news on this stock, it’s a wonder it hasn’t deflated already.I have to run out for a meeting.  More later if anything significant pops up.

    GLTA.

    (more…)

  • Bonds and Value

    As the 10-year pushes past 3%, we’re left to wonder whether flows will begin to favor bonds again.  In a world of 2.5% inflation, bonds might seem like a sucker’s bet.  In a world of 8-10% inflation, even more so.Yet, we often buy instruments with little long-term value but plenty of short- or medium-term appreciation potential.  The 10-year is at an important inflection point, poised between a strong rebound and a significant selloff.  Its next moves are critical not only from an investment standpoint, but in terms of what to expect from the broader economy.continued for members(more…)

  • Charts I’m Watching: May 17, 2018

    TNX reached 3.11 this morning, but DXY isn’t buying it.  We asked rhetorically, yesterday, whether “investors algos [will] even care about the stagnation which, abetted by inflation-driven higher interest rates, has ensnared the economy in its razor sharp talons?  Or, will a tumbling ‘risk indicator’ and copious share buybacks be enough to ward off a correction?  …hey, VIX is off 8%! Everything must be awesome!”

    As it turned out, VIX dumped 11.4%, which is all the algos needed to ensure a bounce off the SMA100 and, more importantly, the 2.24 extension at 2703.62.  The game continued overnight.

    With futures off 12 points from yesterday’s highs — about half of the session’s gains – someone decided to dump a boatload of VIX futures — just enough to break VIX’s uptrend and ES’ downtrend.  The timing was perfect.USDJPY, meanwhile, is taking the opportunity to rally on higher interest rates and is nearing our next upside target.  And, RBOB and CL hit new highs.  Are the algos really so easily fooled?  Have carbon-based investors — who have certainly done the math on the economic damage higher rates and rising inflation are already doing — become irrelevant?

    In the midst of VIX dumping and USDJPY, CL and RBOB pumping, futures are still off 4 points.  Perhaps even the algos are tiring of the charade…

    continued for members(more…)

  • No Free Lunch

    While a higher dollar might help mitigate inflation, higher interest rates are starting to bite. Both mortgage refinancing and housing starts and permits tumbled in April.

    Futures tumbled about 5 points on the news.  But, even that was a problem, as SPX is perched precariously atop the critical support of its 2.24 Fib extension at 2703.62 (not exactly a random walk…)It should come as no surprise to readers that VIX has already begun its nosedive.Meanwhile, Deutsche Bank — the third largest bank in the eurozone with $1.8 trillion in assets and $40 trillion in derivatives — continues its meltdown, closing in on our target from Feb 7 [see: What is Deutsche Bank Trying to Tell Us?But, hey, VIX is off 8%!  Everything must be awesome!

    Will investors algos even care about the stagnation which, abetted by inflation-driven higher interest rates, has ensnared the economy in its razor sharp talons?  Or, will a tumbling “risk indicator” and copious share buybacks be enough to ward off a correction?

    continued for members(more…)