

 In Sep 2016, a hedge fund client asked for my take on Deutsche Bank [DB.] The stock had broken down and fallen 33% in three months. Priced at around 11.23, they were considering shorting it.
A few hours later, it became apparent to me that DB was not only not a good short, but was a strong buy. Somewhat skeptical, they thanked me and authorized the publishing of my work on our website [see: Deutsche Bank: Will it Survive?]

As it turned out, DB bottomed out two days later at 11.19 and began a very nice bounce, tagging successive upside targets over the next four months. [see: Deutsche Bank: Another Pause or More?] At that point, it seemed vulnerable to me. I set some downside targets and pretty much forgot about it for a while. My client had lost interest, and I was on to more interesting issues.
It was probably just as well, because after reaching our 20.43 upside target DB entered an extended period of chop, gaining and losing 20% over and over again.

My interest was piqued again in the midst of the market meltdown this past February. With $40 trillion in derivatives (in 100 euro banknotes laid end-to-end, it would nearly reach Mars), I wondered how Deutsche was faring. With the stock at 16.13, I posted three downside targets of 14.91, 14.72 and 12.30 [see: What is Deutsche Bank Trying to Tell Us?]
And, if things go badly after Apr 3, then the red channel would break down and open the door to 12.30 – another 24% drop from current levels.
Yesterday, DB reached the lowest of the three, capping off a tidy 150% return over the past 20 months and again raising the question: will Deutsche Bank survive?
 continued for members…The chart that rules them all is still the weekly. While DB outperformed the rest of its contemporaries during the financial crisis, it lost its mojo in Jan 2013. XLF went on to new highs, while DB put in a triple top that ended abruptly in Jan 2014.
 The giant falling white channel has done a decent job of signaling the big moves. If followed to its logical conclusion, it reaches zero in 2025. But, would the ECB allow the 14th largest bank in the world (3rd in the euro zone) to go under? With $40 trillion in derivatives?
Looking at the weekly chart, we can see that DB had a golden opportunity to backtest the white channel midline at its .618 at 26.14 in March if the market hadn’t broken down in January/February.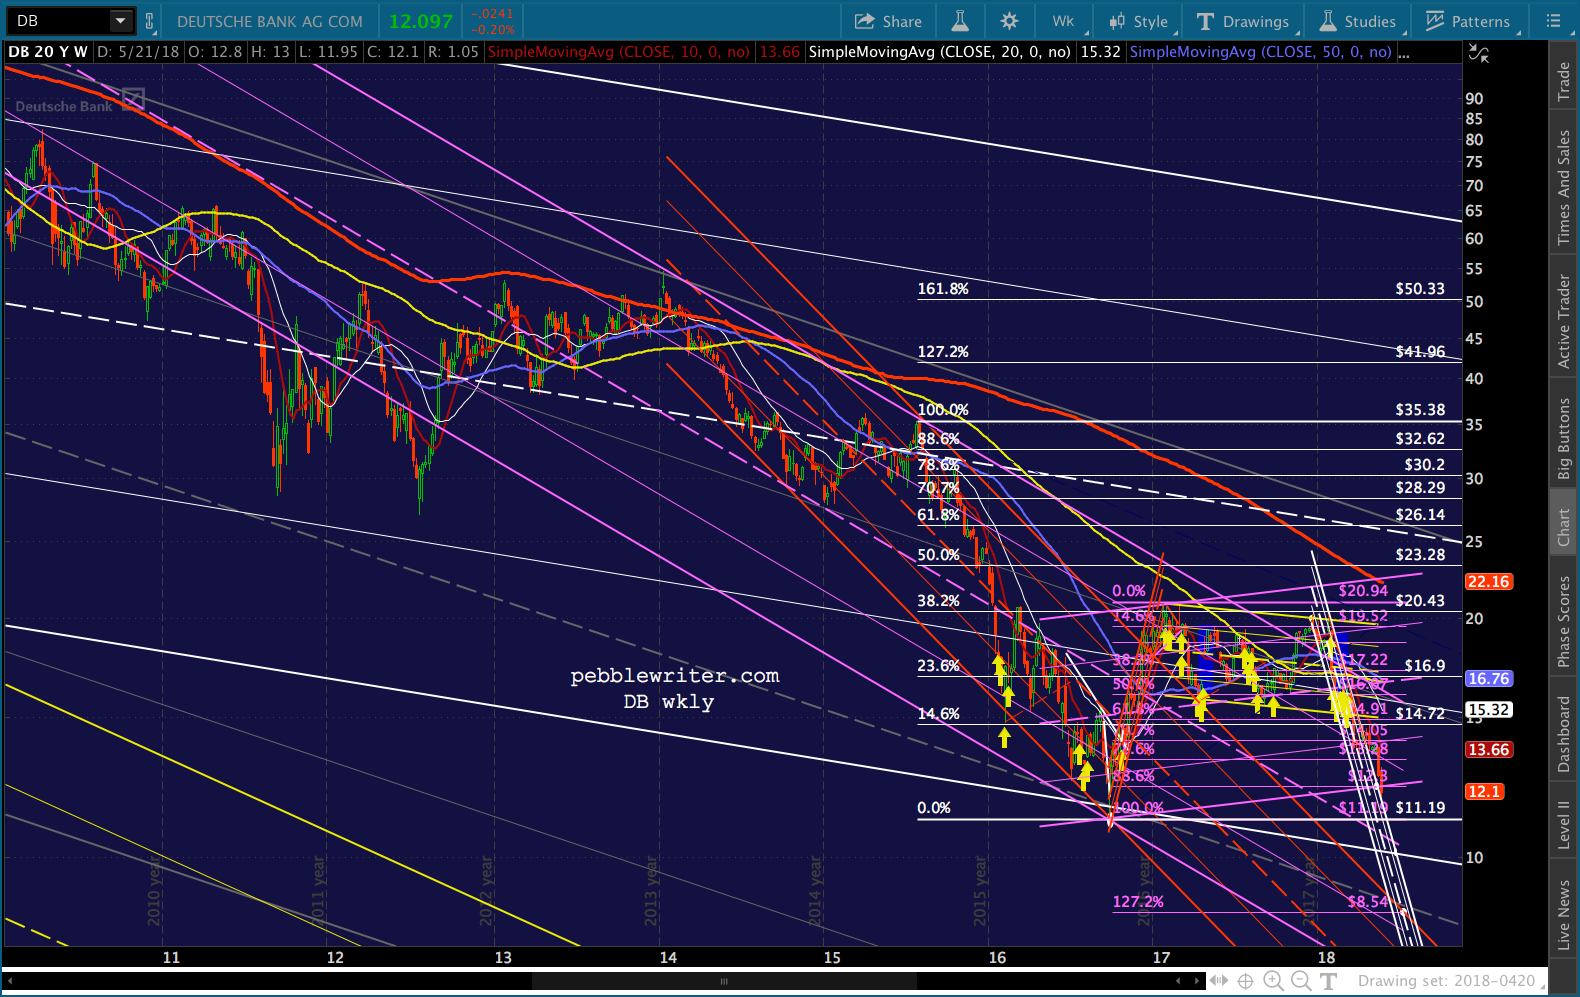 Instead, the Flag Pattern broke down, and DB rode the small, white falling channel for the next four months. It popped out in April, but resumed falling soon after.
Looking at the daily chart, there is Fib and channel support here at 12. It hasn’t truly backtested the falling white channel. And, it clearly overshot the .886 Fib and purple channel bottom.
But, the headlines have been dreadful and DB is no doubt being buffeted by the troubles in Italy, the plunge in oil prices, etc.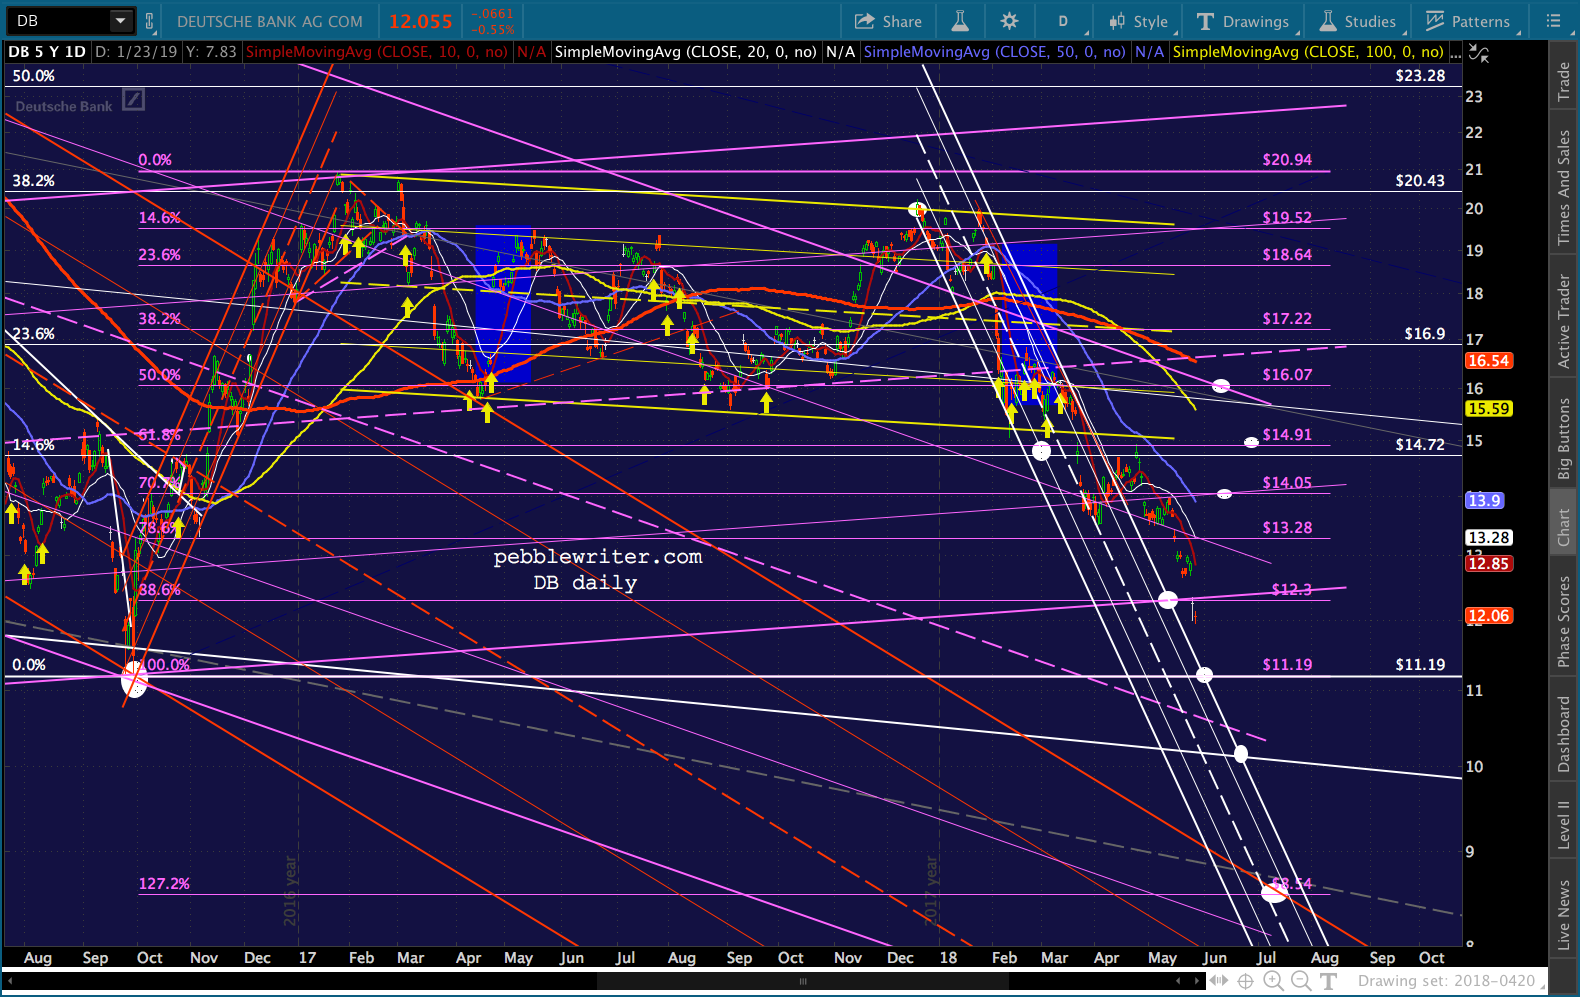 If it bounces back up through 12.30, I’d want to be long for 13.28, 14.05 and 14.91. If it broke back above 14.91, then 16.07 opens up. If it doesn’t bump above 12.30, then the downside targets consist of the former low at 11.19, the white channel bottom at 10.30ish, and — if TSHTF — the 1.272 at 8.54.
Note that 8.54 would mean a disastrous breakdown of the huge falling white channel shown on the weekly chart. No doubt Draghi would “do whatever it takes” to prevent such a breakdown.
To be clear, I’m not impressed by DB’s fundamental upside potential. I think the company is a ticking time bomb — albeit one with a rich uncle Draghi who doesn’t want to see the family embarrassed any more. I’ll trust it if/when it bounces, and would keep tight following stops in place.