I’ve recently discussed this very issue with several friends who are a little nervous about the sharp runup in prices…and very nervous about the prospect of a selloff.
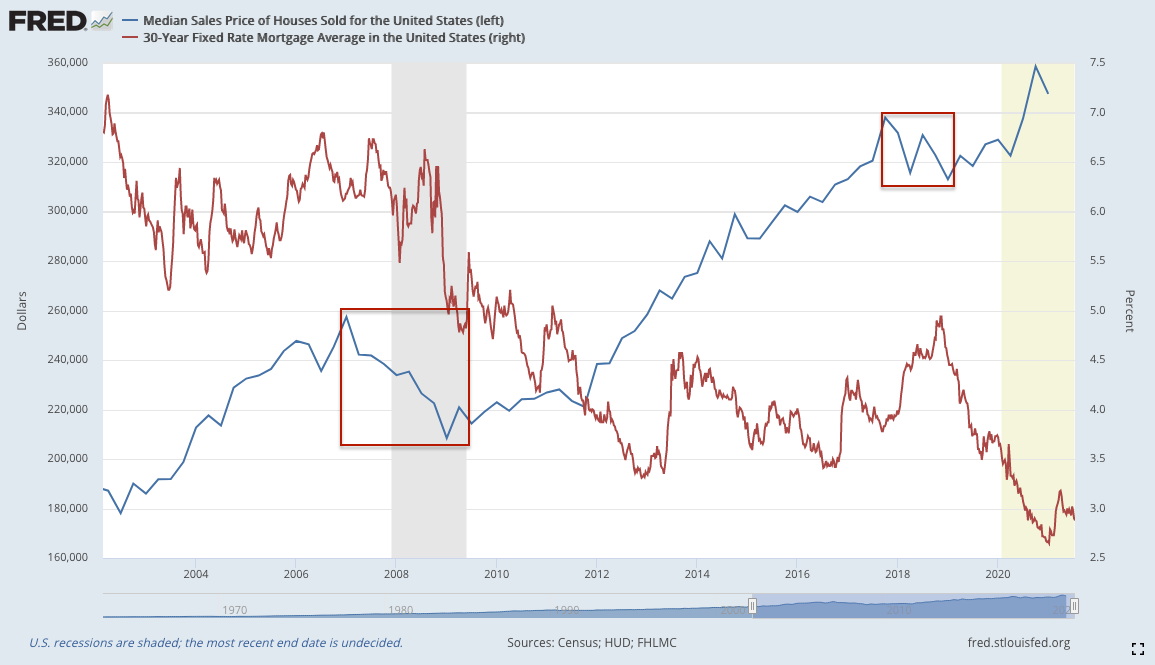
Most of us remember how ugly things got during the Great Financial Crisis: the sharp rise and the much sharper plunge when the bubble burst. According to HUD, the median sales price of a home fell about 20% from $257,400 in Q1:2007 to $208,400 in Q1:2009.  The fallout was both disastrous and widespread. Yet, years later, it appears modest compared to the subsequent reinflation. The median sales price reached $358,700 in Q4:2020.
  It’s the size and speed of the bubble’s reflation that has many worried – particularly given the Fed’s involvement. How so, you ask?
In the wake of the pandemic, the Fed cut short-term rates to zero and began large scale asset purchases which have been more than enough to purchase the entirety of Treasury’s monthly borrowings: $120 billion per month, including $40 billion in mortgages. The net effect was to drive interest rates to all-time lows and keep them there.
 If you’re feeling pretty smart about all the money you’ve made in real estate over the past year, make sure you fire off a thank you note to Jerome Powell.
Most home buyers purchase as much house as their income will allow. That is, they focus more on the monthly payment than the purchase price. Lenders, likewise, use a formula to compare your monthly housing costs to your income.
These debt-to-income ratios vary. But, in this example, we’ll assume a 33% ratio – meaning the total house payment should be no more than 33% of your monthly gross income.
A home purchased for $1 million with a $200,000 down payment at the current jumbo mortgage rate of 2.6% would require a monthly payment of about $3,203. Toss in $1,000 per month for taxes and insurance, and you’d be looking at a total payment of $4,203. With a 33% ratio, the required annual income would be around $152,826.
If mortgage interest rates had been 6% instead of 2.6%, the monthly payment for that same $1 million house would have been much higher: about $5,796, requiring an income of $210,778 to qualify for an $800,000 mortgage.
And, there’s the rub. Cutting rates to all-time lows clearly reinflated real estate prices. People have been able to afford more and more expensive homes because the Fed kept cutting rates, keeping the payments super low even as the prices soared.
What happens if rates ever rise back to normal levels? The chart below shows the relationship between falling rates and rising prices. But, you can read it the other way around too. If rates rose, what would the price need to drop to in order to maintain the same monthly payment?

A rise in rates from 2.6% to 3.6% equates to a price drop from $1 million to $880,000. A rise to 4.6% would mean a drop to $780,000 – enough to wipe out your equity and leave you owing money at the closing.*
The Fed has managed to hold interest rates low by buying up all the bonds it sees. The flood of QE required to suppress rates has bid up not just real estate but most other categories of goods and services as well, thereby amping up the pressure to raise rates.
The Fed could mitigate inflation by raising rates or suppressing oil prices, but either would do some damage to stocks – another overinflated market. So, instead, they keep insisting that everything’s just fine, even as they paint themselves into a corner.
Is it time to sell your home? If you’re planning on it any time soon, consider the above and keep a very close eye on the market and on interest rates. It won’t necessarily happen tomorrow. In fact, sales/prices typically increase in the short run when rates begin to rise because buyers fear even higher mortgage rates to come.
But, spoiler alert: it will happen by this time next year. The Fed is playing a dangerous game – not because they love taking enormous risks but because, having reinflated all these bubbles, they have no other choice.
 We all remember what happened the last time inflation reached these levels. From the July 2008 FOMC statement to Congress, the only time in the past 30 years that CPI has topped last month’s 5.4%:
According to these projections, the economy is expected to expand slowly over the rest of this year. FOMC participants anticipate a gradual strengthening of economic growth over coming quarters as the lagged effects of past monetary policy actions, amid gradually improving financial market conditions, begin to provide additional lift to spending and as housing activity begins to stabilize.
Stocks crashed 50% over the next 8 months as the Great Financial Crisis decimated the economy.
* * *
* the spreadsheet below shows the effect on price of a change in mortgage rates, while holding payment and qualifying income steady.


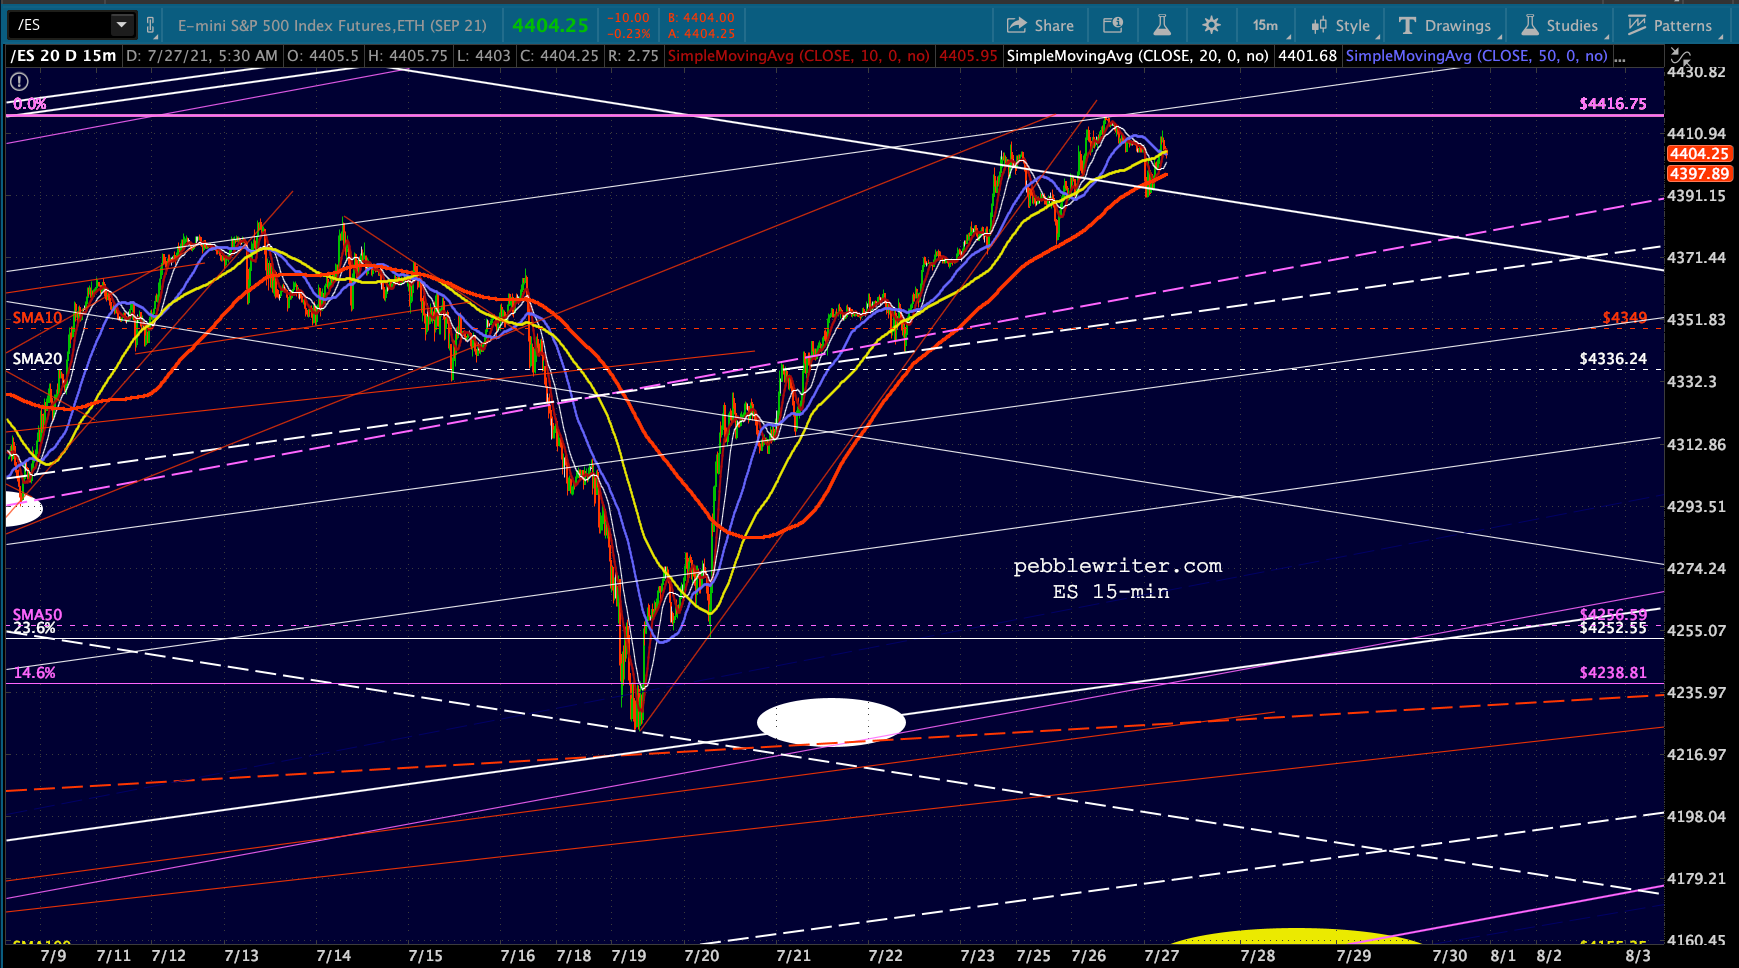
 Our targets for equities, oil and gas, and currencies remain unchanged.