

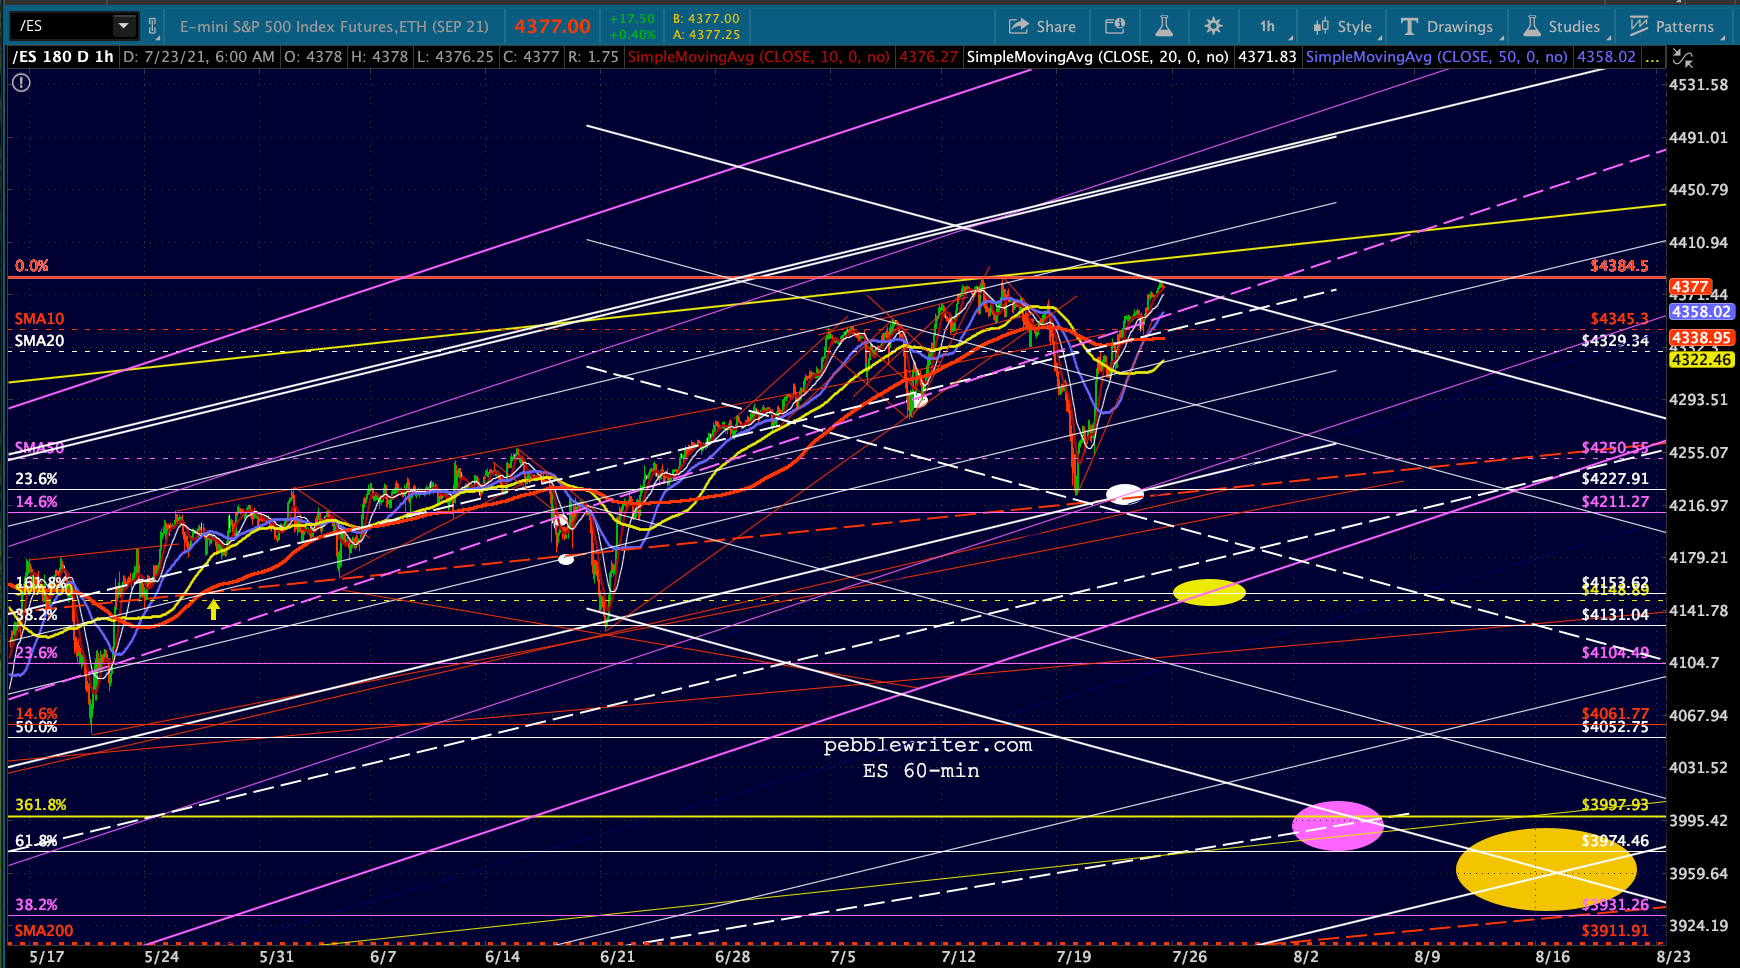
It’s not unusual to see a very deep, extended backtest prior to a selloff. In the old days, we would attribute this to malevolent market makers who wanted to flush out weak shorts before cashing in.  The same thing happens these days, though it is typically perpetrated by algorithms and HFTs. As we discussed yesterday, we have an example of just such a maneuver in the recent past which serves as a good guide as to what to expect over the next 3 weeks. Like all analogs, it has the potential to pay off nicely for traders.
continued for members…
The downside scenario is unchanged for both SPX and ES. Note that ES’ 3.618 is slightly lower than SPX’s, so I assume it will dip below its 3.618 and tag its SMA200 which is at about the same level.
 VIX hasn’t yet broken down, but note that the 10/20 alignment is still bearish for stocks.
  SPX’s SMA200 is now about 32 points below its 3.618 Fib extension at 3956.64 – which would be a 9.95% correction from the 4393.68 highs. While no guarantee that TPTB have such a scenario in mind, we have had many corrections over the last 10 years which were almost exactly 10%.
I’m currently looking at the 2018 correction as an analog for what might happen here. But, that was an example of what could go right as well as what could go wrong. If deliberate, it was poorly planned. The Mar-Apr backtests of the SMA200 dropped through the 2.24 and the Oct backtest of the 2.24 dropped through the SMA200.
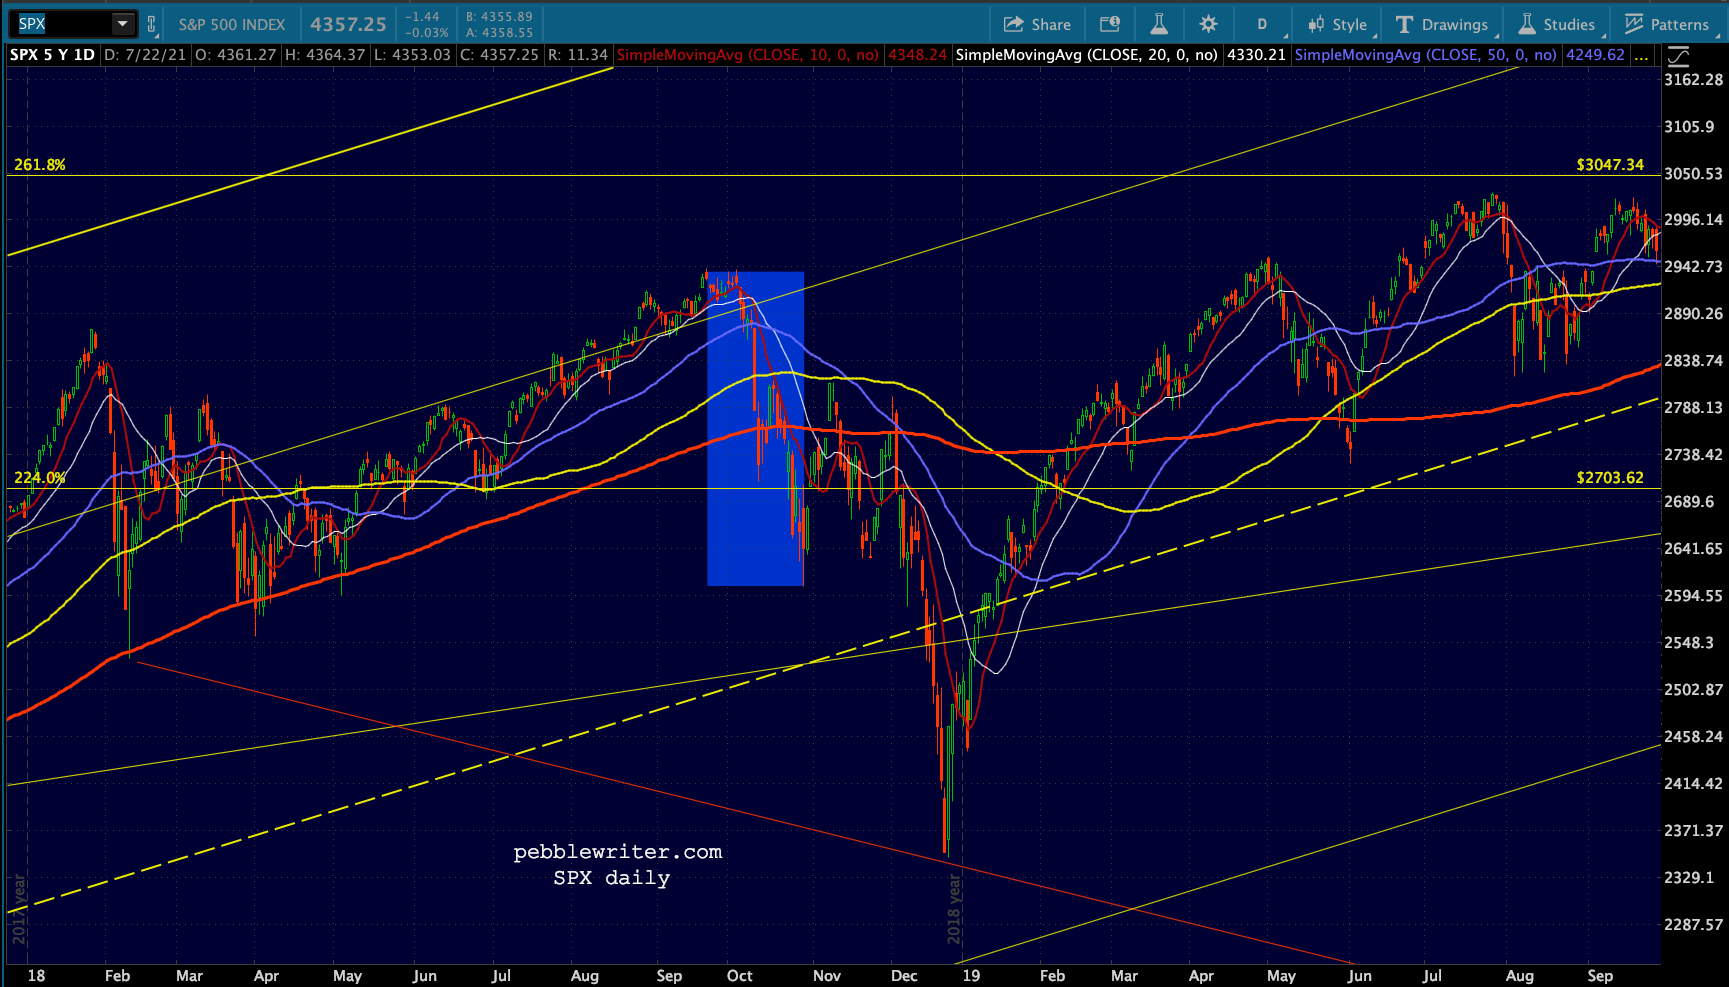 Another example was the 2014-16 backtests of the 1.272 Fib extension at 1823. When the SMA200 passed through 1823 in June 2014, SPX was only 7.3% above it. By the time SPX was nearly 10% above 1823 in September, it had to drop through the SMA200 in order to backtest 1823 for a 9.7% drop.
The 11.8% Feb 2018 correction was likewise poorly planned. A backtest of the SMA200 sent it through the 2.24 Fib, which resulted in many months of struggling to get back above it and stay above it – setting up the 20% Sep-Dec correction.
 This time, TPTB will have the opportunity to backtest both an important Fib and the SMA200 in one fell swoop (one swell foop?) Eagle-eyed readers might recognize an example of another such attempt that didn’t go terribly well.
On Feb 19, 2020, SPX reached 3393.52 – 10.2% above the 2.618 Fib extension (ES was 9.4% above its.) SPX’s SMA200 intersected the 2.618 on 2/27 – six sessions later. Had it been able to hold both, it would have been a modest correction – notable, but quickly forgotten – instead of a 35% crash.
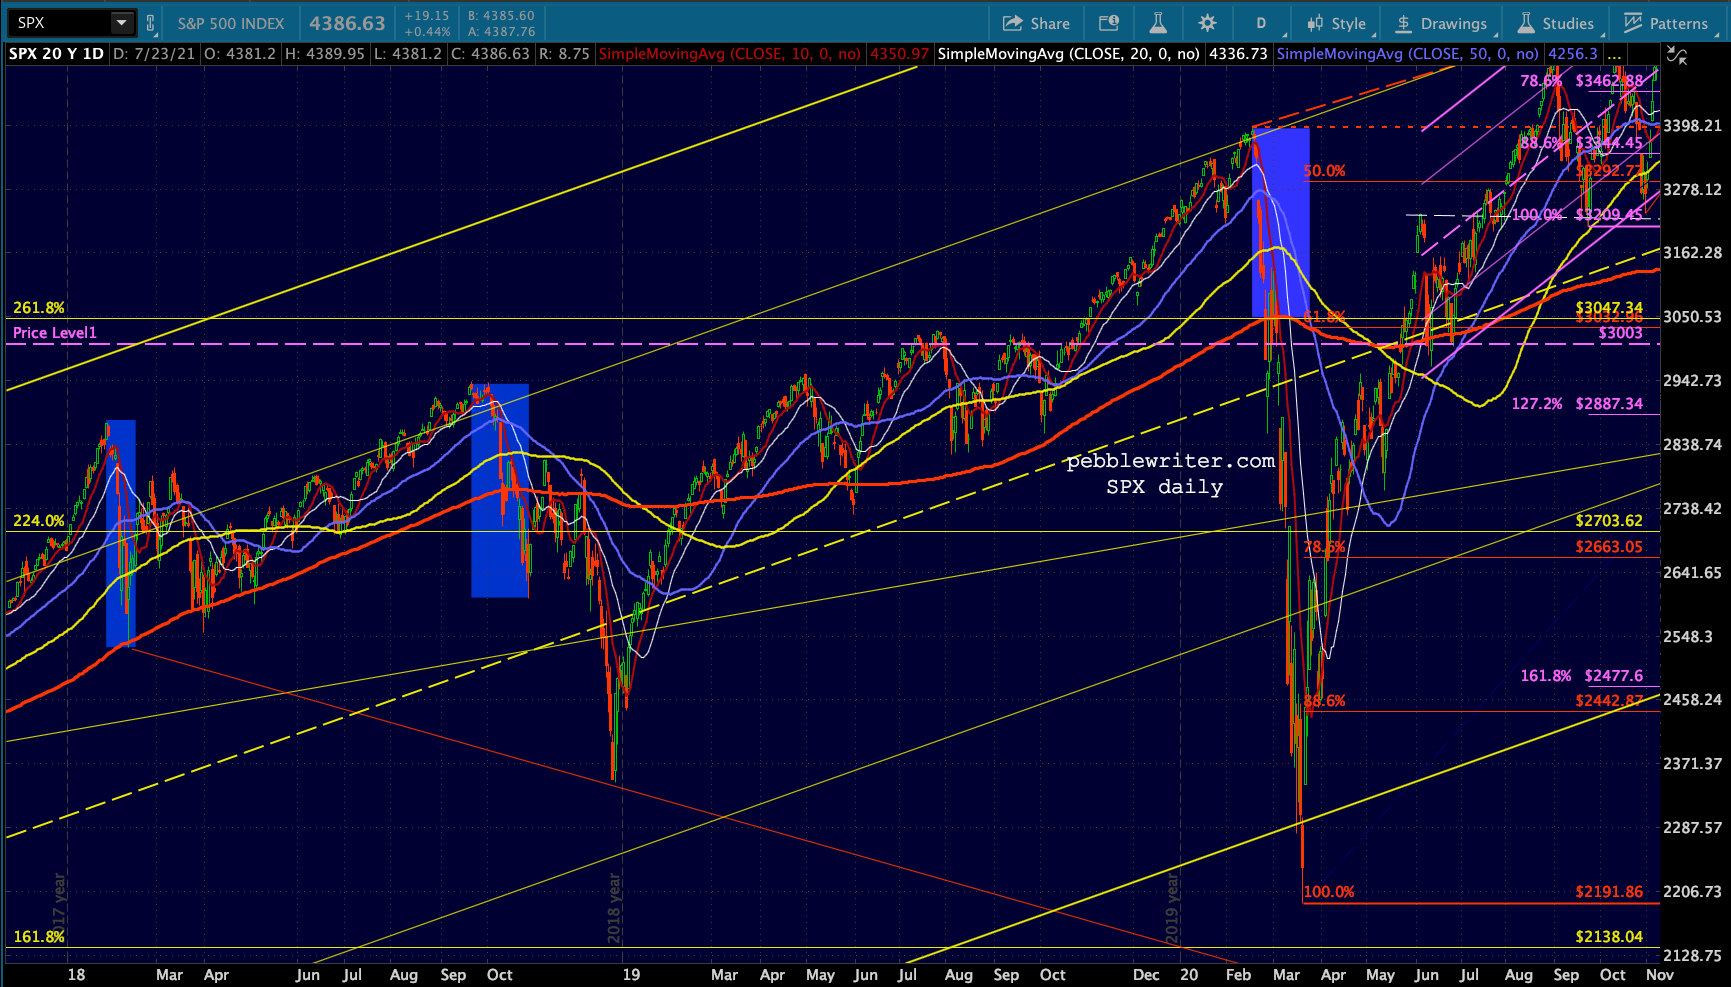 Could that have been the objective? Absolutely. Consider how much time SPX spent in the vicinity of 3385.93 – the level from which a drop to 3047.34 would have resulted in exactly a 10% correction. The last minute push above it was a nice head fake, sure to have sucked a few investors.
 Obviously, the emergence of the coronavirus and COVID-19 was unbelievably important. This was the week that it finally grabbed widespread attention in the US – made more so by the market’s crash.
We should be cautious about equating that news with more recent news regarding the Delta variant’s spread. Yet, the news out of Israel that the Pfizer vaccine is perhaps only 40% effective against the Delta variant is quite concerning – particularly since the variant is supposedly 1,000 more contagious.
Setting aside the fundamental questions for the moment, let’s examine some similarities. In Feb 2020, SPX was sporting very negative divergence.
 The same thing is happening this time, except that RSI also has overhead TL resistance.
 Let’s look at factors. In Feb 2020, CL – which had played a big role in pushing CPI back above 2% YoY and nearly 0.4% MoM in January –

 – had reversed from January’s breakout and had actually broken down. As stocks were peaking on Feb 19, CL was backtesting the red flag channel midline and a TL off its Feb 2016 lows.
 It’s in a somewhat similar position now – having broken down below the white TL and backtesting it.
 It is also at the top of the falling purple channel with inflation very much a problem to most observers. I have posited for the past month or so that it has finally run out of steam and will likely pull back in order to facilitate a drop in CPI.
I suspect the red midline around 57.30-57.50 should do the job, but need to run some more calculations (which have become much more complicated since price and labor inflation have become much more widespread.)

Bottom line, I would continue to be short CL. The initial targets of 68.87 and 65 provided a bounce, but I believe the SMA200 at with targets of
USDJPY is also in a somewhat similar situation. In Feb 2020, it had poked above the top of the falling purple channel – an apparent breakout. It has broken out again, much more aggressively this time.
 While CL and USDJPY could both support stocks when the time comes, a spike in USDJPY has few repercussions. In fact, a stronger dollar would moderate inflation. The only trick is convincing the market not to pull money back into the yen as stocks begin selling off.
That’s why the purple channel top deserves our close attention. A drop through it (yen strength) would be a good signal that an officially sanctioned selloff is underway. The SMA200 at the white .500 or the rising purple channel bottom at 105.60ish are the most obvious support for a bounce.
If, on the other hand, USDJPY can hold the channel top, then it has the potential to help prevent stocks from being creamed in the first place. This makes a good deal of sense to me, especially since CL’s decline could set off a correction in stocks all by itself.
stay tuned…