

ES tagged our first downside target two sessions ahead of schedule yesterday. As my good friend (and brilliant trader) Ed put it…
 All of our charts remain on track.
 The algos are trying to make up their “minds.” Is this one of those quick plunges which will be followed by an even quicker recovery, or is there more turbulence ahead?
I suspect most will be surprised.
continued for members…
The bigger picture for ES and SPX… I’m sticking to the 3.618 target as the next major objective, though the timing is still a little unclear.


 Naturally, VIX is clinging to its SMA200 – with all the attendant control issues that entails. As of right now, it’s above the SMA200 – suggesting more downside ahead. Note that it needn’t break out as long as the other drivers carry the bears’ water.
 For instance: the bond market. TNX has plunged below the yellow midline, suggesting that our 8.14 target is very much live. This would no doubt freak out the bulls.
 This is a very big deal as it violates two midlines including the uber important yellow one…
 …that goes back at least as far as my charting software.
 And it opens up a backtest at 144’195 for ZN – also a positive sign for GC.
 Remember what happened to stocks the last time ZN broke out above a channel top (the yellow arrrow) in Feb 2020.
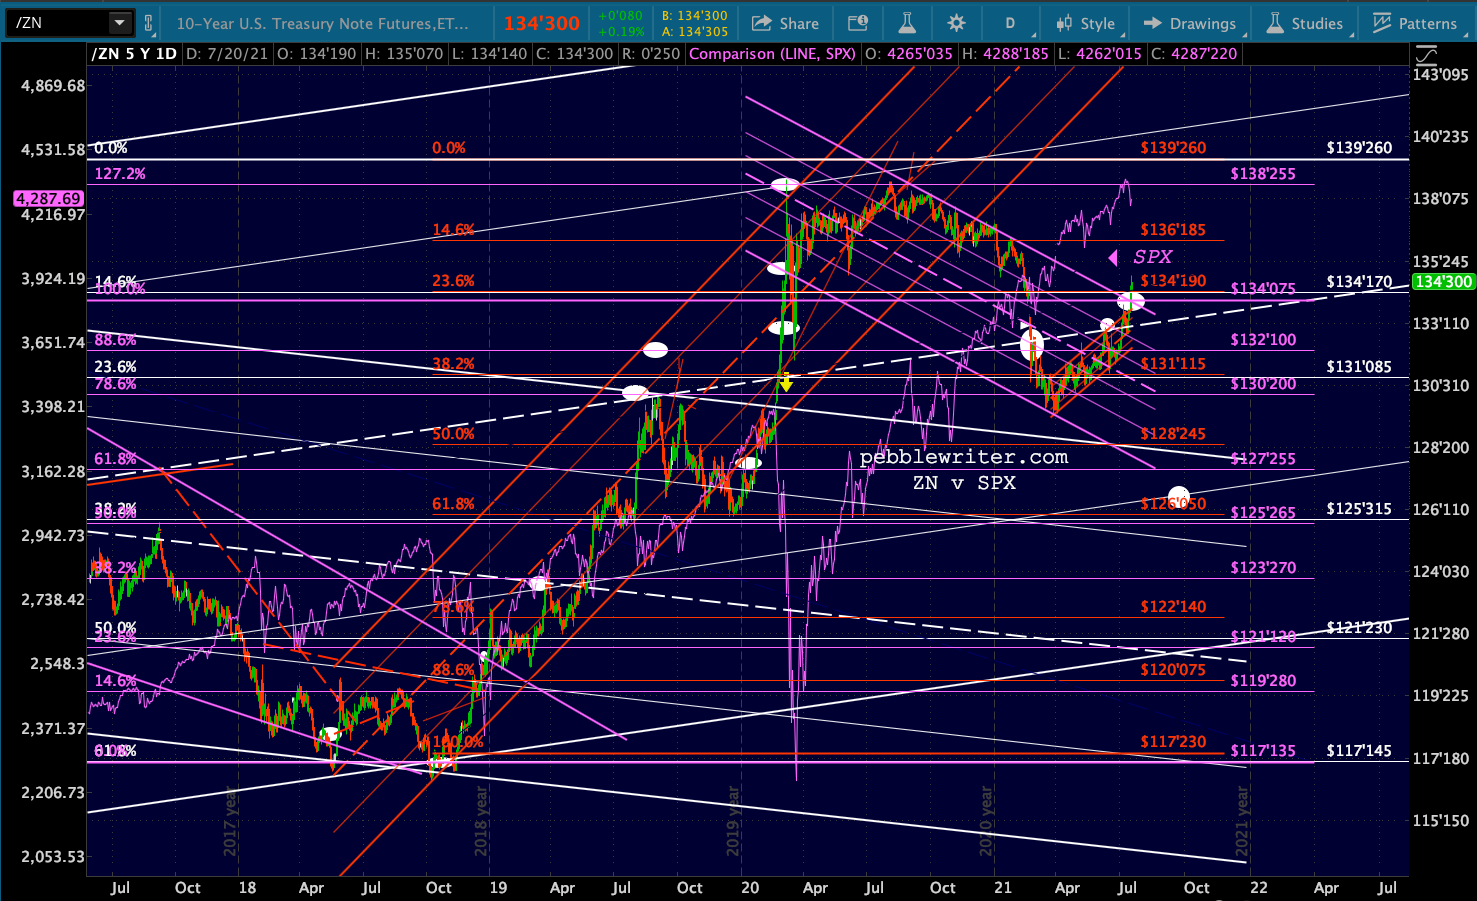 It marked the continuation of the rally following completion of the flag pattern.
  And, then there’s CL, which tagged our SMA100 target and is likely to reach the SMA200 within the next few sessions. Stocks will definitely not enjoy that maneuver.
  I won’t be surprised if USDJPY gets stuck here at the purple channel top backtest for a while.
  But, EURUSD’s steady decline is taking care of the DXY’s ascent all by itself. I’m still liking 93.88 and, if that is taken out, 97.37.
 The potential move in ZN, of course, bodes well for GC – which just survived (so far) another brush with its rising purple channel bottom. If it can push through its SMA200, which it looks like it can, then it has a date with a falling purple neckline at 1890 (the yellow dot.) If it can push through that, then it will have completed an Inverted Head & Shoulders pattern targeting 2162.60 – a long-term upside target of ours.
 UPDATE: 10:20 AM
SPX is coming up on its gap close at 4322.53…  … while ES is backtesting the broken white channel.
 UPDATE: 12:00 PM
SPX’s gap is closed.

 UPDATE: 3:45 PM
All the algo factors have backed off their scary, bearish stances and are hinting at bullish stances. ES and SPX aren’t threatening a breakout or even a break back above their SMA10s, but it is unnerving all the same as these sorts of things have happened many times in the recent path.

 It would be very easy to slide VIX down to 18.91 and send stocks another percent higher. But, that’s not happening at the moment.
 And, CL is still sitting in a bearish position – the bounce notwithstanding.

 I don’t see DXY settling back down at this point, with EURUSD going to at least 1.16. So, I’m not overly concerned about USDJPY’s bounce.

 Bottom line, the 10% correction to the 3.618 extension still looks like a very solid proposal. My hunch is that this one will ultimately play out.
BTW, silver is looking weaker by the minute…


Comments
2 responses to “So Far, So Good”
Hello PW, I know one day does not make a trend. If the selloff from July 19 is fully recovered from today and tomorrow, would that affect your forecast?
Thanks!
The million dollar question! So far, it’s looking like we’ll get more downside. But, another 12% plunge in VIX could easily spoil the party. Would it affect my forecast? Sure. I wouldn’t stay short beyond Es 4384.50, but I’d be prepared to re-short if/when it drops back below.