

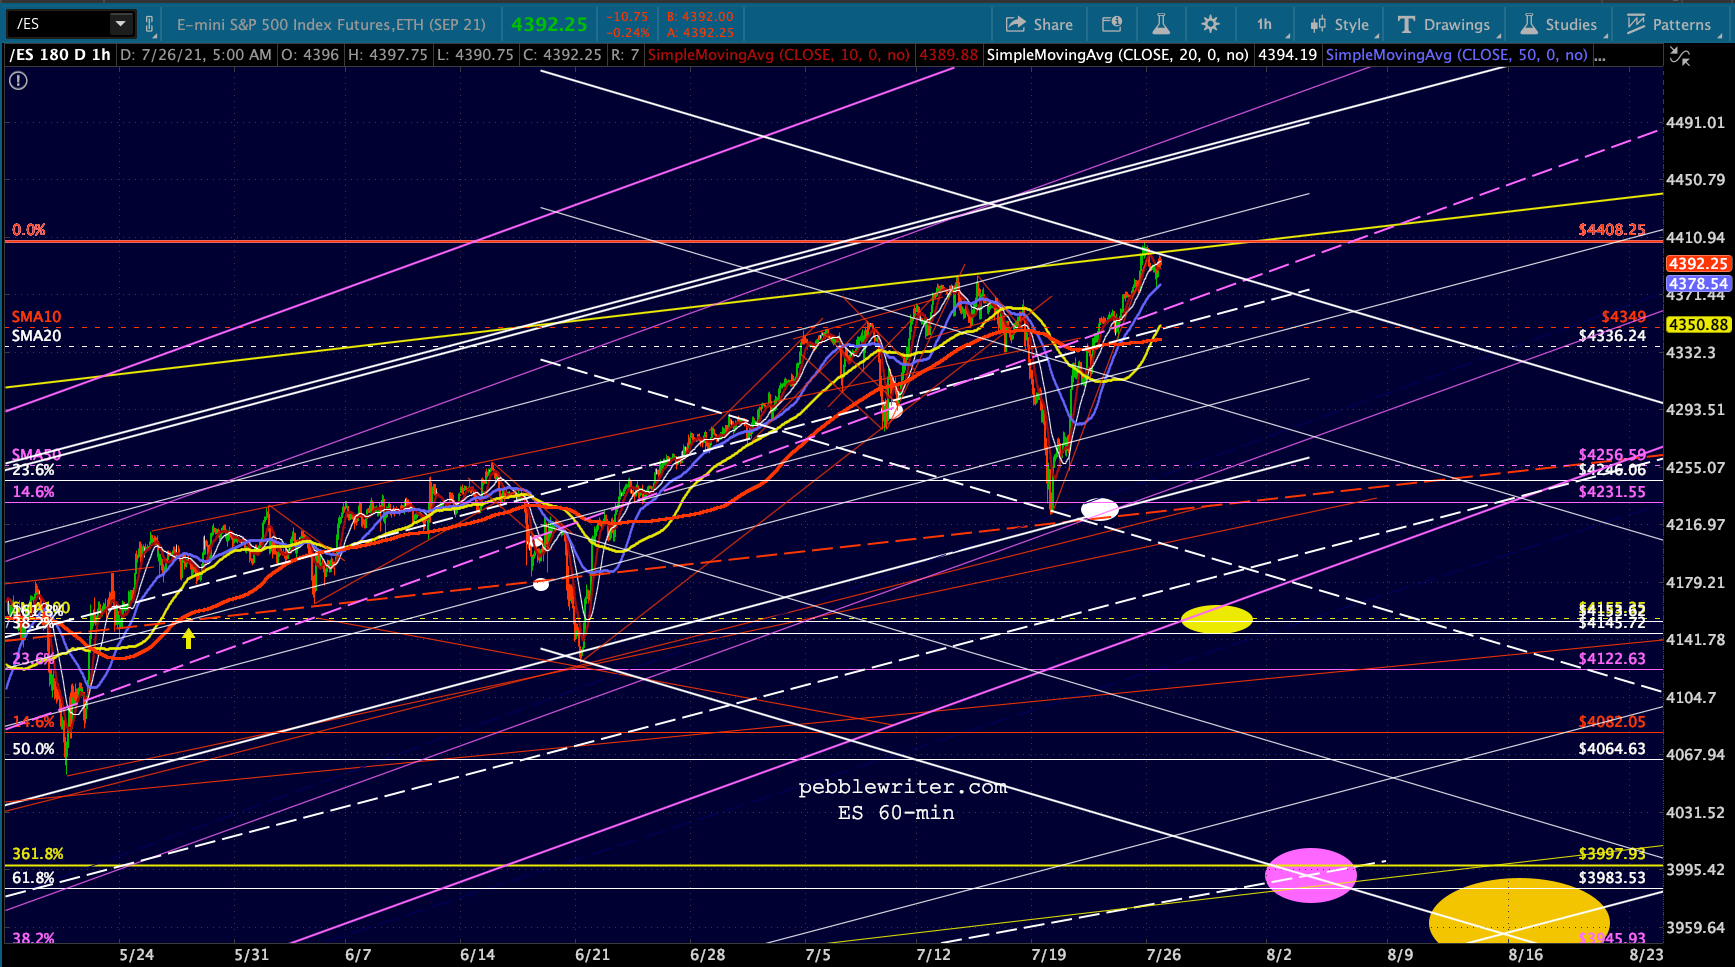
This should be an important week, with a slew of economic data and a Fed rate decision all coming up. Despite last week’s leak higher, we continue on a correction watch.
 continued for members…


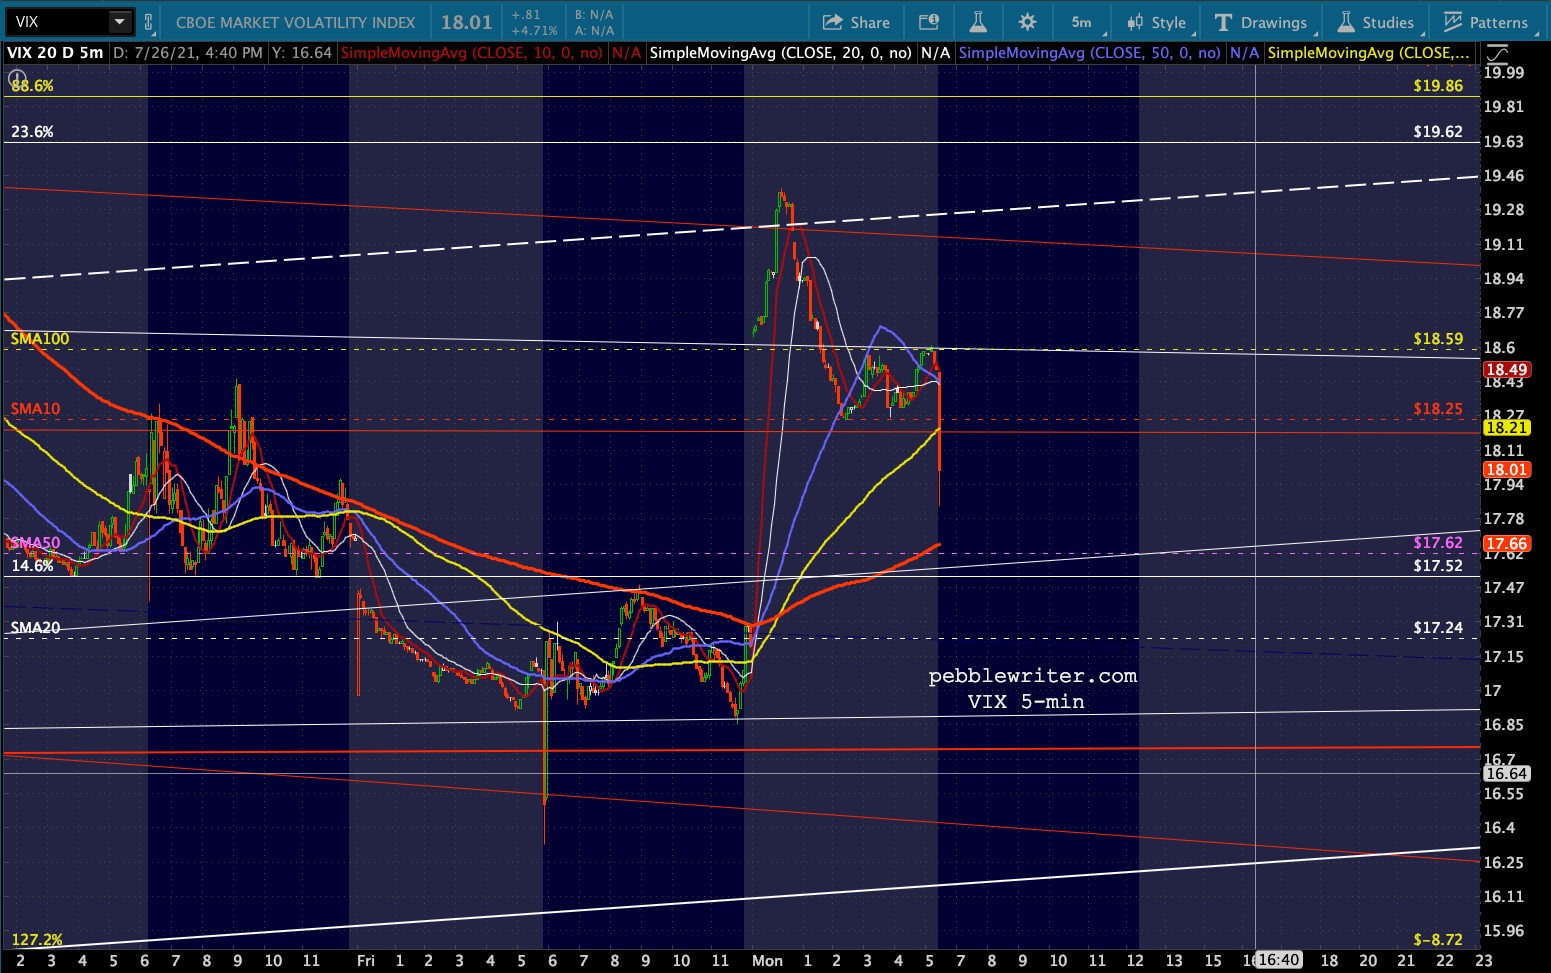
 As before, VIX continues to be in a strong position to exert control, with a bullish (bearish for stocks) 10/20 cross but an obvious hesitancy to break out just yet. Today’s bogey: the SMA100.

 As soon as I typed that, this happened – driving ES into the green. This is very typical of the manipulation that usually occurs in the days before a Fed meeting – particularly when the risk of a taper or other unwelcome action/comment is high.
 CL is testing the SMA20 as its backtest continues. I’m still looking for a drop to the SMA200 as it approaches the red midline.

Likewise, USDJPY continues its backtest behavior, with the SMA200 coming into view and not that far off now from the purple channel top. EURUSD is up slightly, but hardly enough to bother with as we’ve seen many intraday pushes above the SMA10.
  Unless it pushes above the SMA20 and we get a 10/20 cross, the meltdown should continue.
 This leaves DXY still vulnerable to a higher high at 94ish with a backtest of the broken purple channel quite possible at 97.367.
 The 10Y has closed its recent gaps and is backtesting the purple channel midline, suggesting that it’s not necessarily done falling. This is consistent with a shock to stocks greater than what we saw last week.
 From ZN’s perspective, the 10Y remains on the bubble, undecided between a retreat from the purple channel top or a breakout to backtest the broken red channel way up at 144’195 – a target that has been on our charts for well over a year.
 Gold bugs are rooting for a breakout, as the correlation could result in the IH&S pattern playing out. As it stands now, it’s caught between a rock (the purple channel bottom) and a hard place (the SMA200.)
  Bumping along beneath its SMA200 is not a good look for SI. Bulls need a recovery, but the chart sure isn’t promising one.
  Checking in on NKD…Note that its falling megaphone suggests lower lows at one of these backtests as soon if/when the SMA200 breaks down again.
 Last, BTC broke out over the weekend on what is reportedly massive short covering. It pushed through the SMA20, SMA50 and into the cloud.
  At present, the SMA10 is at 33097, slightly above the SMA20 at 33064. So, technically, this is a bullish 10/20 cross.
  And, the RSI clearly broke out beyond the blue trend line.
  I wouldn’t hesitate to chase it at this point, especially if the 10/20 cross holds and, more importantly, it breaks out of the cloud, currently at 43400, with the SMA200 just above at 44663.