

Another overnight session of VIX being hammered back below the SMA10 and melting up futures… Will it ever end?
 ES spent hours bouncing at its SMA10 yesterday, finally breaking down – perhaps as carbon-based investors began contemplating the Fed’s dilemma. But, no surprise, VIX cratered into the close and got ES back above its SMA10 just in time.
SPX is on session #18 with a close above its own SMA10, with two of those coming late in the day on a VIX smackdown.
 It appears that the algos are betting on VIX avoiding a bullish (bearish for stocks) 10/20 cross. I believe they’re wrong this time. I believe our 10% correction has finally arrived.
continued for members…The bigger picture for VIX… Note the impending 10/20 cross – unless VIX crashes well below its SMA10 today.


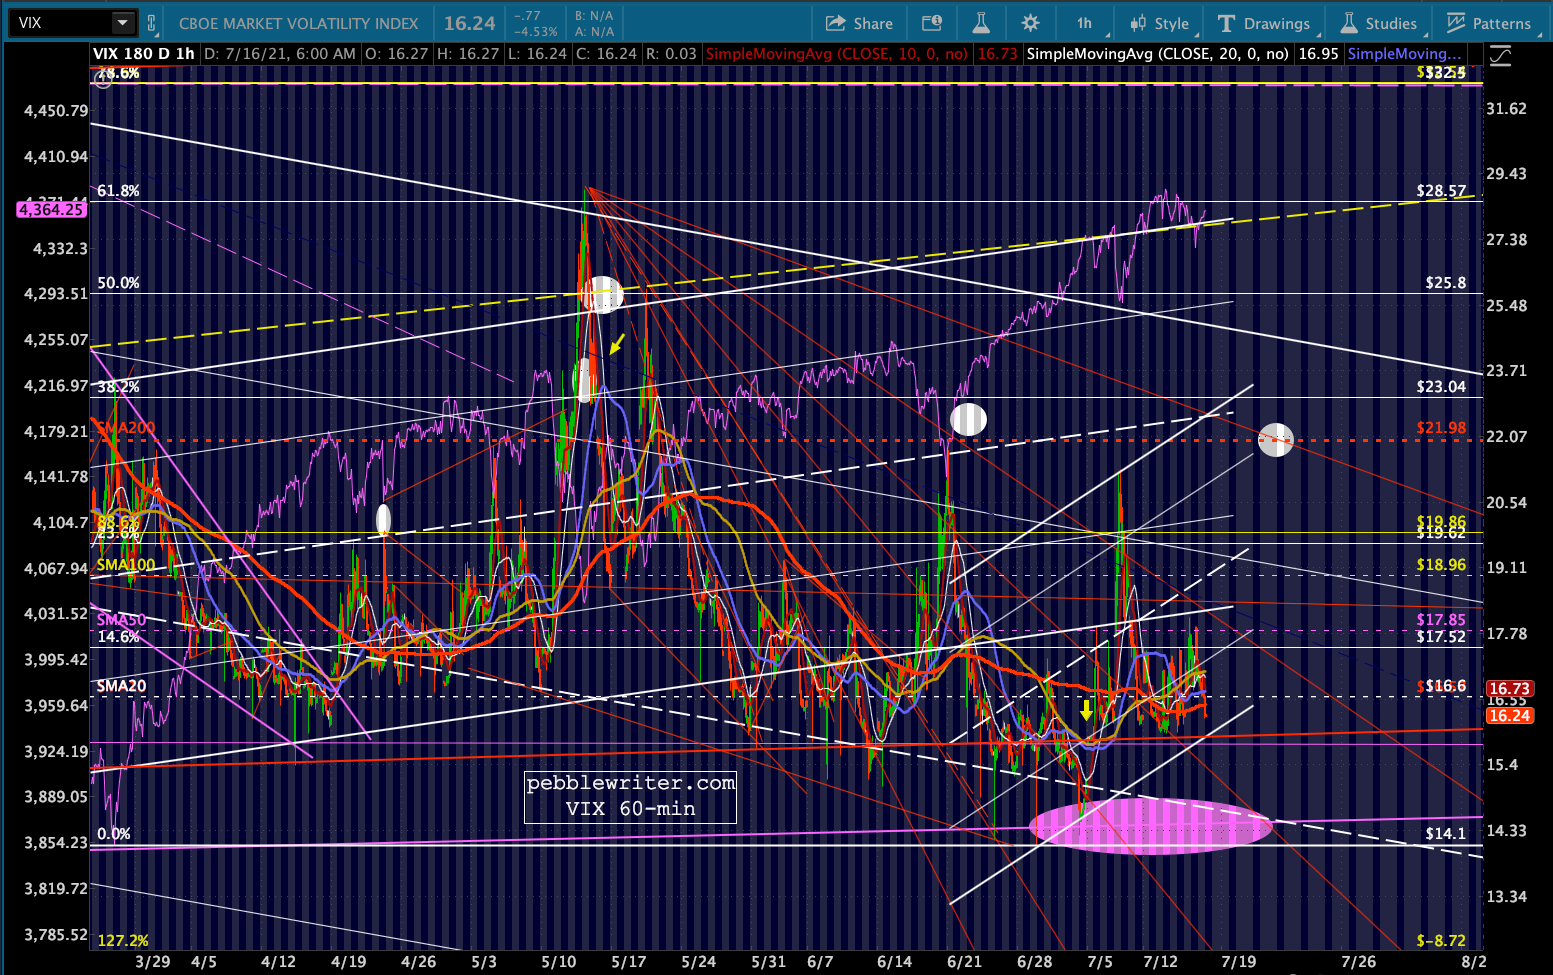 I could easily be wrong – have been many times before! – but I believe the backtest is finally here.
If we examine the weekly SPX v VIX chart I started a few months ago, we can see that VIX is bouncing off support … …just as SPX has reached the point where it can execute a relatively gentle decline to backtest the 3.618. It would be a 9.95% correction – right where TPTB like them (anything more can create a panic.)
It will mean the white channel breaking down and the purple channel taking over. If the bulls are lucky, the decline will end at the rising yellow channel .786 line as it crosses the 3.618 extension at 3956 sometime between Aug 16-30.
 Will it necessarily happen? Of course not. The Fed could orchestrate a VIX breakdown that sees it plunge below that TL from Jan 2018. It would almost certainly keep SPX on the rise. But, if you were JP, wouldn’t you rather save that maneuver for a much bigger catastrophe? Would you really use it just to push stocks another .3% higher each week for the foreseeable future?
The backtest should be accomplished by letting CL continue breaking down (it’s already started) to the SMA100 or, better yet, the SMA200 as it approaches the red midline at 57.36ish.
 They should have RB close the gap at 1.824 while they’re at it – taking a little inflationary pressure off the table.
  USDJPY, which has already broken down very gently, should be used as a regulator – backtesting the purple channel top from which it broke out multiple time between Mar and May.
 The dollar weakness against the yen will be offset by its strength against the euro…
  …resulting in the resumption of the next leg up for DXY – helping to address the inflation problem in the process.
  If the downturn gets scary enough – and especially if oil declines as I expect it to, we could easily see TNX break below the yellow channel midline at 12.21 (and the gap close at 12.02) and run down to the purple channel bottom around 7.99.
 The only argument against this move is that ZN would have to break out of its falling flag pattern. Could ZN finally backtest the 1.618 Fib way up at 144’195? That would be a heck of a move. Note that the broken red channel intersects it around (drumroll please) Aug 16.
 Such a sharp move, however, might not carry GC along for the ride. Most of the positive correlation has been through gentler swings in ZN. The huge spike higher in Feb 2020, for instance, saw GC fall.
I think it’s more likely that GC breaks down. SI has apparently already started. Central bankers like nothing more than laying waste to fiat alternatives.  It would cause quite a stir if GC’s rising purple channel broke down and it tested 1587 or even 1524.
 Hate to sound like a broken record, but BTC still looks to be on a path to 23,600.
 More later…