Month: April 2017

  • Stagflation?

    If the US facing stagflation?  Or, maybe it’s already there.  Like artificially low interest rates and all-time highs in the stock market, the official economic data isn’t exactly alarming.  But, where’s the growth?  Where’s the spending?  Maybe, just maybe, the official data doesn’t paint a very accurate picture.

    It doesn’t take an economist to see that, at this rate, GDP growth will be negative in the second quarter.

    Personal spending has essentially fallen off a cliff.

    The official unemployment rate might be below 5%, but seems to have reached a long-term floor.  Of course, it’s been redefined over the years.  Without those changes, the actual numbers are much more troubling.And, aside from a slight decline last month when the YoY increase in oil prices moderated, inflation is clearly on the rise.

    Like unemployment, the way that official inflation data is collected/reported has changed drastically over the years.  The actual picture explains why consumer spending is MIA.

    If it walks like a duck, and quacks like a duck…

    continued for members... (more…)

  • Striking Distance

    This is day 8 of our membership promotion, running now through the end of the month for members and non-members alike. We’re offering a 25% rebate off the first month of Monthly and Quarterly auto-renew subscriptions. Annual memberships are available at a very substantial discount (rewarding those who act quickly!)

    Remember, the annual pricing is available to current members. If your current membership hasn’t expired yet, we’ll tack your new subscription on to your current expiration date. This can be especially valuable for those who took advantage of a special last year which offered a discount on the first year of a auto-renewing annual subscription.

    To sign up for a new monthly or quarterly subscription, CLICK HERE. For details on an annual subscription, drop us a line with the subject line “sign me up!”

    * * *

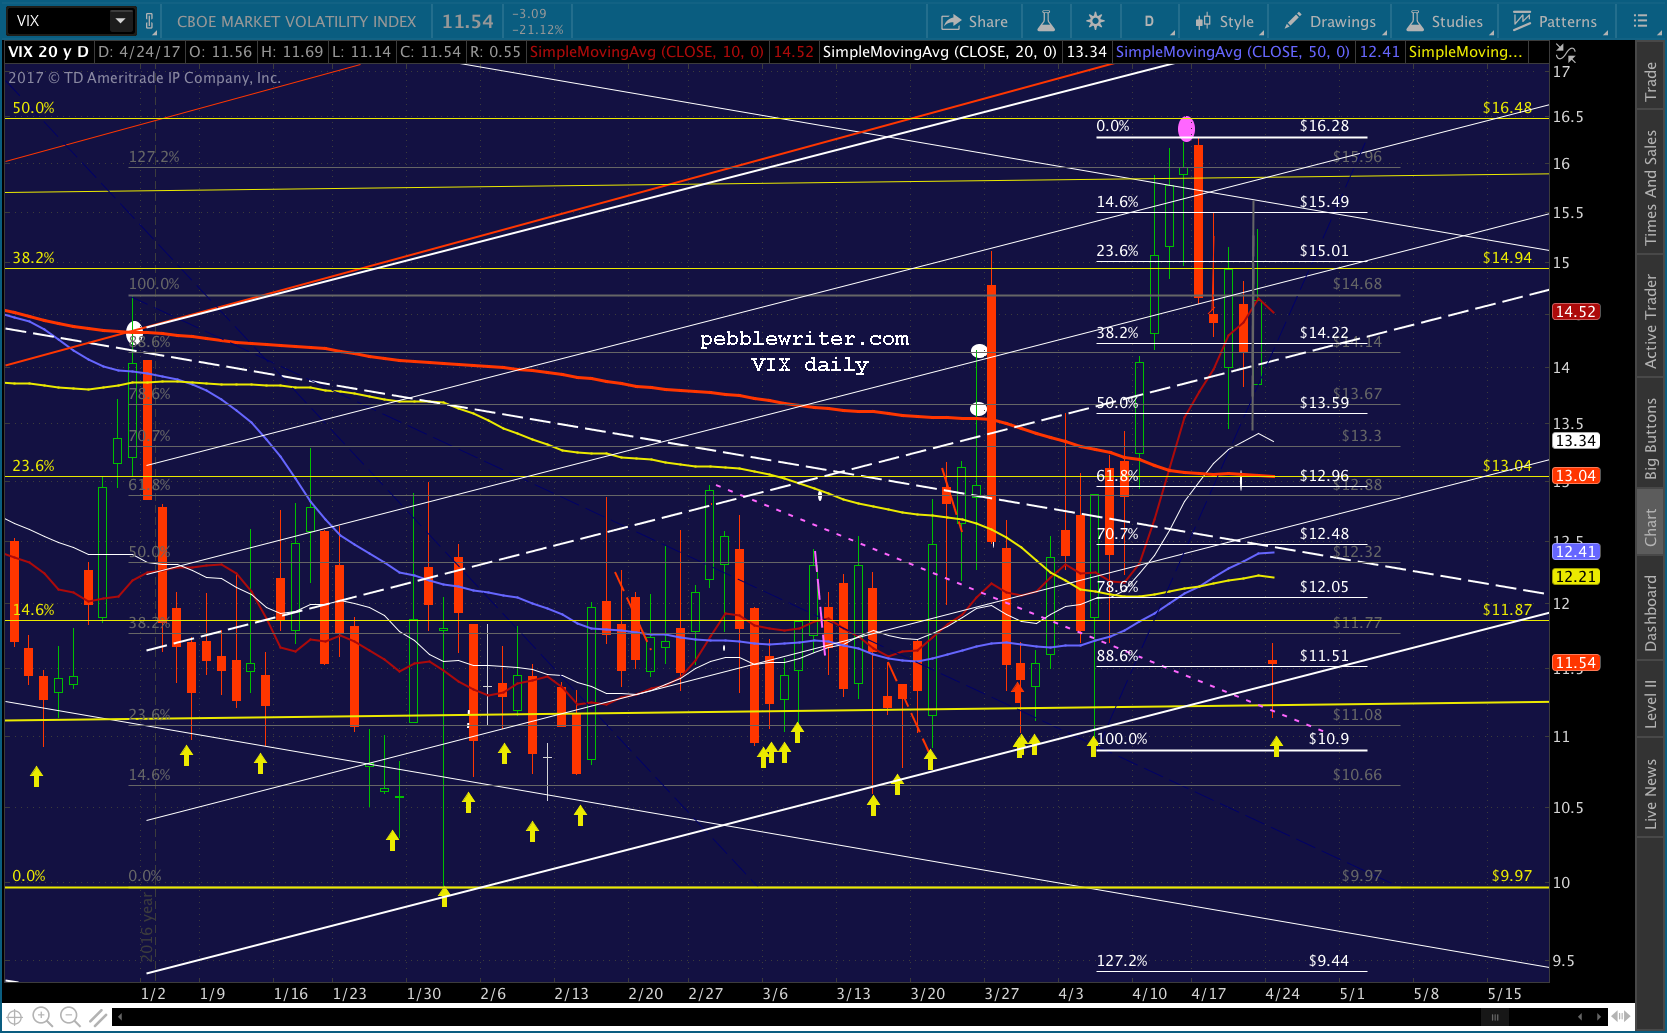
    After SPX’s break out on the back of a 37% plunge in VIX, it’s no surprise that the VIX has kept it within striking distance of new all-time highs.

    In dropping that 37%, VIX completed a deep retracement of its rise from 9.97 — the lowest it’s been since 2007 — to 16.28.  The .886 retracement is considered the last stop before prices drop through the previous lows.  Imagine: risk being considered lower than at any time since 2007!

    Yesterday, VIX spent the entire day dancing around that .886, with a dip below it every single time SPX started slipping.  The message to algos was that VIX was about to drop to new lows and, therefore, stocks should be bought.It was enough to keep SPX from completing a simple retracement from its .886 to its .786, or any meaningful dip until the final minutes of an otherwise nonsensical session.Today’s a new day, as CL is closing in on our 48.35-48.45 target and investors are no doubt anxious to express their disappointment with the lack of details provided for the fantastic, big-league tax cuts “revealed” yesterday.

    Despite the slight bump in futures overnight, our downside targets remain intact – starting with 2384.

    continued for members(more…)

  • Calm Before the Storm: Apr 26, 2017

    After a furious VIX-inspired rally the past two days, futures are dead flat.  VIX’s continuing slump (-1.4%), USDJPY’s continuing ramp (+0.32%) and WTI’s continuing threat to break its SMA200 (-1.0%) seem to have perfectly balanced one another out.Depending on whom you ask, Trump’s tax plan due out later today will either provide a nice spark for a continuing rally or lead to massive disappointment.

    continued for members(more…)

  • Who Let CAT Out of the Bag?

    Is Caterpillar’s gap higher the real deal or a dead cat bounce?

    There was an interesting post on Zerohedge this morning discussing its earnings.  GAAP versus non-GAAP made a huge difference, as is so often the case these days.

    Because while CAT reported adjusted EPS of $1.28, up exactly 100% from a year ago  – almost as if it was goalseeked – something far less appetizing emerges when looking at CAT’s actual, GAAP EPS, which happen to be exactly one quarter of the non-GAAP number, or $0.32, a 30% drop from a year ago.

    The term “goalseeked” caught my attention.  As it turns out, I chart CAT from time to time.  On Jan 27, CAT reached the top of a falling channel shown below in red at the same time that it completed a Gartley Pattern at the .786 Fib.

    The channel looked pretty legit, as it was based on two recent, prominent lows.  And, the .786 Fib was legit enough, as CAT had a significant reversal just shy of its .618.  The last time I charted it, I assumed it would reverse off the .786 and, at the very least, tag its SMA200 as it approached the .618 at 90.41.

    As an aside, it had already reached 90.41 (on the nose) on Mar 9 — a few days after Federal officers raided its offices, looking for evidence of accounting irregularities.  It dipped even lower by Mar 27, but was saved from a worse fate by a timely Goldman Sachs “conviction buy” upgrade (a more accurate call than Goldman’s sell recommendation at its lows of 57 in Jan 2016…but, I digress.)

    Until the VIX smackdown of the past two days, sub-90.41 looked fairly likely.   CAT had fallen below its 10, 50 and 100-day moving averages and was working lower in a channel that intersected with the SMA200 at 89.65 yesterday.

    Instead, CAT rose over 11% over the next two sessions.  It reminds me a great deal of GS’s goal-seeked “breakout” back in November [see: Goldman’s Slick Trick.] which saw it gap above strong resistance and pile on 20% just about the time — and, I’m sure this is a coincidence — that stock options became exerciseable.

    That analysis stuck in my mind because it was so “goalseeked” as to be blatantly obvious.  In fact, just today GS reached an important price level that could have significant implications for both it and broader markets.Back to CAT.  Maybe the fabulous, non-GAAP numbers will be enough to send it up to new highs.  Maybe, they won’t.  Aside from the .886 Fib at 105.18, there’s one final trend line (in purple) that suggests at least a pause.

    And, of course, there’s the issue of oil prices — which, because they’re highly correlated with CAT’s business and stock price — could have an even greater impact than creative accounting going forward.

    Stay tuned.

     *  *  *

    For more on goal-seeking SPX targets through creative and timely VIX bashing, check out How Broken is the Market?

  • How Broken is the Market?

    Yesterday, VIX experienced its 4th biggest drop ever, plunging 25.9% from Friday’s close even though France’s election delivered the very same results that just about everyone expected.

    It has dropped even more this morning, and is now off 33.3% from Friday’s highs — despite the fact that there’s the potential for war on the Korean Peninsula and the probability of a government shutdown later this week.

    Is there any logic to this?  What should we take away from the behaviour of the “Fear Index?”

    Between 2014-2016, VIX very rarely tagged the bottom of a huge, rising channel (shown below in yellow.)  When it did, this meant that fear was unusually low.

    Without fail, however, every tag on the yellow channel bottom meant that stocks were at or very near a significant top.

    Things changed, however, following the US election.  VIX plunged right in the middle of stock futures’ 5.7% mini-crash.  This was beyond ridiculous.  Selling VIX as futures are plunging is the equivalent of cancelling your homeowners policy as a tornado is ripping the roof off your house.Who would do such a thing?

    It would have to be someone with unbelievably deep pockets — someone for whom ensuring that stocks continued to march higher was more important than the many billions of dollars they might lose in the process.  In other words — central banks.

    In a note on Apr 21, Merrill Lynch reported that central banks have already “invested” over $1 trillion YTD — an amount on track to top 2008’s $2.8 trillion by 25% and more than double last year’s $1.7 trillion.

    Some central banks, like the BoJ and SNB, invest directly in equities in order to manipulate stock prices higher. It’s more effective than big, clumsy measures like QE.  Over the years, however, they’ve discovered they can get more bang for their buck by using more refined measures like the yen carry trade, oil futures and VIX to drive algorithms.

    Simply put, algorithms look to a variety of indicators to tell them when to buy and sell stocks.  If oil spikes higher, stocks will too.  If USDJPY rallies, you can bet that stocks will be close on its heels.  And, if VIX sheds 25% in a day, well…we’ve seen what happens, haven’t we?

    Machine trading is gradually replacing real, live people — traders in pits who might look up, scratch their heads and ask “wait a second, does that make any sense!?”  Just a few weeks ago BlackRock, the world’s largest investment manager with $5 trillion under management, announced it was laying off human traders and increasing its emphasis on machine trading.

    When VIX drops, algos don’t ask why.  They simply read it as a reduction in risk and trigger buy orders.  However, as VIX approaches long-term support such as the huge, yellow channel, algos know that the rally is almost over.  At least, that’s what they used to think.

    In its last “normal” tag, on Aug 9, 2016, VIX correctly signaled a drop in ES that extended to 163 points at its election night lows.  But, as mentioned above, VIX was hammered that night and, by mid-November, had broken down through channel support (the white arrow) in order to produce new all-time highs in stocks.

    The next time VIX tagged the yellow channel line, on Dec 21, it produced a very modest 34-pt drop in ES.  Were the algos learning?  Was VIX signalling a fundamental change in the level of risk in the markets?Since Dec 21, VIX has dipped below the yellow channel bottom 27 times — an astounding one out of every four sessions.  More importantly, the dips always come at crucial moments, when ES and SPX are in danger of breaking trend (thin purple lines below) or need a boost to get up over resistance.

    The latest example, of course, is this week.  ES and SPX have both been locked in a falling channel since their all-time highs on Mar 1.  Yesterday, based largely on VIX’s historic plunge, futures broke out of that channel and are threatening to make new, all-time highs.  Improbably, this has occurred during a week of highly elevated geopolitical and macroeconomic risks.

    At 10.22 this morning, VIX almost reached the Feb 1 lows of 9.97 (the day it plunged 23% to convince algos that the Fed’s rate increase was no big deal.)  The last time VIX was this low was in Feb 2007, just months before the S&P 500 peaked and crashed 58%.  I’m not suggesting that a crash is imminent. But, I think it’s important to realize that the “market” is broken, and that its gains (e.g. the “Trump Rally“) possess all the integrity of a campaign promise.

    There was a time when VIX was a great indicator of fear in the markets.  Now, it’s just another tool with which to drive stocks higher.  Put simply, the tail is wagging the dog.  And, the people doing the tail-wagging are not only determined, they have access to an unlimited amount of free money.

    Now, on to today’s forecast.  SPX backtested to within .79 of our target at the yellow neckline yesterday before deciding that appearances aren’t all that important.

    continued for members... (more…)

  • If At First You Don’t Succeed…

    SPX has seen two bullish IH&S Patterns busted over the past two weeks.  They came close enough.  The latest even completed last Thursday before fizzling after the overnight ramp fell apart under scrutiny of the mounting risks in the markets.

    VIX’s 26th Drop Below Support this Year

    But, there’s nothing like a 1%+ gap higher over a weekend when investors are already on edge, to complete an IH&S —  which is exactly what we’re facing this morning.  While the French election results were a relief to the status quo, there are still other significant risks out there.  This week.

    Sure, they can hammer VIX back down below support (-32% in the past week!) and break USDJPY out of its latest bearish pattern; but, will the breakout hold this time?  Last I heard, the Korean situation hadn’t gone away, and the US government still faces a potential shutdown Friday night.

    continued for members(more…)

  • On the Cusp

    CLICK HERE for details on our new membership promotion.  The faster you jump on it, the more you save!

     *  *  *

    SPX reversed at the very last possible moment, yesterday, before the meltup could be labeled a breakout.  For now, we remain nervously short from 2361.32 for what should be at least a 10-pt gain.

    Why “nervously”?  As we discussed yesterday, the good news for bulls is they’re at the cusp of a strong breakout.  The good news for bears is they’re at the cusp of a breakdown.  That’s right.  This is one of those critical turning points that will determine the course of the next few months — and, who gets to celebrate come Monday.

    Of course, the French election is only one in a list of several potentially landscape altering events scheduled for next week.  There’s also the possibility of a government shutdown, potential nuclear war in North Korea, and the very real and expanding wars in Syria, Afghanistan and wherever else we’re about to bomb.

    One thing’s for sure…real, live investors, speculators and traders have woken up to the risk.  Remember the string of VIX plunges (the yellow arrows) below the yellow channel bottom?  As of a few weeks ago, it was averaging one of every four sessions.  Not so much, any more. Might markets exhibit a little nervousness in the lead up to the week ahead?  Stay tuned.

    continued for members(more…)

  • Q1 2017 Results

    Our first quarter total came in at 26.17% versus 5.53% for the S&P 500.  This brings our average monthly return to 8.39% for 2017 YTD and to 14.58% for the period since Jan 2015.

    While Q1 returns were lower than those earned in 2015 and 2016, there has been significantly less volatility these past few months, and much fewer opportunities to short.

    Discussion

    This quarter was arguably the most challenging in recent memory.  Coming on the heels of the algo-driven post-election ramp job, stocks rallied strongly into the year end.  This was in keeping with our analog first posted on Aug 3 [see: A New Analog] which called for SPX to reach 2297 by Jan 5.

    From the Dec 9 Analog Update:

    SPX was a little late, reaching 2297 on Jan 25 and then reversing.  But, two weeks later, it shot up through 2300, breaking out of a sharply rising channel and tacking on an additional 100 points before finally running out of steam.

    This was unexpected, and we spent much of January and February getting head faked by frequent weak closes which were then followed by strong gaps higher the following morning (11 of 39 sessions.)

    March was more fruitful, as the sharp decline in oil prices we had forecast finally played out, driving stocks lower in the process.  This was a nervous few weeks, as speculative long positions had reach all-time record highs.  But, it worked out nicely, and we were able to maintain higher conviction on our positions throughout the month.

    As we’ve discussed often, VIX took up the mantle of chief market manipulation tool following the US election [see: Why the Trump Rally is a Fraud.]  Between Dec 21 and Apr 5, it dropped below the bottom of a long-term channel that used to warn of impending corrections an astonishing one out of every four sessions (the yellow arrows.)

    While VIX has moved off the yellow channel bottom these past few weeks, USDJPY and CL are still quite active in propping up stocks.  Just today, USDJPY completed an IH&S Pattern that drove SPX nearly 1% higher.

    There will no doubt be many head fakes and trap doors ahead. In the next week alone, we face the prospect of war, the next step in the dissolution of the EU, a budget showdown and government shutdown, and the continuing oil price collapse.  Our latest forecast indicates plenty of fireworks!

     *  *  *

    Membership Promotion

    To celebrate successfully getting through a difficult quarter, we’re throwing a little membership promotion through the end of April.  Earn a 25% rebate on a monthly or quarterly membership [CLICK HERE] or take advantage of special prices on annual memberships.

    But, don’t wait too long.  Annual memberships start at $500 today, April 20, and rise by $50 each day through the remainder of the month.  Just CONTACT ME with the subject line “set me up!”

    The sale ends Apr 30, so don’t delay!


  • Sometimes You’re the Bug

    Note: First quarter 2017 results have been posted.  For the latest, including news about a membership promotion starting today, CLICK HERE.


    Sometimes you’re the windshield,
    Sometimes you’re the bug.
    Sometimes it all comes together baby,
    Sometimes you’re a fool in love.
    Sometimes you’re the Louisville Slugger,
    Sometimes you’re the ball.
    Sometimes it all comes together baby,
    Sometimes you’re going lose it all.

    Mark Knopfler, Dire Straits

    It seems another hedge fund bites the dust almost every day.  It’s hardly surprising, given the state of the “markets” lately.

    It used to be that having a strong grasp of macro- and microeconomics and financial statements was enough to generate respectable investment returns.

    Now, it seems that funds have essentially three choices:

    1)  become a closet indexer — hopefully, with alpha thrown in from brilliant stock picking
    2)  be extremely nimble — avoid or take advantage of seemingly random rips/plunges
    3)  be one of the manipulators (or shadow them)

    Being a closet indexer doesn’t work very well in a 2/20 structure.  While there are certainly some great stock pickers out there, even great picks suffer along with everything else when the market is plunging.

    And, it’s challenging to be nimble if you’ve got anywhere north of $1 billion — or, even $100 million. Given how low volume has become, stocks are sensitive to big moves into and out of markets.

    This leaves our manipulators — central banks, their lackeys and big, data-driven firms which are able to shadow or emulate them: Renaissance, Citadel, etc. (some have even accused these firms of being able to help write the daily script via their ability to drive the algo drivers.)  If you’ve got $20+ billion and like to throw your weight around, you can make your own luck.

    Bottom line, stocks are driven all day, every day, by algos which feed off three primary drivers: the price of oil, USDJPY and VIX.  Each of these is manipulated on a daily basis, primarily by central banks but almost certainly by other large players.  If you haven’t noticed this, you haven’t been looking very hard.  Together, they were entirely responsible for the election night recovery and subsequent Trump Rally [see: Why the Trump Rally Is a Fraud.]

    Yesterday, I forecast a pop and drop, calling for a short at 2351.52 (within a point of the top) which we then rode down to 2336.75 (within 2 points of the bottom.)

    VIX, which was hammered over 12% off yesterday’s highs, is curiously on the rise.  Could it be that this ramp job isn’t meant to stick?  It’s been a while since we had a nice pop and drop… Note that the IH&S has completed, so this is a make or break moment for SPX.  I’d short here at 2351.52 with tight stops.

    We picked up 0.6% for the day only by watching and anticipating the price action and interplay between CL, VIX and USDJPY.  It wasn’t an amazing day.  But, string enough 0.6% days together and you get a nice month.  Those who ignore chart patterns and technical analysis were left scratching their heads.

    It works around 90% of the time.  When it doesn’t, it’s because: (1) something big is happening that can’t be contained by a timely hammering of VIX or a USDJPY ramp; (2) those doing the manipulating have their signals crossed; and, (3) the move is imminent, but is delayed multiple times while the big boys position themselves ahead of time.

    Last month, this approach generated 13.15% — a little below our average of 14.58% since Jan 2015, but better than the two previous months (meltups are challenging.)  [see results.]  While I generate medium-term and swing targets, about half of our returns are the result of intra-day swings — many of which are head fakes.

    The worst are those at the end of the day.  Yesterday’s close, for instance, saw a three-day old channel break down.  In the old days (pre-2010) this would have been a bearish development, particularly since stocks are likely headed lower over the next week.

    From yesterday, just before the close:But, a timely push above resistance by USDJPY and a timely after-hours dip by VIX ensured that SPX opened back inside the rising white channel.  They can just as easily push SPX up and out of its falling purple channel.  So, as is often the case, forecasting this beast involves discerning the intent of those who are doing the manipulating and contrasting it with inherent limitations they face.

    A simple example is the USDJPY.  By hammering the yen (an increase in the USDJPY) it’s easy to drive stocks higher.  But, at some point, a cheaper yen hurts Japanese consumers and businesses who must pay higher prices for imported oil and food.

    If you’re thinking “hey, wait a minute; this is the tail wagging the dog!” you’re absolutely correct.  In fact, I’ve had even better results in forecasting currencies and commodities, as they usually wear their motivations on their sleeves.

    If you’re thinking “hey, wait a minute; this is easy!” you’re dead wrong.  I watch 10-12 charts on six monitors all day, and the interplay between them often defies logic. For example, we’ve had several instances, lately, of VIX and stock prices both rising or falling at the same time.

    It’s also quite common for large moves to be delayed all day long, only to take place after hours.  And, don’t get me started on intraday ramps in USDJPY that are unwound after the close each evening, when futures are more easily propped up (watch it tonight.)  Even worse: ramping VIX overnight so it can be hammered during market hours when stocks need a boost.

    All this to say…if trading has been tough lately, you’re in good company.  If a $3 billion hedge fund with dozens of insanely smart analysts and traders backed up by world class research and computers can’t hack it, maybe it’s not them.  Maybe it’s the market that’s broken.

    Now, on to today’s forecast.

    continued for members…
    (more…)

  • Charts I’m Watching: Apr 19, 2017

    Another ramp job last night, this one courtesy of USDJPY – which is conveniently back above its SMA200.

    VIX, which was hammered over 12% off yesterday’s highs, is curiously on the rise.  Could it be that this ramp job isn’t meant to stick?  It’s been a while since we had a nice pop and drop.

    continued for members(more…)