

The great thing about analogs is that they tell you when a move will occur and which direction it will be in. But, there are two not so great things about analogs: the moves aren’t always the same size as in the prior period; and, they don’t always make sense.
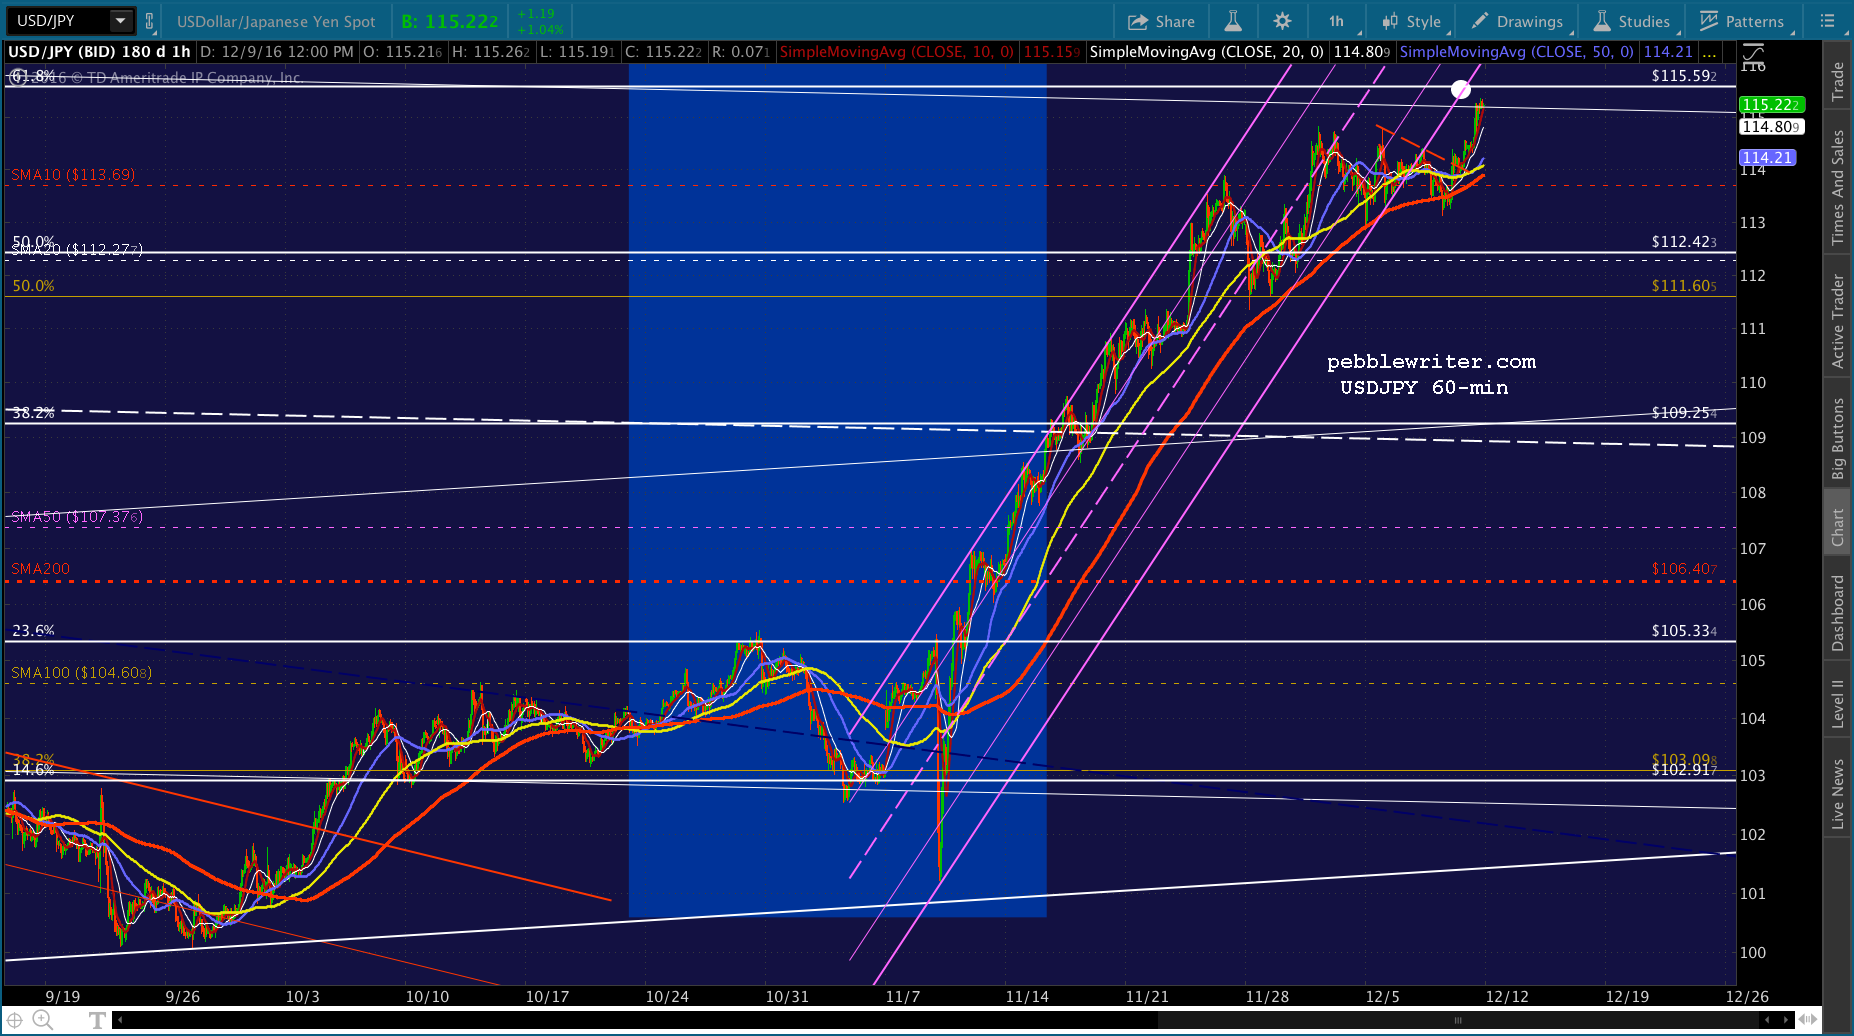
The most frustrating part about forecasting is seeing moves play out that are completely divorced from the economic fundamentals. Such is the case, now, as the talking heads are coming up with all kinds of reasons for the ongoing rally except the ones that matter: oil and USDJPY are being ramped higher, and VIX forced lower when necessary, which has kept the algos in an unrelenting meltup.
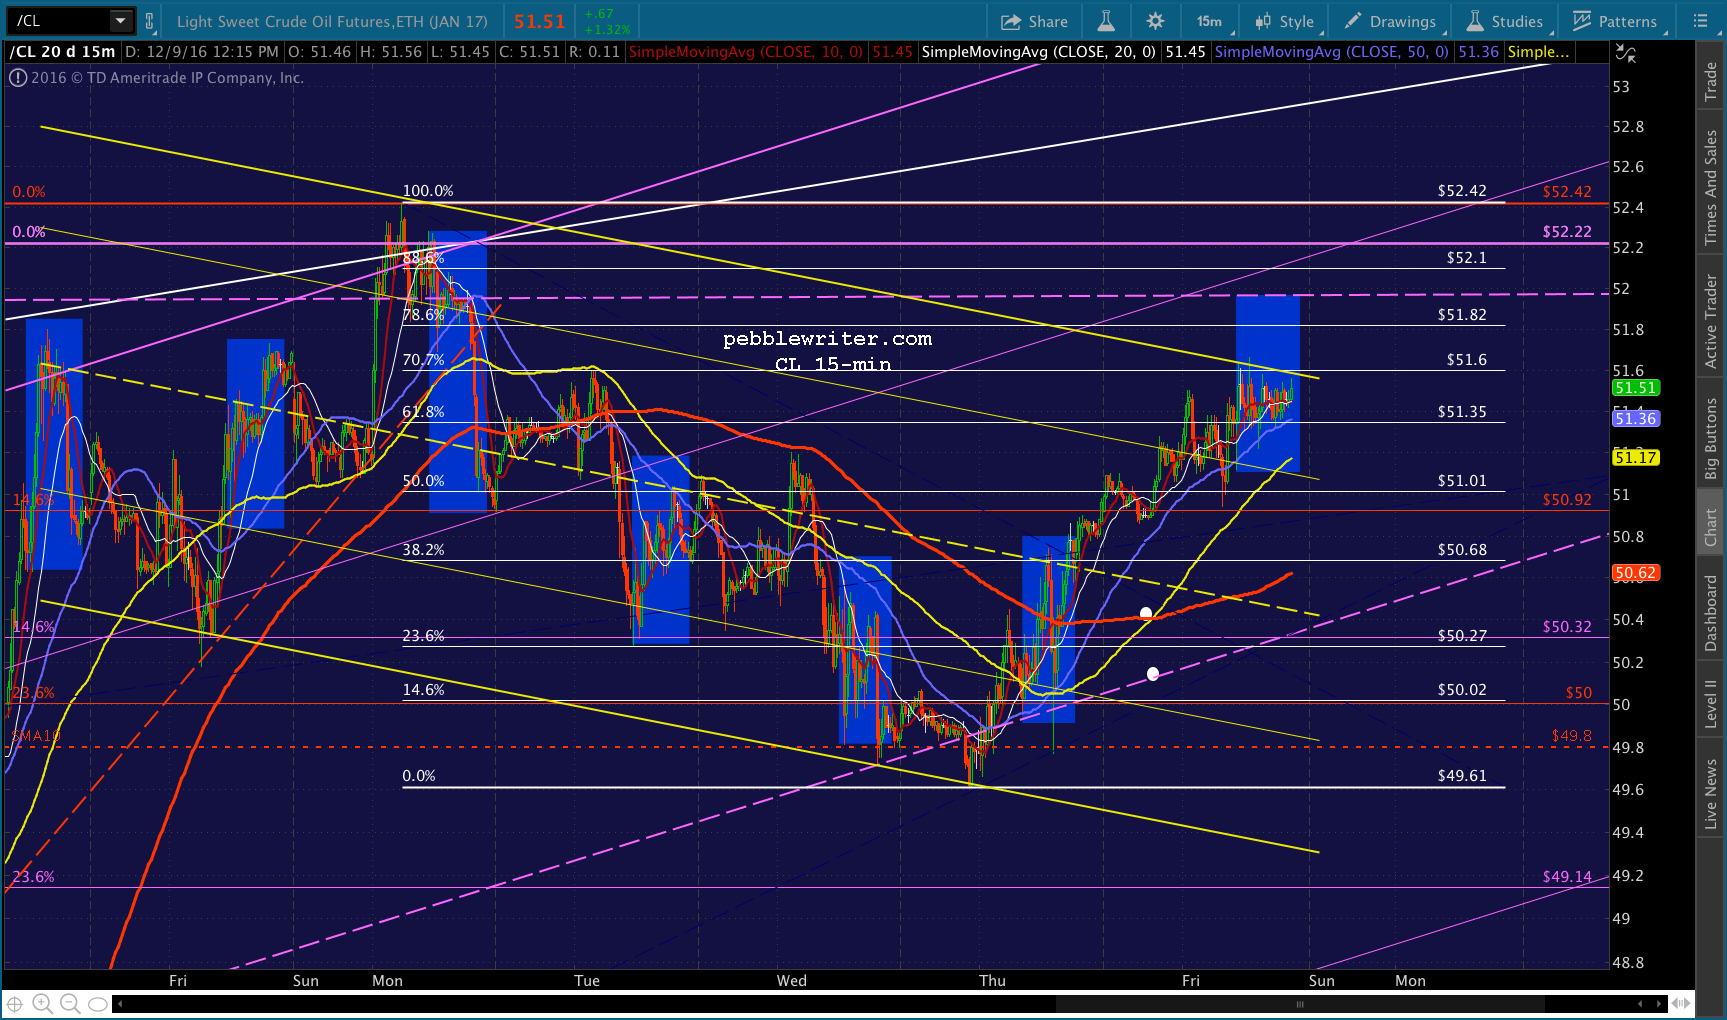
Note that CL, for instance, has “broken out” of a series of falling channels as fast as it can construct them. Having reached last night’s target right on time, it’s breaking out again. We’ll take a look at our current analog, and adjust a few price targets as needed.
continued for members…
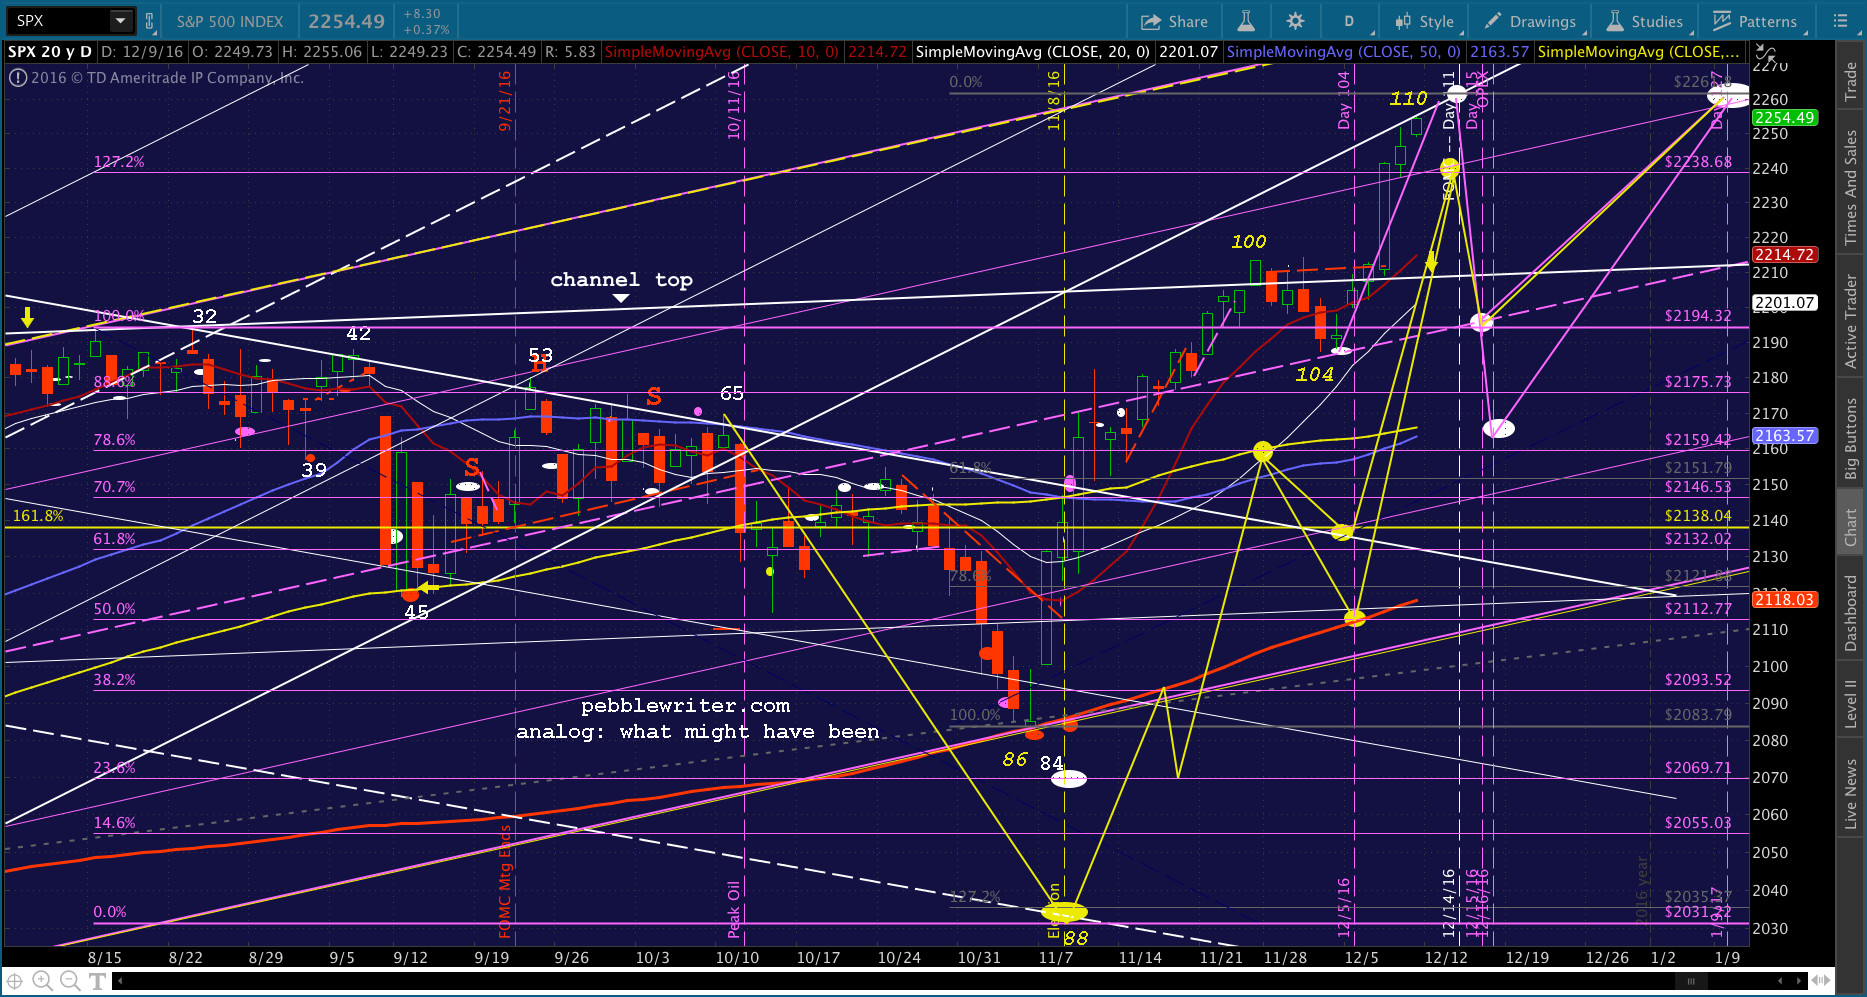
First, a look at the current path as plotted last week. Note that SPX is backtesting the rising white channel from Feb 11. 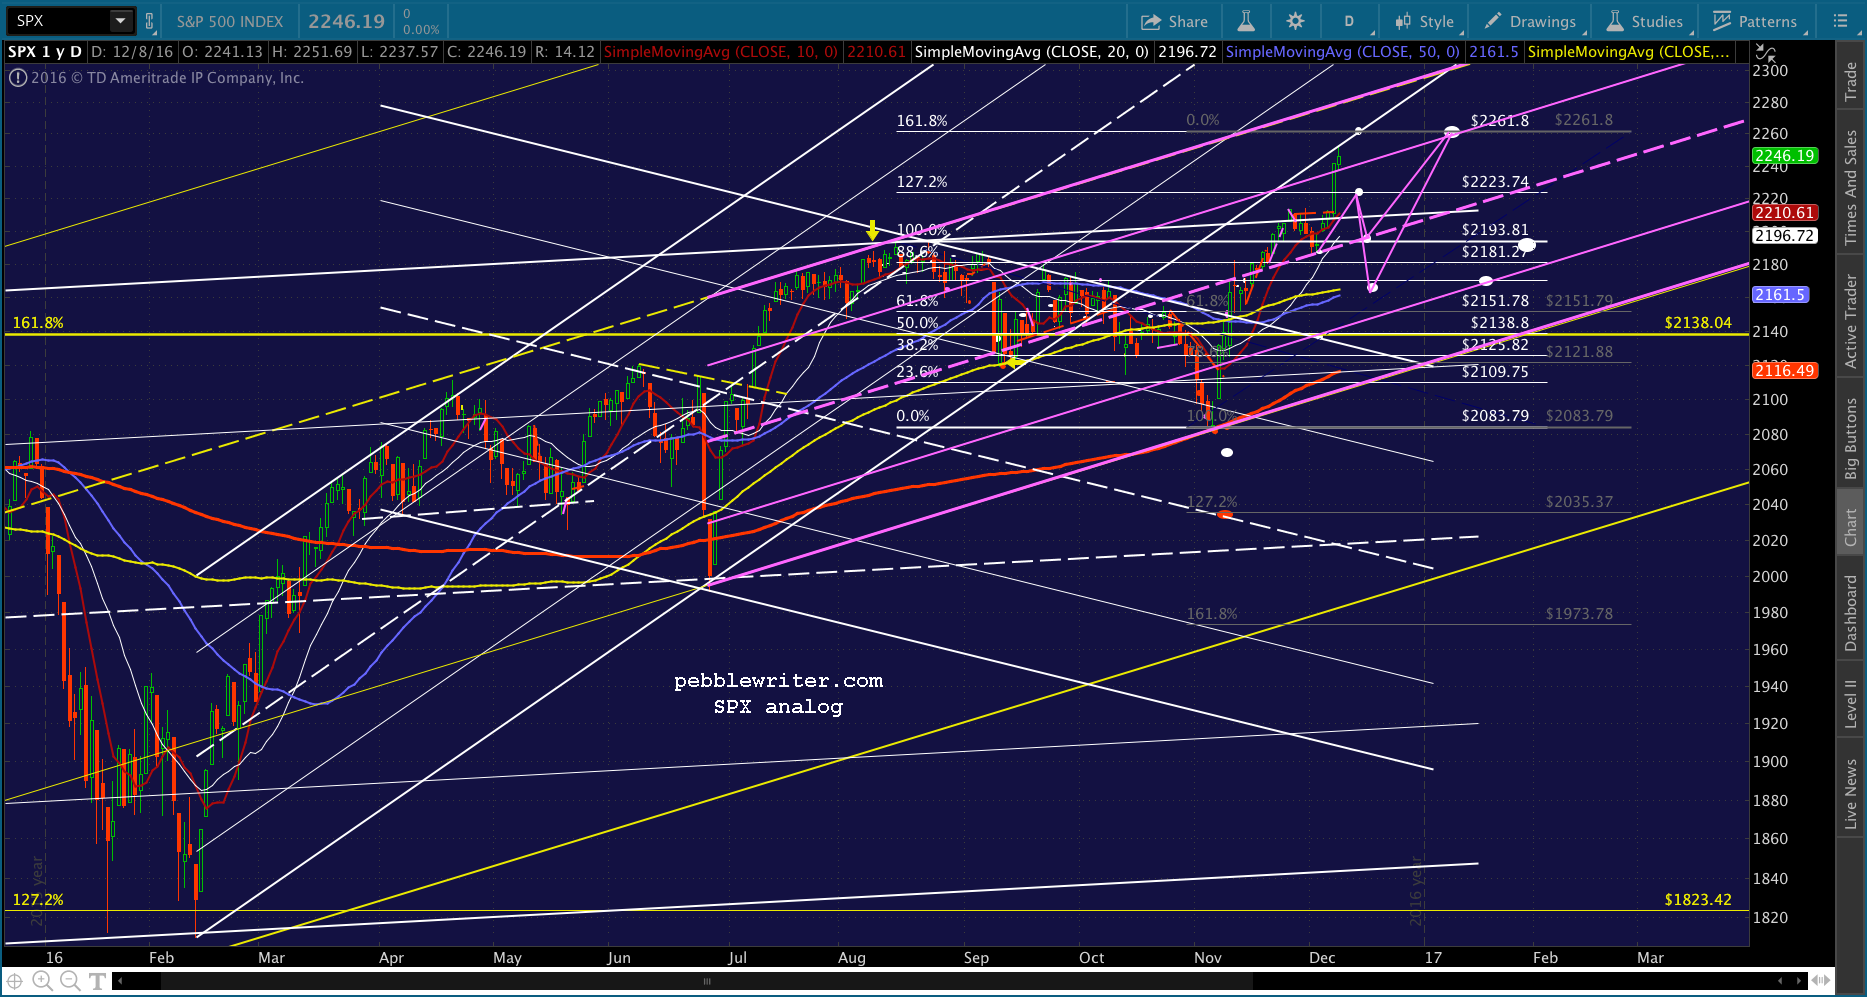 This would ordinarily be a bearish signal, as is the fact that SPX is now very much overbought (RSI is over 74.)
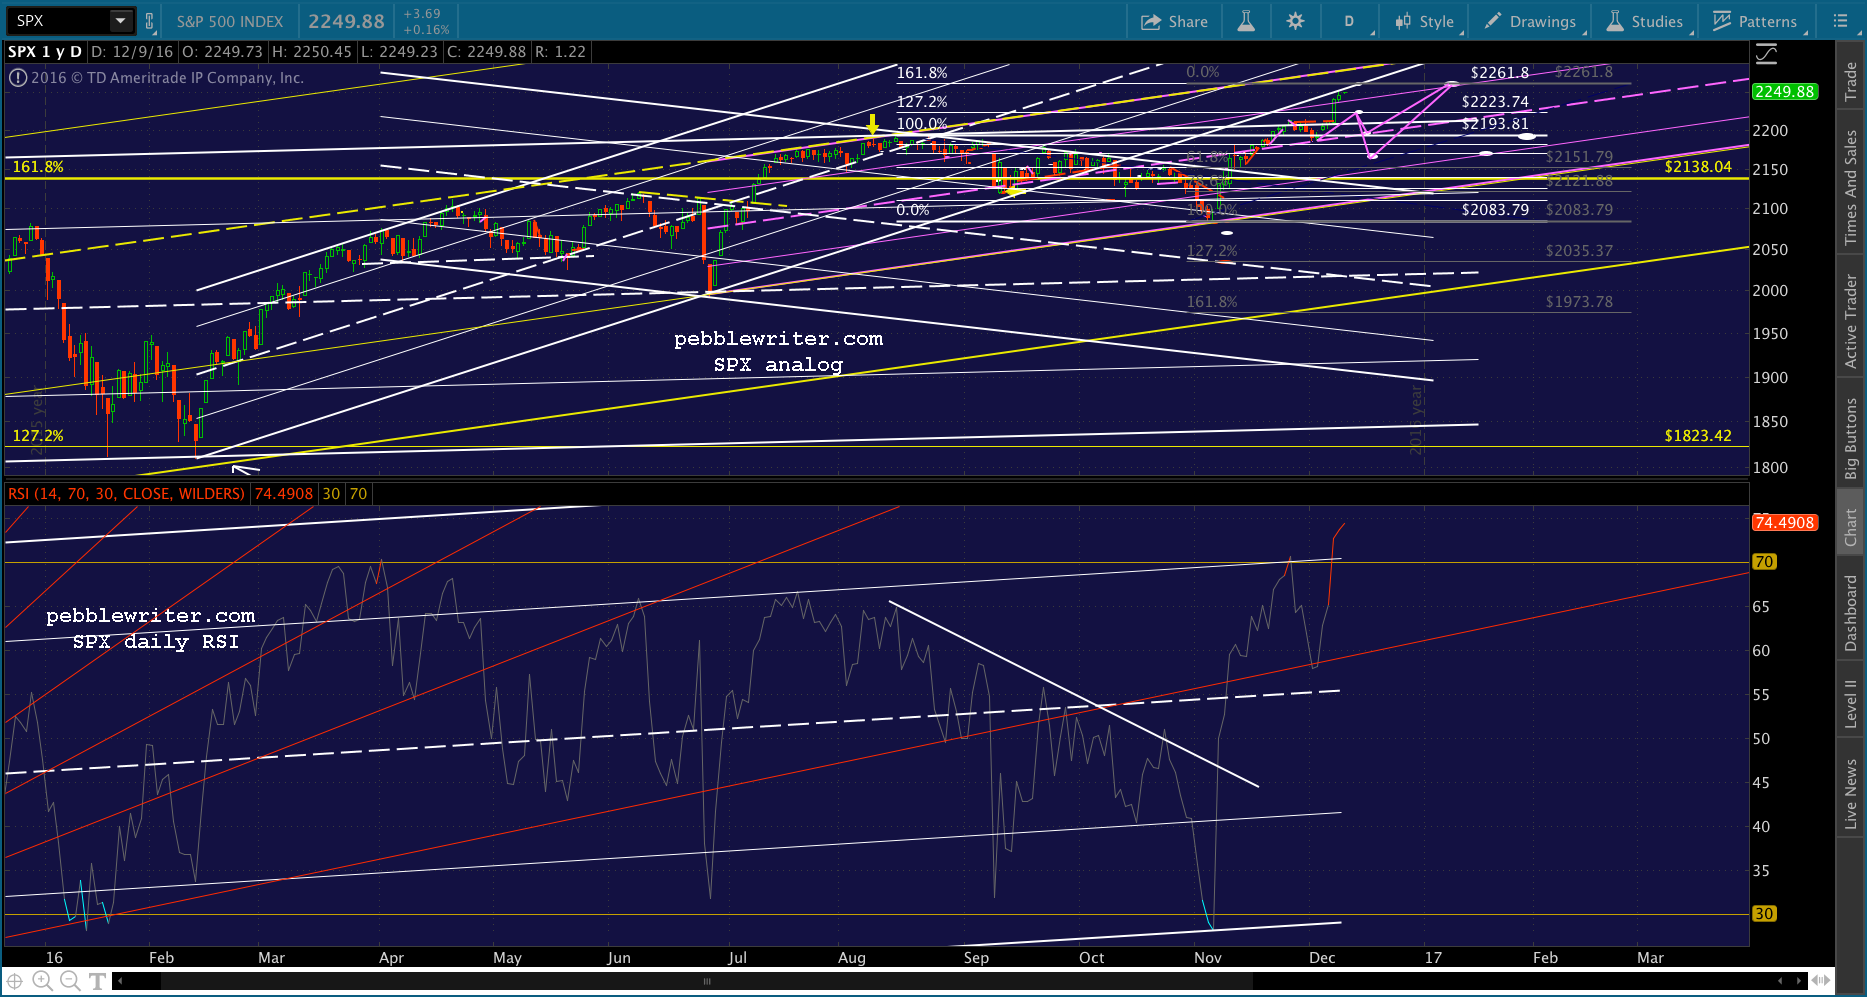 But, it can continue climbing along the underside of this steeply rising channel and still make plenty of progress toward the next Fib level that matters: the white 1.618 at 2261.80.
USDJPY is doing the same thing right now, having seen its rising purple channel break down and a subsequent backtest to new highs in order to reach the .618 at 115.592. Likewise, VIX is “breaking down” from a channel of absolutely no consequence that it constructed for the purpose of having a trend to break.
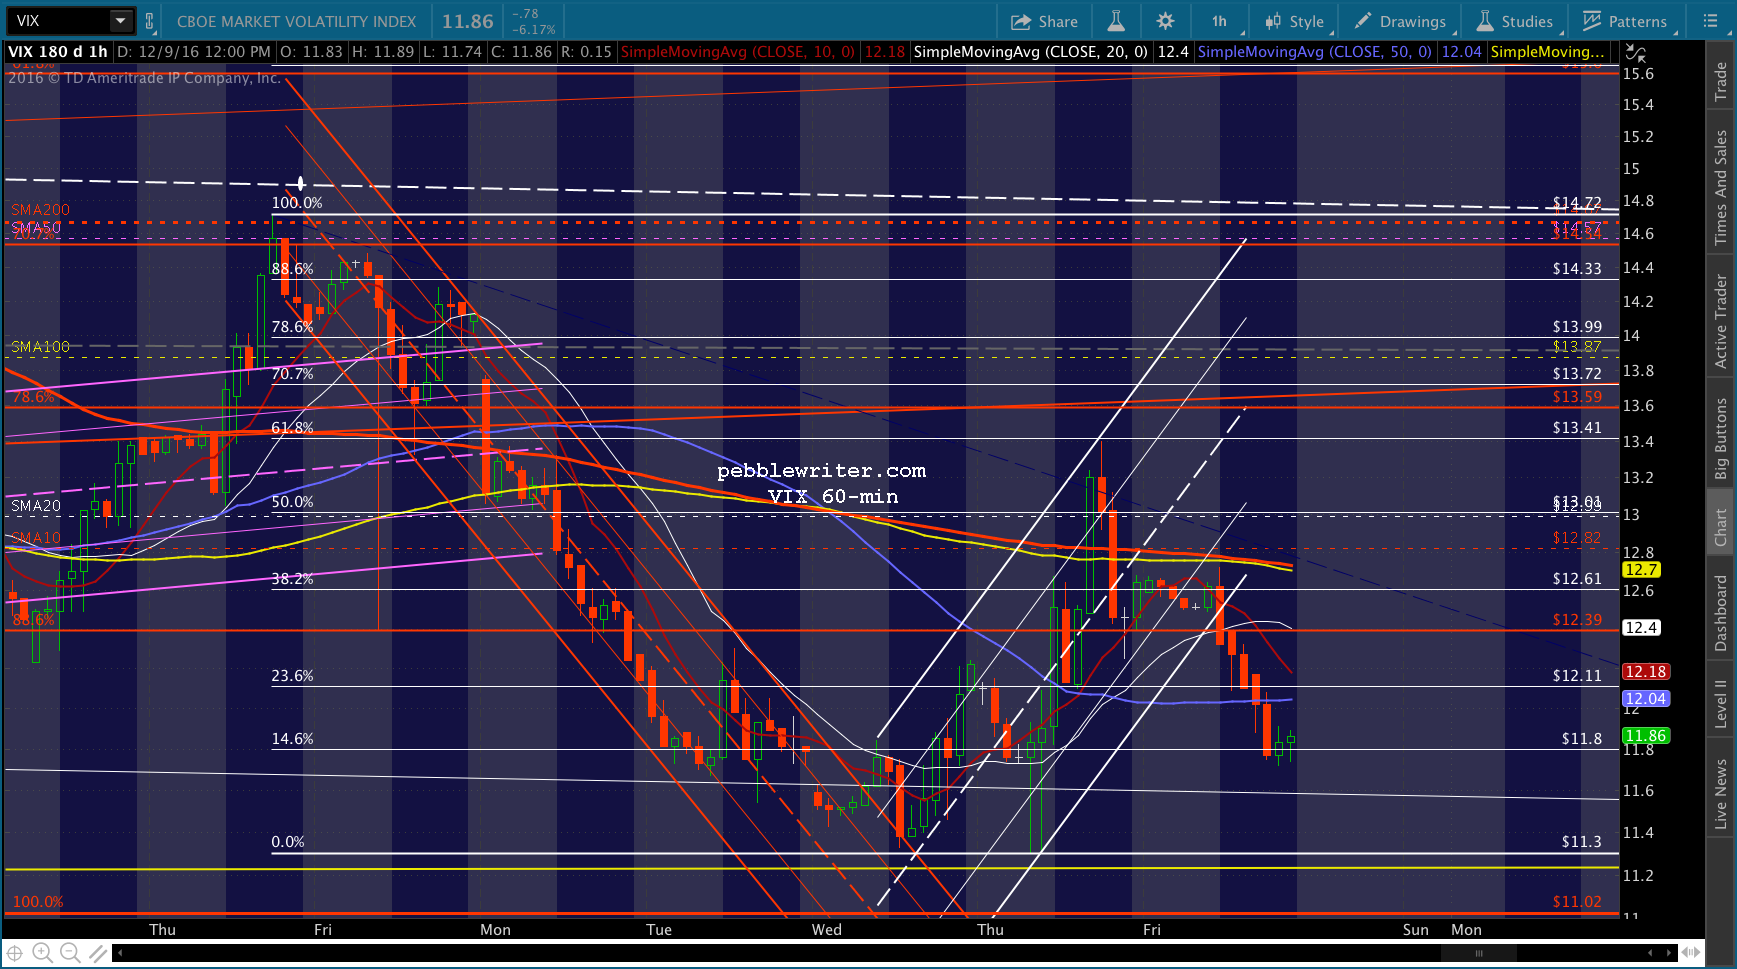
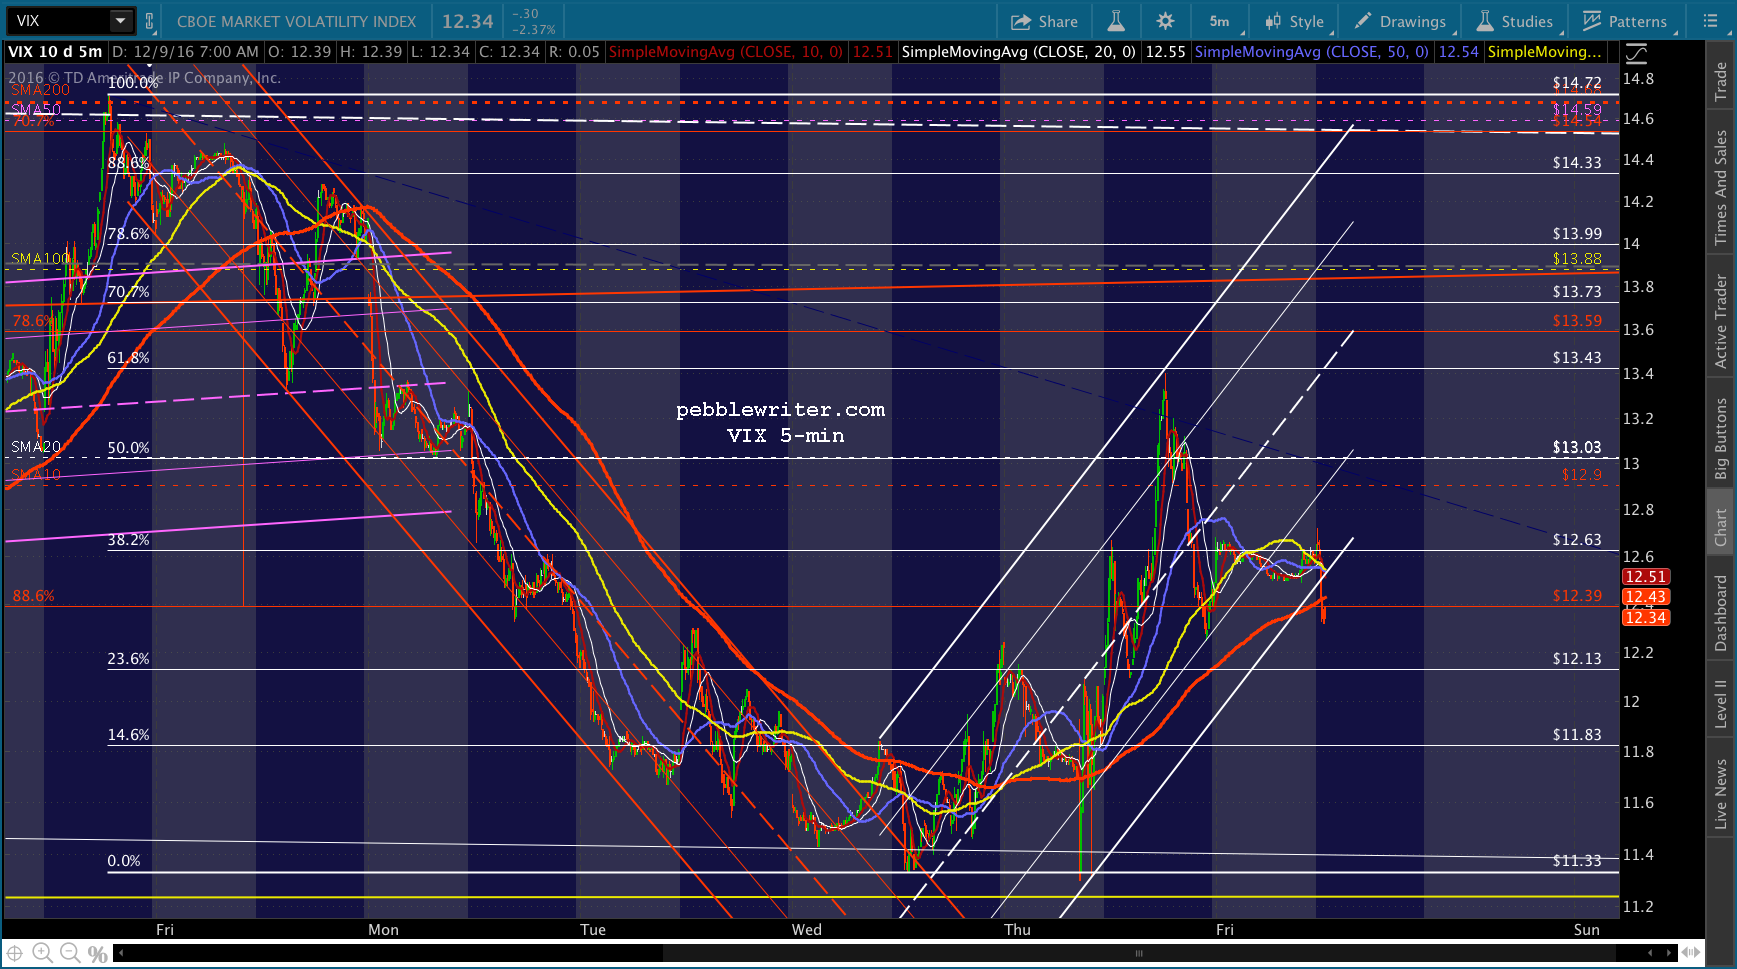 It occurred to me when I was constructing the analog that it would be impacted by the rate hike scheduled for next week. The 2015 rate hike, for instance, greatly impacted the price action into the end of the year.
SPX dropped 71 points in the two days following the announcement, then regained that much and more into the end of the year before shedding 270 over the next three weeks.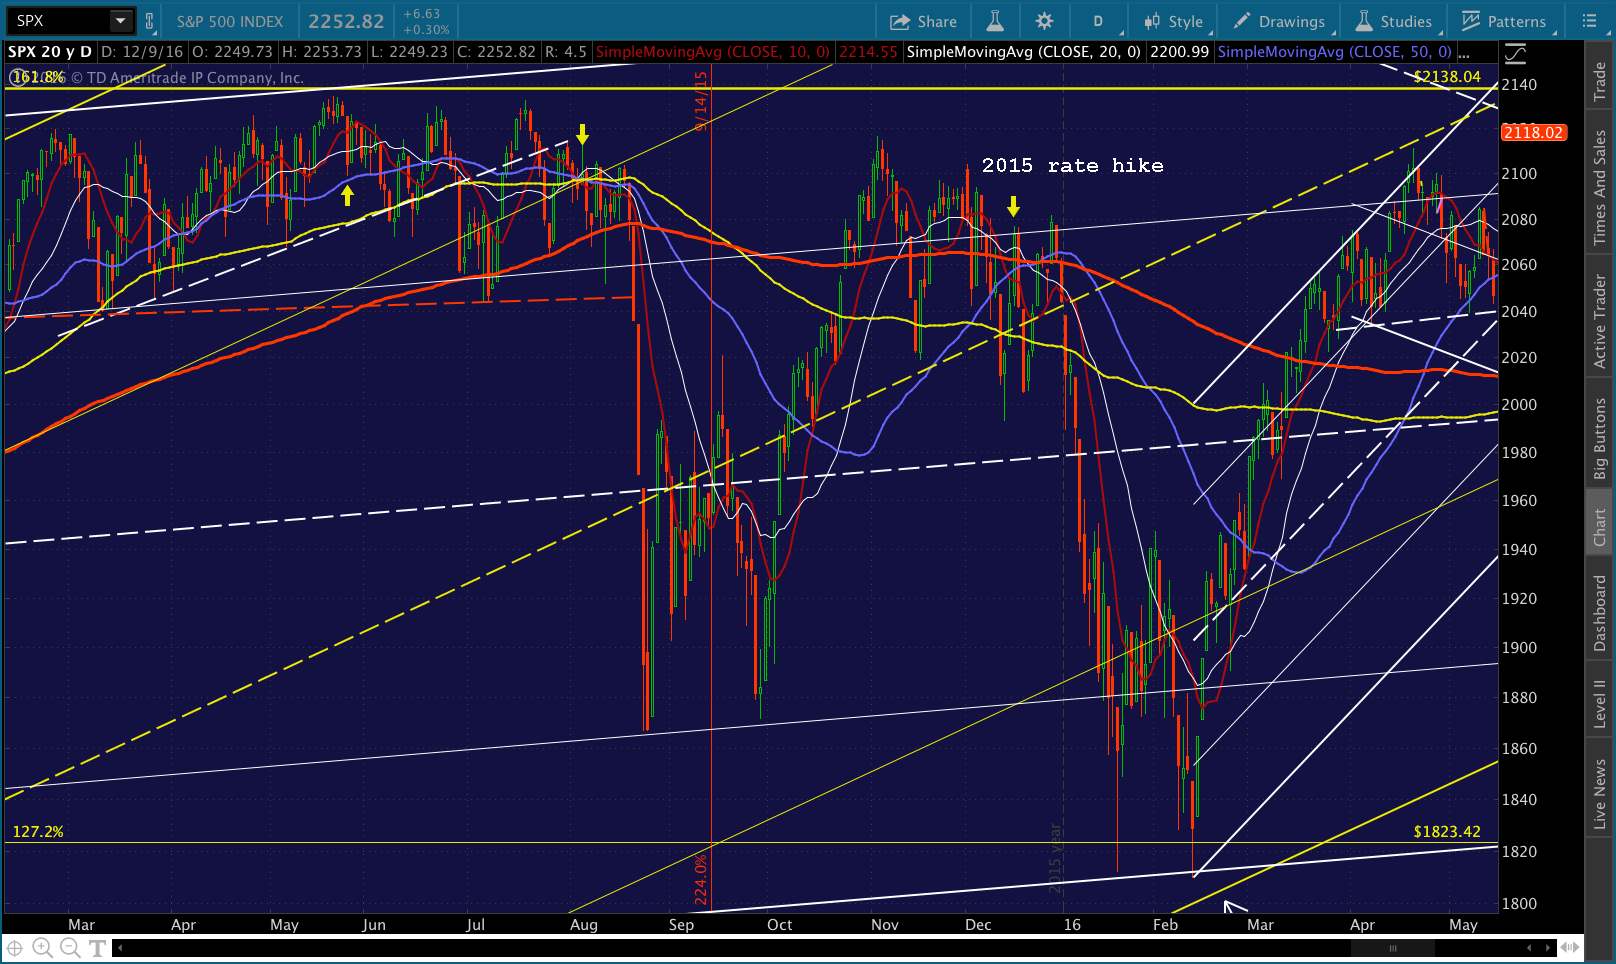 But, we’ve had no lower highs as occurred last year leading up to the announcement. In fact, we’ve had very few pauses, let alone meaningful retracements, over the past month.
When last week’s low occurred a bit early, it was a reminder that timing shifts of a day or two have not been uncommon in the analogs I’ve constructed over the past few years. We had already run into this when 2007’s day 88 lined up with our day 84 this year.
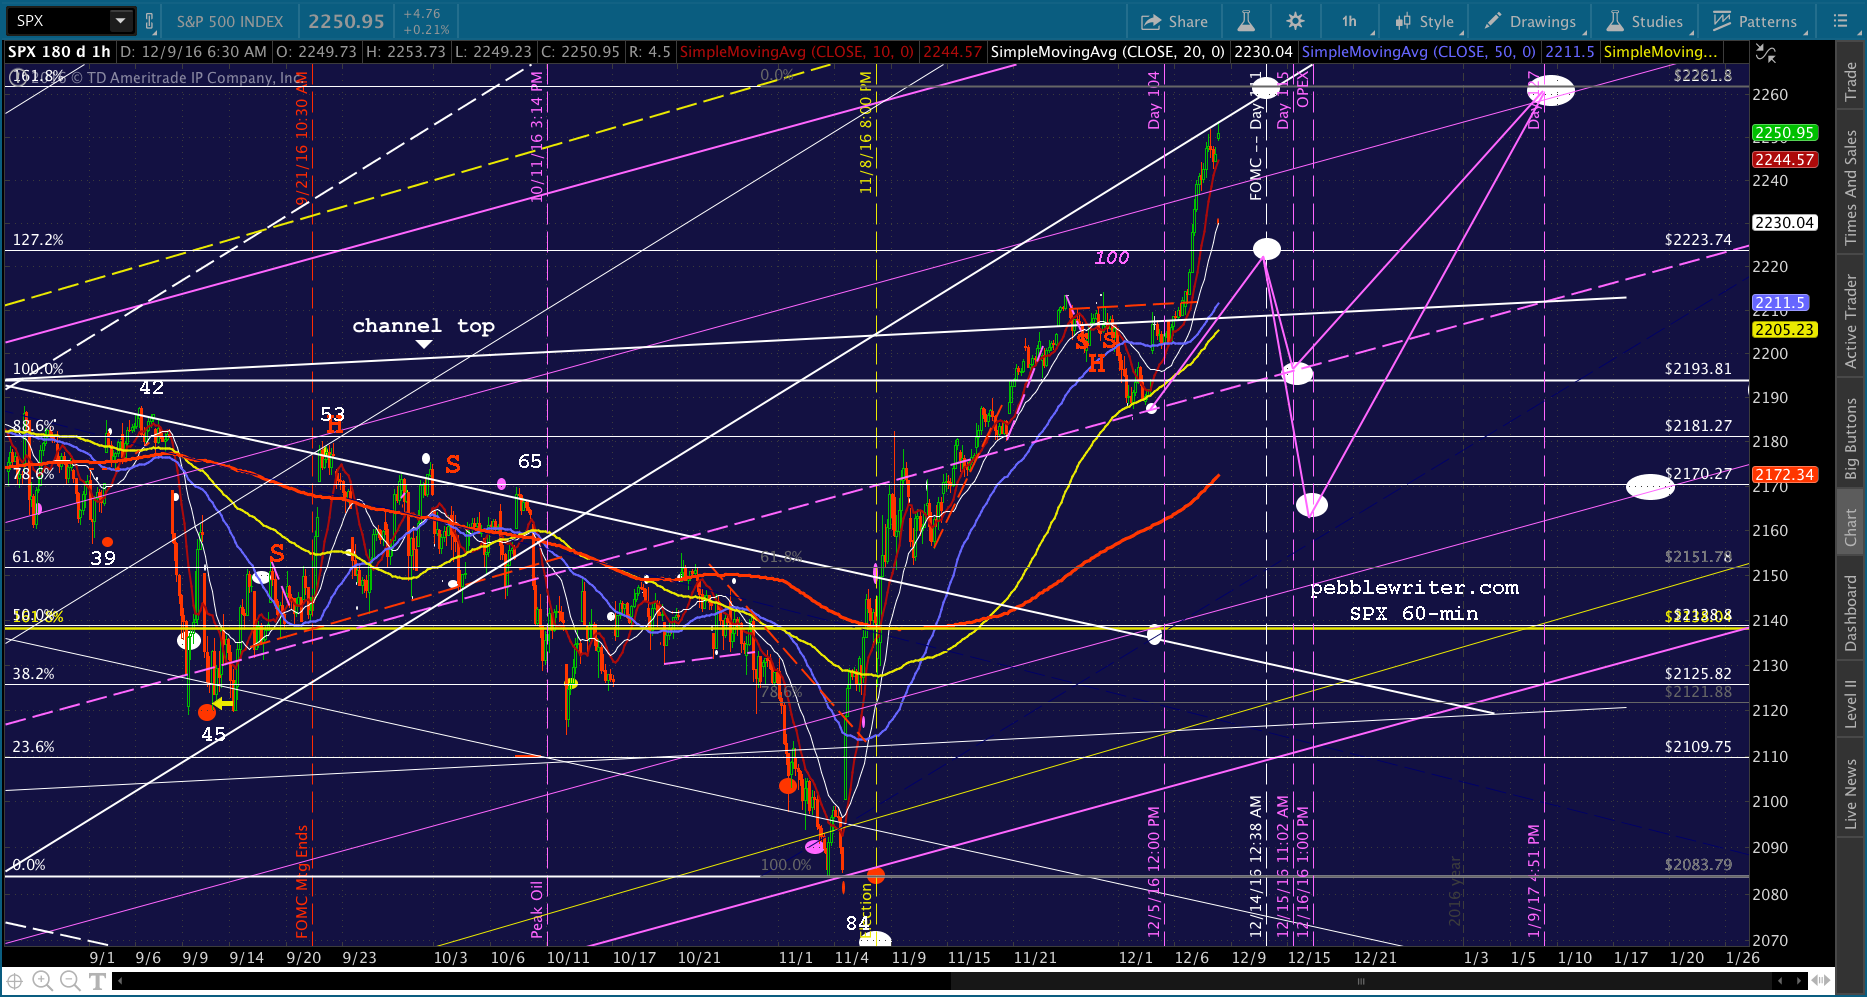 If we shift this year’s days by 2 to better line up the Day 100 high and Day 104 low, then Day 104 might have been Dec 1 instead of Dec 5. That would make today Day 110 and Monday Day 111. This doesn’t jibe, however, with the practice, lately, of ramping SPX as high as possible before potentially negative events so that any subsequent drop will be from a higher level. As we discussed earlier this week, it’s the equivalent of marking prices up before a sale.
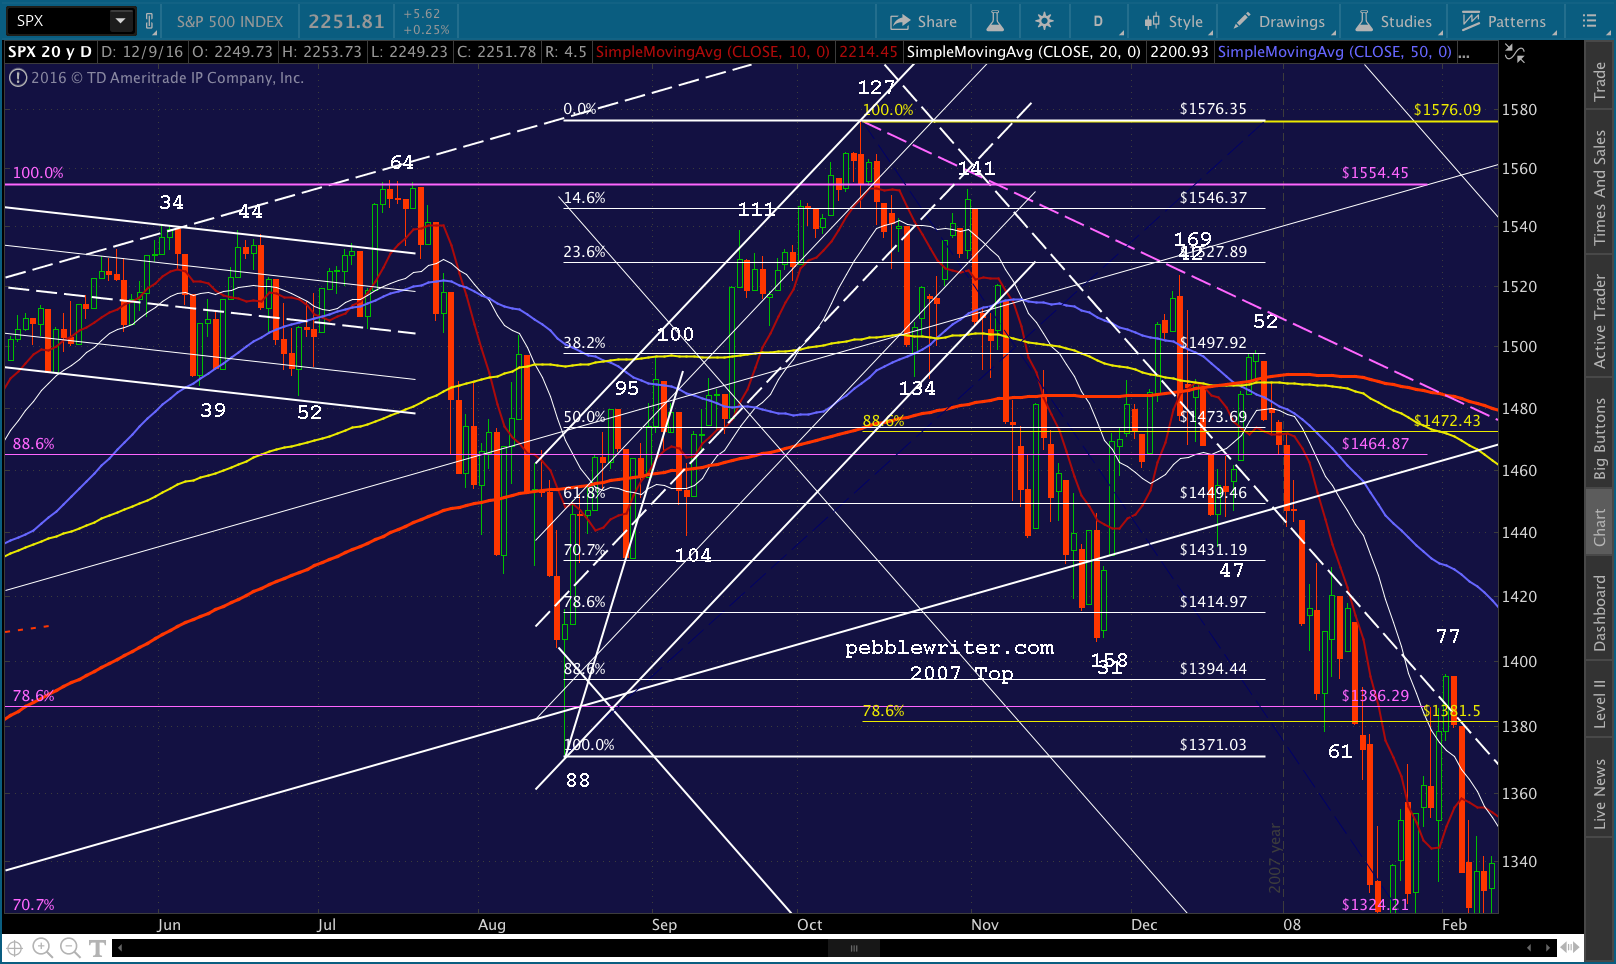 If last year’s rate hike produced a 71-pt drop in SPX, what might this year’s be worth? Central bankers have proven via Brexit, the US election, the Italian referendum and, now, the ECB taper, that they are willing and able to power stocks higher, reversing any downturns in successively shorter time frames.
Could it be as little as the 31-pt drop registered between Days 111 and 15 in 2007? Consider that broke out of the huge rising white channel on Wednesday with the 30-pt spike. It’s now about 46 points north of it.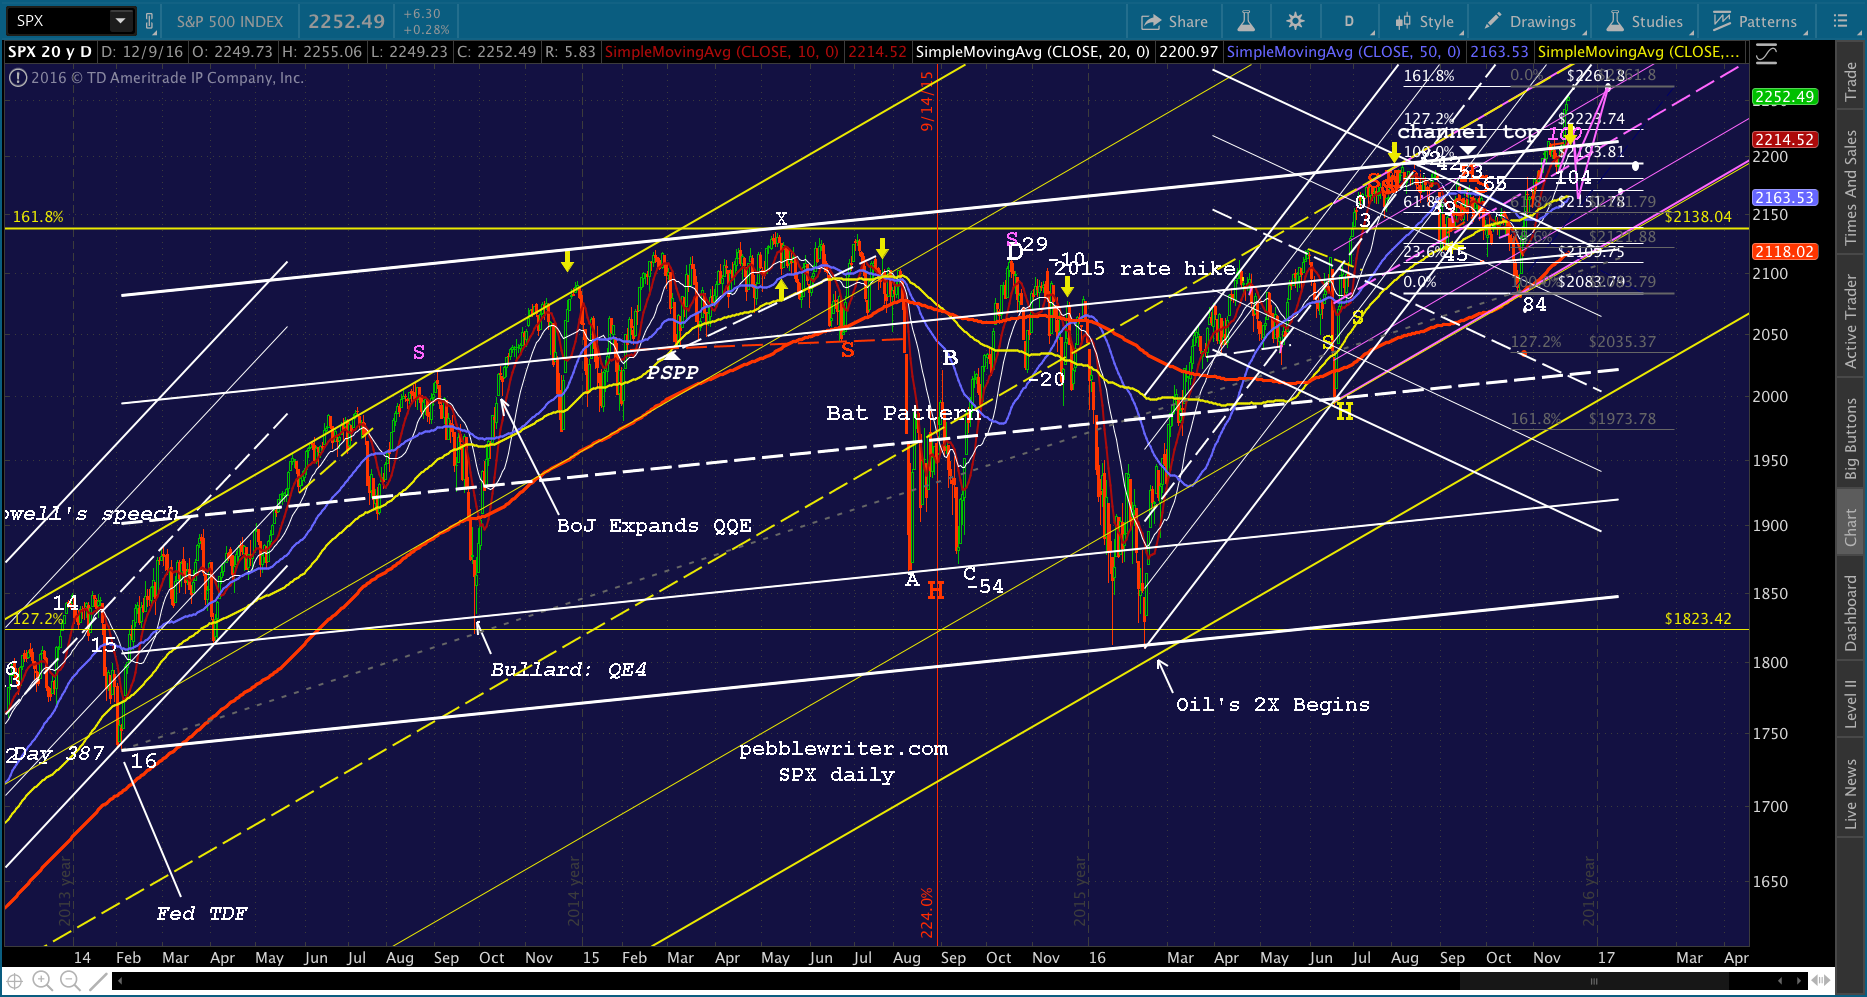 Contrast this with Day 111 in 2007 which was a .886 retracement of the July highs and we can see that things are different this time. Back then, it was all about trying to break through the year 2000 highs at 1554.45. Now, it’s all about maintaining the break outs which have already occurred: the 1.618 Fib at 2138 and the rising white channel that guided much of the past several years.
What changed, and why? Remember our 2035 target for Nov 9, the day after the US presidential election? If TPTB hadn’t gone apeshit and threw everything they had into “saving” the market before SPX opened the next morning, SPX would have reached it.
ES fell 115 points overnight from its Nov 8 highs. A 115-pt loss would have put SPX right at 2031 — right at the midline of the falling white channel it had been in since April. Instead, they decided it would be nicer to have SPX rebound at the SMA200 — a 2-pt drop from the previous day’s lows (actually, it never quite reached it — unlike in 2007 when it plunged right through it.) And, we saw the V-shaped recovery of the year in ES. I think when TPTB set out to construct the analog, they had no idea they’d be able to hold SPX to a 2-pt drop. In fact, I think they were prepared for 2031, as the drop from the previous high at 2193 would have been nearly identical to the drop in 2007 from Day 34 to Day 88.
In 2007, SPX bounced from 1371 on Day 88 to 1496 on Day 100 — 125 points. A 125-pt rise from 2031 would have put SPX at 2156 on Day 100 in 2016. 2156 on Day 100 in 2016 would have meant a .786 retracement of the drop from Aug 15, and a backtest of the SMA100. It would have been the perfect place for a backtest of the broken white channel at the 1.618 Fib at 2138 four sessions later.
If we’d had a 100-pt rally from Day 104 to Day 111 like in 2007, it would have put SPX at 2238 — which would have been exactly the 1.272 extension in the chart below. The path in yellow is largely what I expected, and is ridiculously similar to what happened except for the fact that SPX held the SMA200 on Day 86 instead of plunging below it to tag 2031 as the 2007 path suggested.
 Since all that is water under the bridge, what now? First, let’s stick with the 2-day advance. This makes today day 110 and Monday Day 111 — which would mean a small decline starting either today or Monday — perhaps from 2261.81 or just short of that to backtest either the purple channel .786 line at 2242 or the white channel top at 2209ish. I prefer the 2209 target, as the channel deserves a backtest, and better to do it before SPX is too far away.
From there, SPX would be free to rally into year-end at 2261 or even 2295.12 — the 1.618 extension that would have occurred had the election drop been allowed to play out. My preferred path is shown in yellow with alternates shown in purple.
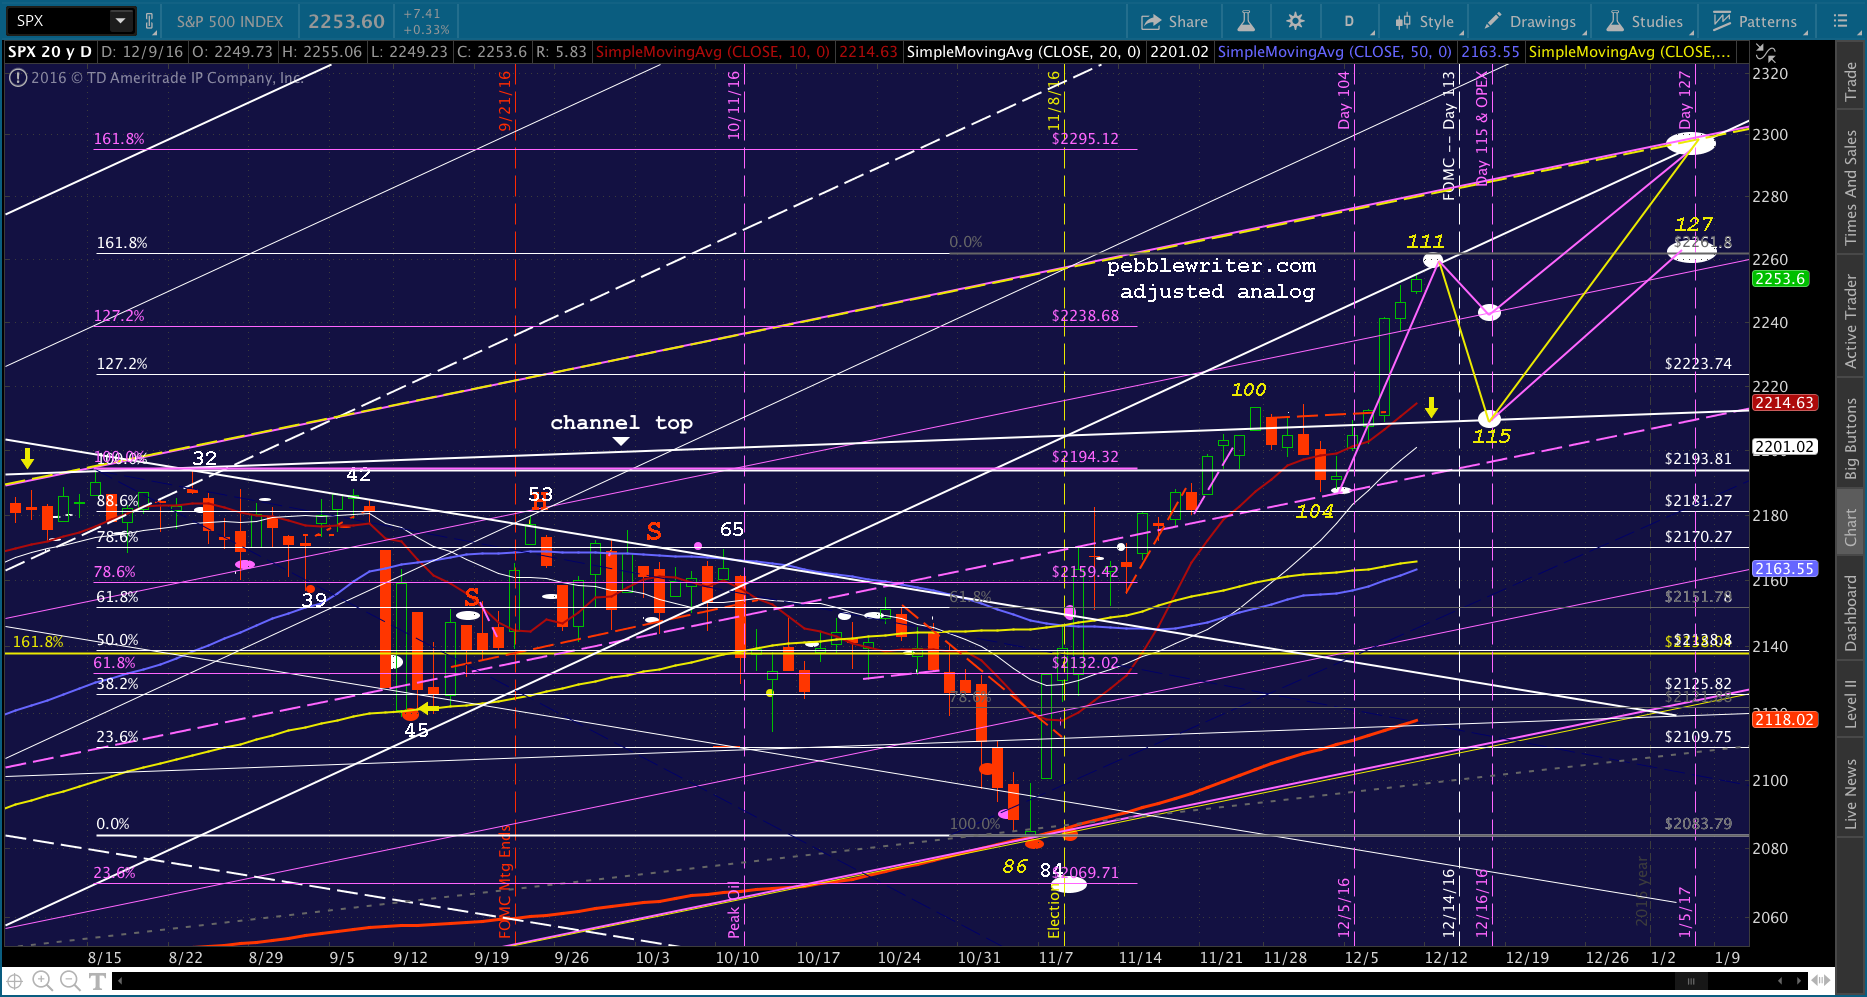 If SPX reverses today or tomorrow before hitting 2261.80, then it increases the odds of 2261.80 being the terminal target on Jan 5. If it reaches it now, it will no doubt push well past it later., with 2295.12 being my preferred target.
With that said, I’m going to take a break and clear my head, then come back and try to pick it apart. Back in an hour or so.
UPDATE: 3:30 PM
SPX has reached 2259.80, just shy of the 1.618 at 2261.80. I’d be inclined to go short here, as everything seems to be in place to facilitate a mild downturn. There’s obviously a risk that we’ll get a few more points before the close and/or on Monday. But, it’s more common lately to reverse just shy of an obvious reversal point — the purpose being to leave an upside target intact for a later spike higher.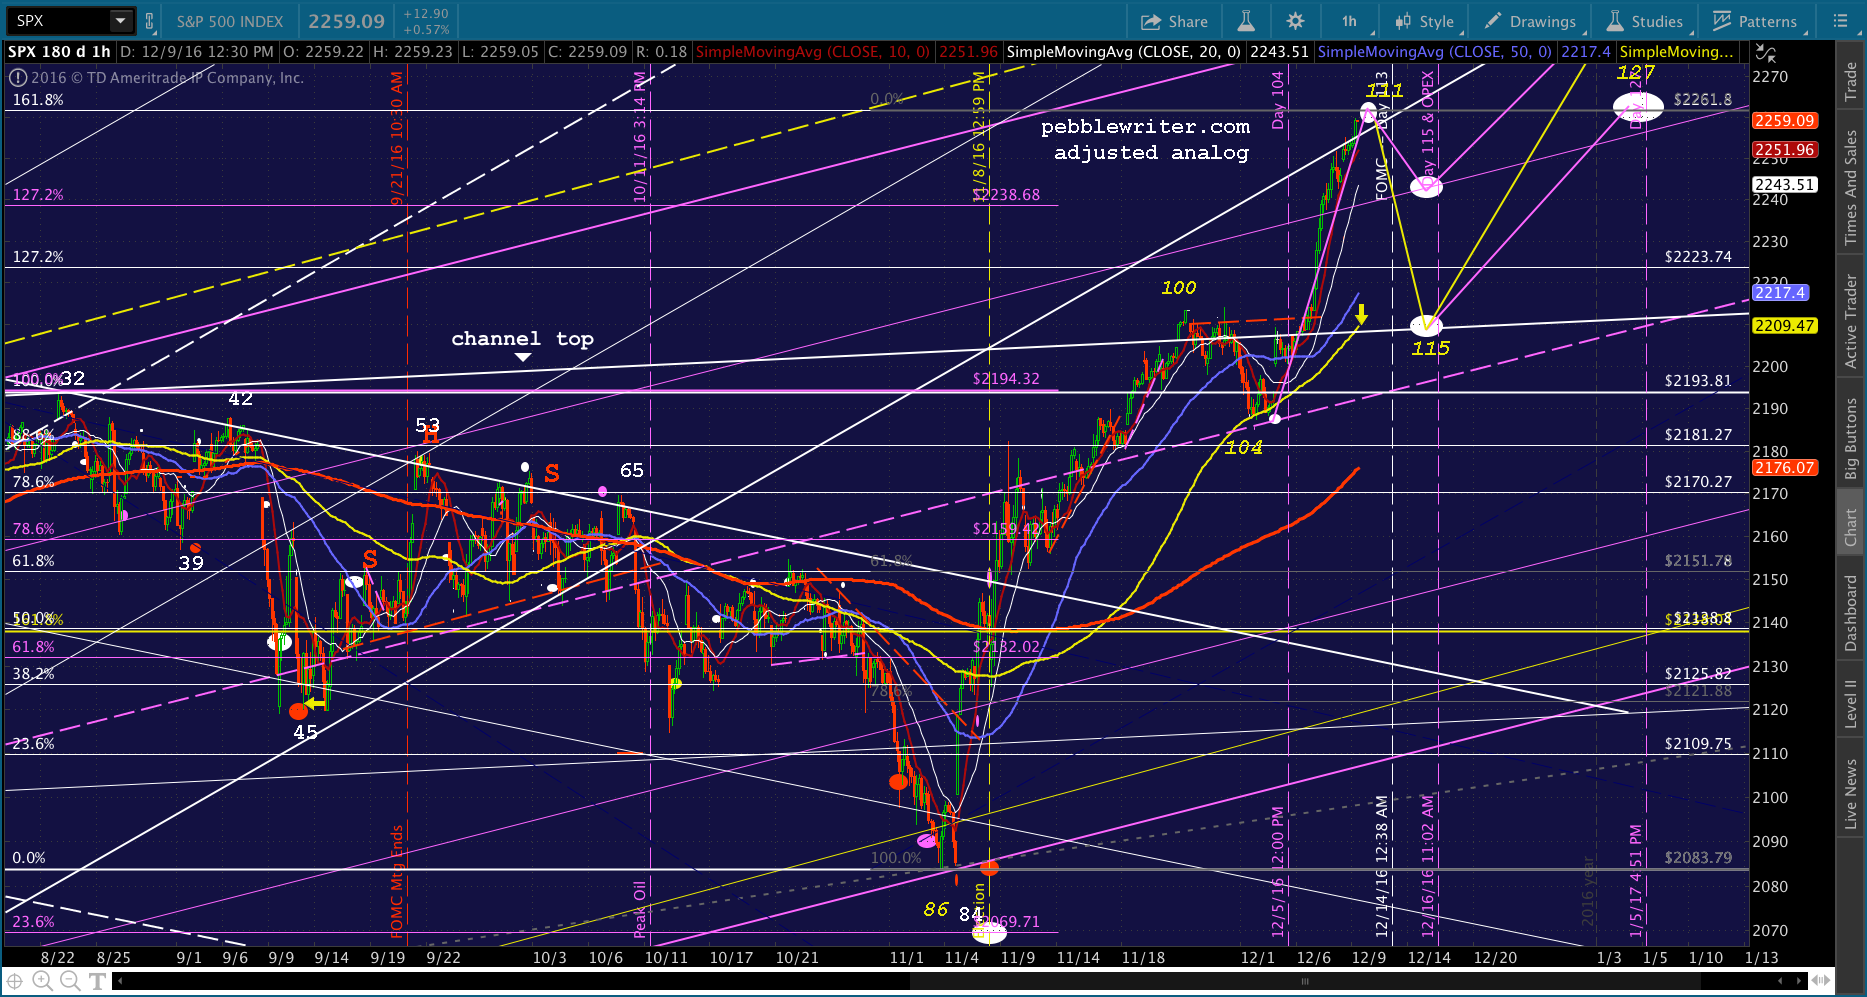
As of now, my biggest concern is that TPTB will feel they need more points “in the bank” before the FOMC decision next week. There’s a 51-pt margin between 2261 and the current SMA10 at 2210. I think it should be enough, given their ability to limit fallout and the extent to which the “market” has already priced it in.
Another concern is that Day 115 — the day we should finish that sell off — is also OPEX. It’s certainly not unheard of to reach lows on OPEX; but, it’s unusual.
I have some family obligations to tend to, so will sign off for the day. I should get a chance to update several charts over the weekend. I’ll also be obsessing over the analog, and what might go wrong.
Until then, good luck to all.
Comments
2 responses to “Analog Update: Dec 9, 2016”
PW nice call on the 1392 RUT target so far. Appears to be solid resistance for now
Thanks. Not sure what “solid” means these days, but we’ll take it as a win for now.