Year: 2015

  • Charts I’m Watching: Jan 20, 2015

    Friday’s SPX lows got a little closer to the red .886 target at 1986.35: 1988.12 vs 1988.44 on Thursday.  Sometimes it’s hard to time the USDJPY ramp job just right. USDJPY tacked on 1.90 Friday, and another 1.16 Friday’s post-Friday’s close.

    2015-01-20-USDJPY 15 0605In last night’s leg up, it broke out of the falling red channel — enough to give futures an 11-pt boost (back down to 6 points as of this writing), on top of Friday’s rally. 2015-01-20-USDJPY 60 0605

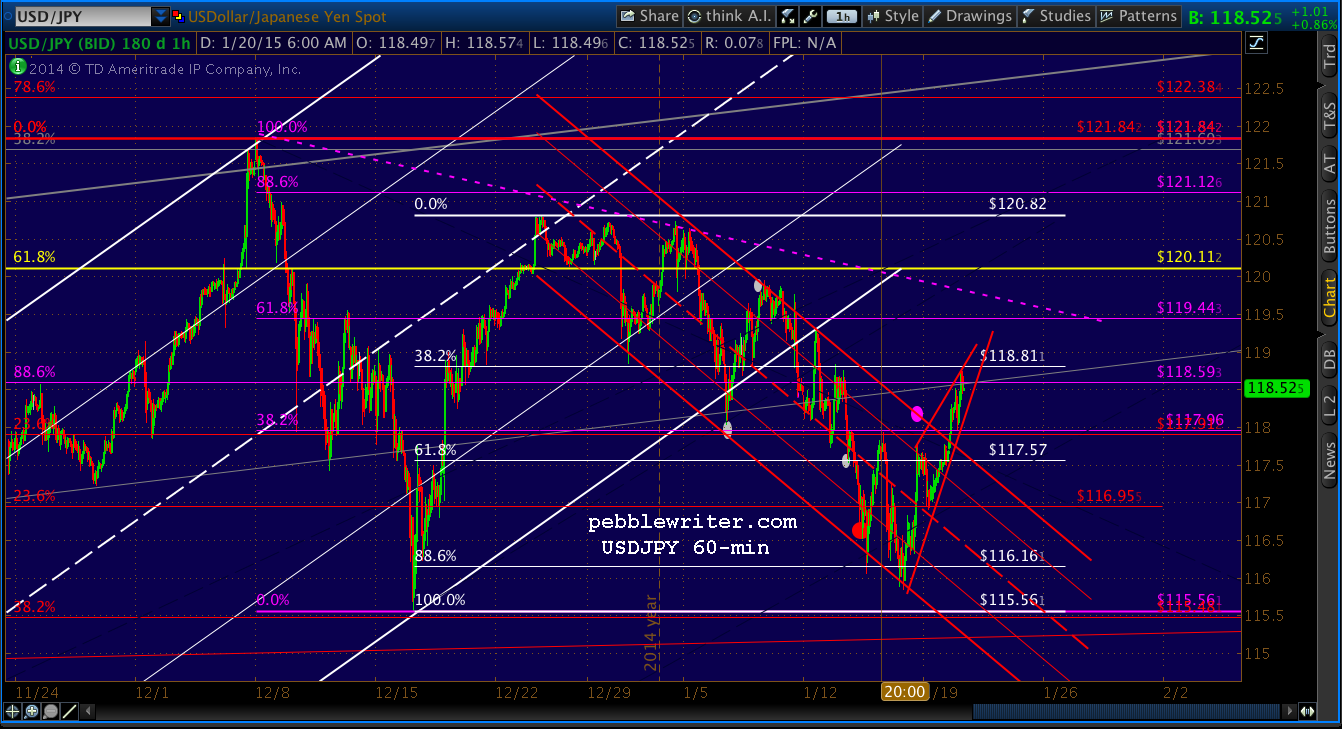
    Friday morning’s initial dip helped establish a broader potential falling channel, shown below in white.  The red channel took the pair to the midline, and this morning’s rally tests the upper bound.

    If the upper bound holds, then this morning’s rally in stocks should burn out quickly after testing the SMA10.2015-01-20-USDJPY 4hr 0605If USDJPY holds, or punches through the channel top, then SPX’s upper targets include a backtest of the broken white channel.

    2015-01-20-SPX 30 0600A little over a week ago [see: Jan 12 Update] we discussed the likely path USDJPY would take, and the ramifications on stocks.

    I think USDJPY (118.34) is stuck.  I think TPTB have probably reached a limit on further yen decimation, and are trying to hold it in a range of 115-120 in order to prevent further SPX declines…If a floor can be established until the ECB begins QE — then, all is well.  SPX will be propped up.  If the floor gives way, SPX should go down and test the SMA200 (currently 1962) as we discussed last week.

    USDJPY did, indeed, ultimately find support this past Thursday at 115.84.  This enabled SPX to be propped up, leading to the little double bottom that couldn’t quite reach a simple Fib level.

    Gotta love our unrigged markets…

    UPDATE:  9:54 AM

    Speaking of which — USDJPY just reached the bottom of its little rising wedge…

    2015-01-20-USDJPY 15 0653…meaning SPX should find support at the white TL after this morning’s sharp reversal.  If not, the SMA100 is just below at 2007.85.

    2015-01-20-SPX 5 0652UPDATE:  10:16 AM

    The consolidation we’ve expected over the past two weeks has been driven almost entirely by the USDJPY.  It’s essentially out of gas, meaning some other device has to come along to prop up stocks: the EURUSD.

    The ECB is widely expected to announce new easing measures on Thursday the 22nd.  If they do, the EURUSD will pick up where the USDJPY left off.  If not, then the “market” is — what’s the technical term? — oh, yeah…screwed.

    In between now and then, I imagine we’ll get a series of stick saves courtesy of the USDJPY — which will ultimately settle into the trading band discussed above.

    More shortly.

    UPDATE:  11:04 AM

    A little deeper into the lower bound for USDJPY…

    2015-01-20-USDJPY 30 0800
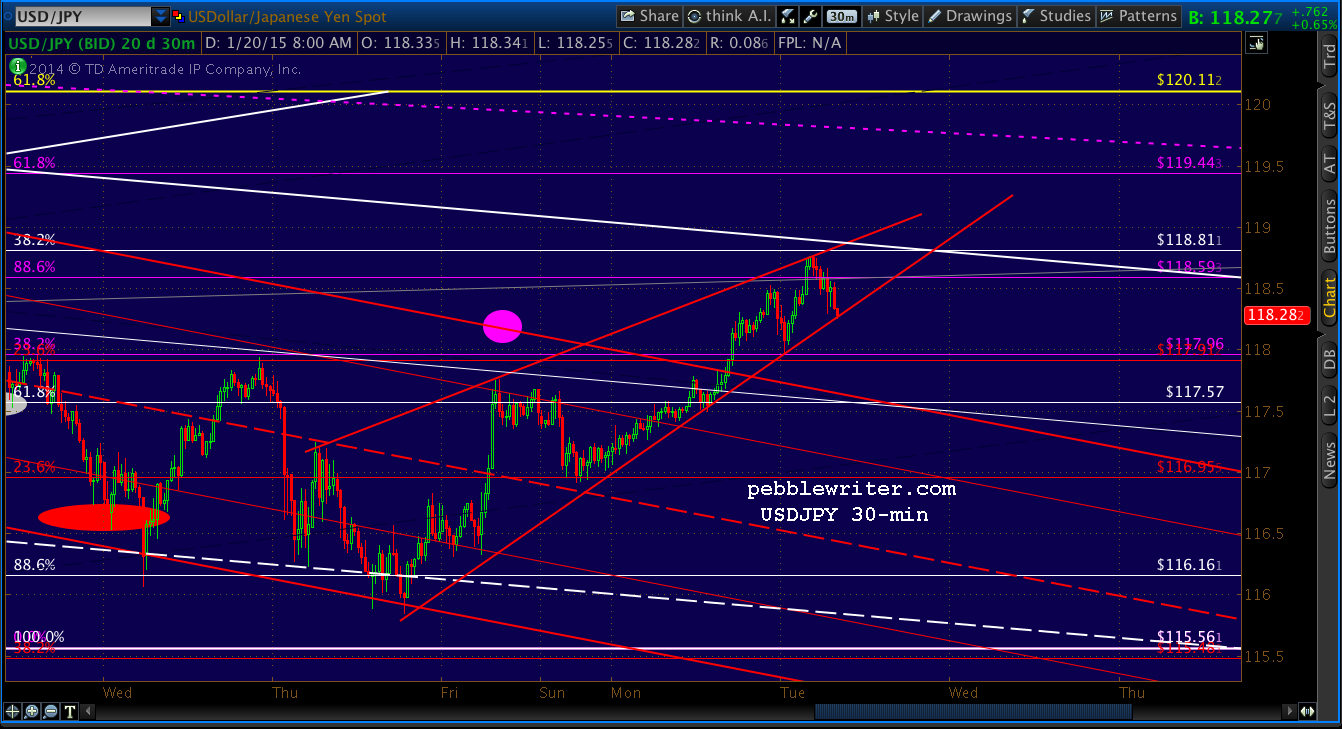
…means a tag of the SMA100 for SPX.

    2015-01-20-SPX 5 080411:40 AM

    As discussed above, the presumption is that the ECB will come through with massive QE on Thursday, and stocks will be off to the races.  If not, the downside could be substantial.  We’ll take a moment, here,  to pinpoint some potential targets.

    continued for members(more…)

  • The Day After

    TPTB have done a remarkable job keeping the earth from shattering.  But, of course, all those margin calls are being dealt with this morning.  So, we’ll see just how big a deal it was over the next 7 hours or so.

    We suggested faded yesterday’s opening highs (2013ish), which proved to be the smart play.  From our initial post:

    I’d fade this morning’s rally at the first opportunity, with an initial target of the SMA100 at 2007, and a secondary target that .886 at 1986.35 that we didn’t quite tag yesterday.

    SPX tried to rally multiple times — with the usual nudges from USDJPY and VIX — but, managed to close at the lows yet again (1991.47.)  Futures are off about 5 points at this writing.  So, I suspect we’ll finally tag our downside target of 1986.35 that was narrowly missed on Wednesday.

    2015-01-16-SPX 30-0600If that doesn’t hold, our remaining targets remain in force from earlier in the week.

    continued for members(more…)

  • Hey Buddy, Wanna Buy a Rolex?

    The last comment I wrote in yesterday’s members’ section:

    The reality is, I expect a very nice bounce here — with that 2030 level (1:54 update above) looking good for the next big move.  But, the headline risk has been pretty substantial lately.  As such, I wouldn’t carry any position overnight unless you have the means to hedge and/or monitor it closely.

    The initial ramp job after the market closed was spectacular, with ES gaining about 23 points.  Then, the SNB peed in the punch bowl, essentially decoupling from the euro.  ES dropped 42 points in a jiffy, and is only up a few points because of the plunge protection team’s efforts — a rally of 28 points.

    Is it legitimate?  No.  Does it make sense?  Hell, no.  Will it last?  Ah, that’s the question.  Probably not.  Here’s where we left off yesterday, with nearly every intra-day call working out beautifully.

    2015-01-15-SPX 30 0625A rally up to 2030 made sense because of the key Fib levels and channel patterns in play.  But, the Swiss just removed a big chunk of the carry trade architecture.  So, while their move increases the likelihood of ECB QE (why else would they hit the panic button like this?) it puts a dent in the portfolios of those who were short the swiss franc (CHF) as part of the carry trade.

    I’d fade this morning’s rally at the first opportunity, with an initial target of the SMA100 at 2007, and a secondary target that .886 at 1986.35 that we didn’t quite tag yesterday.  I suspect they (and by they, I mean every central banker) will be working overtime to contain the damage.

    I say “contain,” because lower prices were already in the script — just not yet.

    continued for members(more…)

  • Charts I’m Watching: Jan 14, 2015

    Yesterday was a wild ride for SPX.  It took off in the morning, overshooting our upside target by 7 points.

    2015-01-14-SPX 30 0600But, our 9:40 top call proved accurate, and SPX maxed out at 2056.93.

    SPX just sliced through the SMAs and tagged 2054.75.  It should top out between here and 2059 — the .886 of the drop and a backtest of the rising white channel.  I’d be very careful about chasing it any higher.

    It subsequently dropped to our downside target of the day, a plunge of 48 points to the .786 & SMA100 combo at 2008.  I had actually expected it to come the following day (today.)

    IMHO, this morning’s rally is overdone.  But, the algos are propping it up.  As such, I suspect any initial slide will be limited to a backtest of the SMAs — unless USDJPY reverses soon.  But, odds are its reversal will come after the close and not affect SPX…The problem is that it should drop further.  But. again, that could happen after the close without affecting SPX.

    The bounce from there, again, overshot our upside target of 2020, but didn’t have enough juice to keep going and settled back to close within the falling red channel.

    …SMA100 tag for SPX, we should see a nice bounce here.  How far will depend on many factors, but I’d say at least back to the .618 at 2020.  Beyond that, the rising white TL comes back into play.

    All in all, a quite bearish 48-point drop from its initial 23-point ramp.

    On to today…

    USDJPY reached our 116.68 target overnight — and, then some. This was the downside target we set on Monday, (the red circle) so the timing turned out pretty good.

    The .786 would have kept the pair in our falling red channel, but this morning’s retail sales numbers were just too dreadful.

    2015-01-14-USDJPY 60 0615The e-minis are following suit, currently off 23 after being down about 30 points earlier.  SPX looks destined to reach the .886 (2000.65) we’ve been targeting.  If it overshoots — and, there’s a decent chance — there’s channel support down around 1986ish.

    2015-01-14-SPX 30 0600UPDATE:  10:00 AM

    SPX came pretty close to our initial downside target: 2001.38 versus 2000.65.

    2015-01-14-SPX 30 0700USDJPY’s bounce at the .886 should provide a bounce for SPX as well.  From there, it starts getting interesting.

    continued for members(more…)

  • Charts I’m Watching: Jan 13, 2015

    The overnight session in USDJPY nearly reached our next target — the white .618 at 2019 (formerly red, and the key .618 at 120.11 is now drawn yellow.)

    2015-01-13-USDJPY 60 0600But, it was already testing the SMA50, and today’s open was approaching.  The big bounce does nothing to change my best take on the developing channel plot.  In fact, it helps confirm it.

    2015-01-13-USDJPY daily 0600pngSPX reached our downside target offered last Friday [see: CIW Jan 9, 2015]  a bounce in USDJPY would produce one in SPX.

    One strong scenario would be a dip to the target we mentioned yesterday: the gap at 2029.61.  It’s roughly the purple .382 and would be a nice head fake.

    And, as updated yesterday:

    We’ll find out shortly whether or not it’s a head fake.  I suspect SPX might be in for a tag of the .618 at 2019, but the gap is closed.  So, we could get a bounce at any time.   USDJPY plunged quickly, but is holding above the recent lows.  If it bounces off those lows, SPX should bounce up and backtest the moving averages (2045ish) at least.

    With the eminis showing +14 at present, it appears SPX has an excellent shot at testing those moving averages — the 10, 20 and 50-days, all in a tight spread now of 2045.66-2047.23.

    2015-01-13-SPX 60 0605One potential game changer is oil, which overnight moved through and is now rebounding back to the TL from 1998 we identified last week [see: Update on CL Jan 7.]  If the decline is arrested in a meaningful way, it should provide a strong boost for the algos.

    2015-01-13-CL 60 0600The key price is around 46.11, though any break of the TL off 49 would be a great start.

    UPDATE:  9:40 AM

    SPX just sliced through the SMAs and tagged 2054.75.  It should top out between here and 2059 — the .886 of the drop and a backtest of the rising white channel.  I’d be very careful about chasing it any higher.

    2015-01-13-SPX 15 0640In the same vein, CL just reached the 1998 TL as drawn, intersecting with a smaller TL off last week’s highs.

    2015-01-13-CL 60 0700And, USDJPY just reversed back below a small TL off Friday’s highs it had momentarily broken through — demonstrating for the umpteenth time how sensitive the algos are to an uptick in USDJPY.

    2015-01-13-USDJPY 15 0705Will we get the drop to 117.57 now?  Stay tuned.

    UPDATE:  10:15 AM

    Nice reversal for SPX so far off its earlier highs.  Note the sensitivity to USDJPY — the thin purple line.

    2015-01-13-USDJPY 15 0716It always amazes me how sensitive SPX is to upside moves in USDJPY, now matter how minor.  In the old days (pre-2013!) moving averages mattered.  Today, just a hint of recovery for USDJPY is enough to blow through them like they weren’t even there.

    IMHO, this morning’s rally is overdone.  But, the algos are propping it up.  As such, I suspect any initial slide will be limited to a backtest of the SMAs — unless USDJPY reverses soon.  But, odds are its reversal will come after the close and not affect SPX.  Keep an eye on CL, which would work just as well in providing the levitation.

    UPDATE:  12:45 PM

    I underestimated the reversal.  Instead of the SMAs, SPX just conducted a backtest of the broken TL off the mid-Oct lows.  It should bounce here at 2037ish, as long as USDJPY will play ball.

    2015-01-13-SPX 30 0945USDJPY has reached the midline of the falling red channel.  The problem is that it should drop further.  But. again, that could happen after the close without affecting SPX.

    2015-01-13-USDJPY 15 0933If the TL doesn’t hold, we’re probably looking at 2019.

    UPDATE:  2:20 PM

    USDJPY did drop further, in fact right to our earlier target.

    2015-01-13-USDJPY 15 1119Which means SPX just nailed this morning’s target, too.

    2015-01-13-SPX 30 1119It’s a stunning 48-pt intraday reversal that happened much faster than I can hardly imagine.  Coming up, implications.

    continued for members

    (more…)

  • Charts I’m Watching: Jan 12, 2015

    SPX overshot Friday’s initial downside target of the SMA20/SMA50 levels, but bounced back to the SMA10 as expected just prior to the close.

    2015-01-12-SPX daily 0600

    USDJPY continues to bounce around south of the key .618, and fell right to the purple .886 at Friday’s close.  It dipped below yesterday, but bounced back above overnight.

    2015-01-12-USDJPY 60 0620Last night’s high helped legitimize the falling red channel, but it must still be taken with a grain of salt.  As sloppy as it looks, we’ve seen too many bounces back into the rising white channel to discard that bullish trend just yet.

    2015-01-12-USDJPY daily 0620And, though DX looks like it’s pulling back here, I can find no concrete chart pattern to serve as a ceiling at this price level.

    2015-01-12-DX daily 0600In fact, EURUSD looks like it has further to fall.

    2015-01-12-EURUSD daily 0600And, that’s the big question, isn’t it?  Whether or not the ECB will finally begin QE in earnest.  They’ve certainly talked it to death, and the MSM has dutifully reported even unsourced rumors as fact — much to the algo-driven markets’ delight.

    We won’t know until the 22nd.  And, since nothing else matters near as much as what central banks might or might not do, we should continue to see this pattern of consolidation continue.

    Targets coming up

    UPDATE: 10:00AM

    As I was generating a chart reiterating our second downside target from Friday, SPX just plunged to reach it.

    2015-01-12-SPX 60 0700From Friday’s 10:00AM post:

    Our 2046 target and the most interesting looking channel are seemingly at odds.  Perhaps a bounce at the SMAs and sideways for a while — ping ponging with the SMA10?  We’ll see.  One strong scenario would be a dip to the target we mentioned yesterday: the gap at 2029.61.  It’s roughly the purple .382 and would be a nice head fake.

    We’ll find out shortly whether or not it’s a head fake.  I suspect SPX might be in for a tag of the .618 at 2019, but the gap is closed.  So, we could get a bounce at any time.

    USDJPY plunged quickly, but is holding above the recent lows.  If it bounces off those lows, SPX should bounce up and backtest the moving averages (2045ish) at least.  If it continues to flesh out the falling red channel…look out below.

    2015-01-12-USDJPY 60 0705continued for members… (more…)

  • Charts I’m Watching: Jan 9, 2015

    Yesterday’s rally went beyond our target for SPX, topping out at 2064 before closing at 2059.  From yesterday’s pre-opening post:

    This morning’s surge looks likely to reach the SMA20 and/or SMA50 (in yellow) with the next major upside resistance the purple channel midline where it intersects the purple .618 and SMA10 at 2057ish.

    2015-01-09-SPX daily 0600The close-up:

    2015-01-09-SPX 15 0600As expected, USDJPY led the way.  The early morning sell-off was quickly recovered and a modest rally was maintained throughout the trading session — just enough to keep the algo reaction going.

    I suspect the sell-off in the last hour has been all about legitimizing the rising purple channel within the larger white channel.  But, the red channel is a factor to contend with until USDJPY breaks out — if it’s going to.

    But, it came undone overnight, briefly dipping below the rising white channel bound and giving additional credence to the falling red channel.  The key white .618 at 120.11 remains unscathed.

    2015-01-09-USDJPY 30 0600Futures followed along most of the night, off 7-8 just prior to the employment report, which provided a quick boost back to green — but, is since fading.

    continued for members(more…)

  • Charts I’m Watching: Jan 8, 2015

    I guess we’ll call this one the Evans Rally (as opposed to October’s Bullard Rally and December’s Yellen Rally. Last night, Charles Evans told reporters that  “raising rates would be a catastrophe” and hinted that the first rate rise wouldn’t come until 2016 or later.

    This came barely 6 hours after the Fed’s minutes were released — the same minutes that pointed an accusatory finger at the ECB and BOJ for talking up markets:

    In their discussion of financial market developments, participants observed that movements in asset prices over the intermeeting period appeared to have been importantly influenced by concerns about prospects for foreign economic growth and by associated expectations of monetary policy actions in Europe and Japan.

    Oh, well; it ties a nice, pretty bow on our forecast.  Yesterday’s call was for a backtest of the rising wedge lower bound.  From the members’ section:

    The biggest obstacle will be that white TL off the October lows.  Originally support for a potential rising wedge, it is now resistance. I show it at around 2020-2022, which would mean a pop and drop this morning.  If SPX is able to clear it, then it should be good for a return to test the SMA50 and/or SMA20 at 2041/2044.  Otherwise, our downside targets start to look more interesting.

    So far, SPX is following that script pretty closely.  The original backtest was at 2024 (in white, below), a smidge over our target, whereupon SPX tumbled to 2012 before being rescued by USDJPY.

    2015-01-08-SPX 15 min 0605This morning’s surge looks likely to reach the SMA20 and/or SMA50 (in yellow) with the next major upside resistance the purple channel midline where it intersects the purple .618 and SMA10 at 2057ish.

    2015-01-08-SPX daily 0605But, there’s a development that could undermine that thesis quite easily.

    continued for members(more…)

  • Charts I’m Watching: Jan 7, 2015

    After yesterday’s sharp intra-day reversal, we identified SPX’s SMA100 and the round number 2000 as downside targets.  It was touch and go, but SPX closed 2002.61 — just a smidge under the moving average.

    2015-01-07-SPX daily 0600As we’ve long maintained, the key to a bounce was USDJPY, which initially held key support — but ultimately broke down.    From yesterday:

    The problem child is USDJPY, which has dropped below the purple .886 yet again.  It’s tough to tell when this highly-manipulated currency pair is producing a head fake or is legitimately in trouble.  Need we remind readers that the pair is now well below the key .618 at 120.11?  The next support is the red .500 at 118.18.

    Thankfully for the bulls, USDJPY snapped back to the rising white channel overnight.

    2015-01-07-USDJPY 60 0615And, the 10-yr bounced as expected.

    2015-01-07-TNX 60 0600

    Oil even rebounded overnight, though it didn’t quite reach the TL as drawn.  But, as discussed in yesterday’s post, there’s a certain margin of error when drawing a TL over a 20 year time span.  The key will be getting back above the white .786 at 49.52.

    2015-01-07-CL daily 0630As such, we’re looking at SPX’s bounce finally getting underway this morning.  But, it’s not out of the woods just yet.

    continued for members(more…)

  • Update on Oil: Jan 6, 2015

    A little over a month ago, we wrote that crude light (CL) had reached a two month-old target and what appeared to be a potential buying opportunity: the intersection of a key Fibonacci level and a long-term channel bottom.

    2014-12-01-CL weekly 0800

    We were pleased with that call…until the rebound ran out of gas only a day later.

    Some say the continued decline is Saudi Arabia’s way of bringing US shale growth to a screeching halt.  Others suspect that it’s the US government at work, tanking Russia’s oil-dependent economy.  It’s also possible that that chart, for all its symmetrical beauty, was drawn in the wrong scale.  I’ll explain.

    I chart just about everything in logarithmic scale — particularly those charts that span a long period of time and contain large swings in price.  But, once in a while — for no particular reason — an arithmetic chart just makes more sense.

    Here’s the updated chart in logarithmic scale in all its channel-busting ugliness.

    2015-01-06-CL wkly log 1400Switching to arithmetic scale, it’s obvious that the white channel doesn’t even belong.  Before clicking back to that cat video, though, check out the alignment of the 1998, 2001 and 2009 lows — connected here by the yellow dotted trend line.

    2015-01-06-CL wkly arith 1400A trend line that goes back that far is certainly subject to placement error (to use the tails or not?)  But, simply connecting the Dec 12, 1998 and Jan 15, 2009 lows puts that TL at about 45-46 — a couple of points below today’s low — and, not too far from the white .786 Fib.

    Does it matter?  We’ll find out in the next few days.  If nothing else, it’s a good reminder to check out the alternative view from time to time.  A casual perusal of the blogosphere reveals plenty of folks who chart arithmetically.  Maybe this is one of those times when log scale wasn’t the best choice.

    Suppose CL drops below 46.  What then?

    We discussed the bleak channel and TL standpoint.  From a price Fibonacci standpoint, the next major support is another 13% lower — the white .886 at 41.49.  A time Fibonacci chart shows that the June 2014 highs (the red 1.618) were right in line with the major low in 1998 and high in 2008.  In other words…also bearish.

    2015-01-06-CL wkly arith 1430

    And, it’s probably not too crazy to start talking about the purple Fib lines.  If the 2009 low of 32.34 is broken, the purple .886 at 26.13 is pretty much the last line of defense until the 10.65 lows from the (drumroll, please) Last Century.

    Regardless of whether one looks at log or arith charts, the strong positive correlation between oil and stocks (SPX, in purple below) over the past 20 years is obvious.  It broke down this past year when stocks decoupled from, well… just about everything.

    But, given the level of financial institution involvement with the oil industry ($550 billion in bonds and loans since 2010), it’s probably safe to say that a continued slide in oil can’t help but leave a mark.

    2015-01-06-CL wkly arith 1440Stay tuned.