

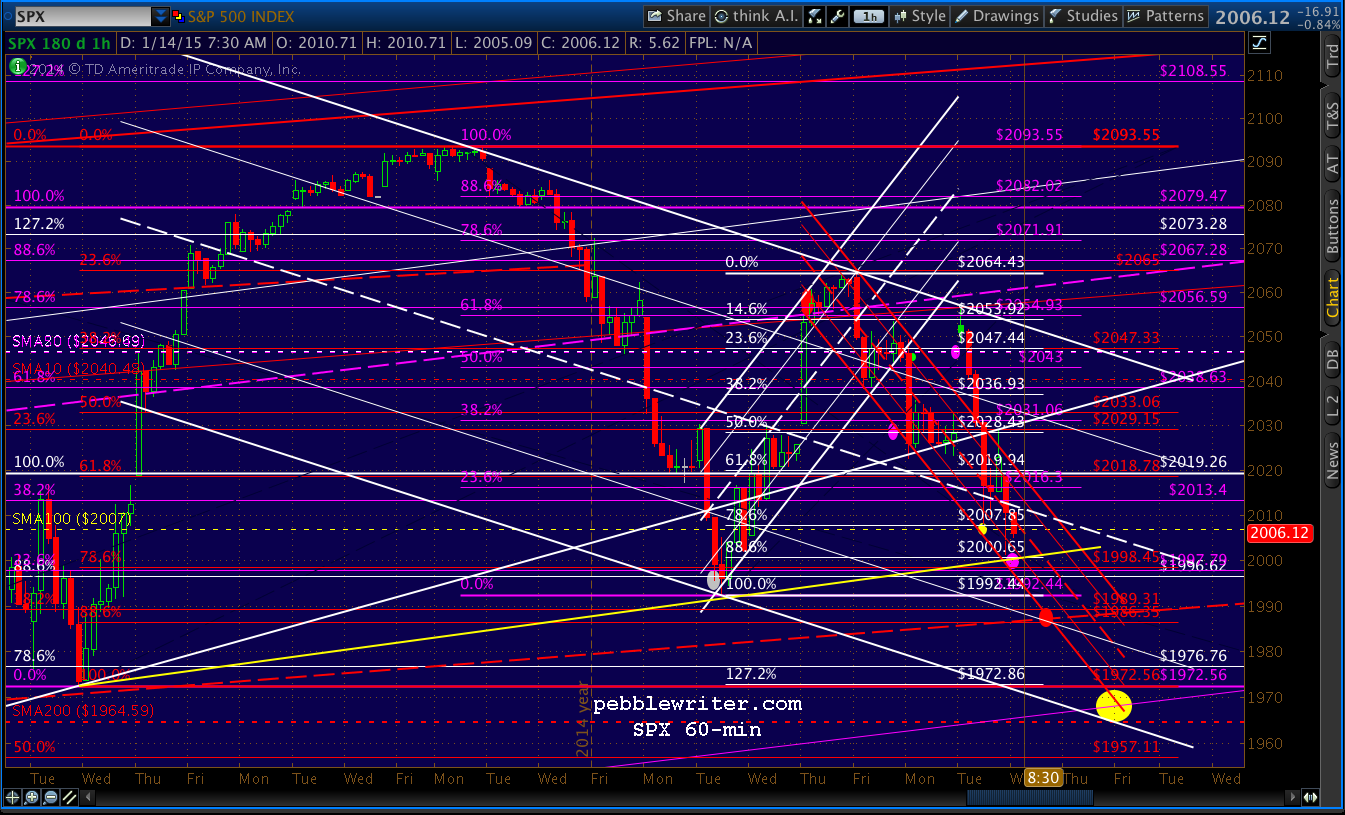
Yesterday was a wild ride for SPX. It took off in the morning, overshooting our upside target by 7 points.
 But, our 9:40 top call proved accurate, and SPX maxed out at 2056.93.
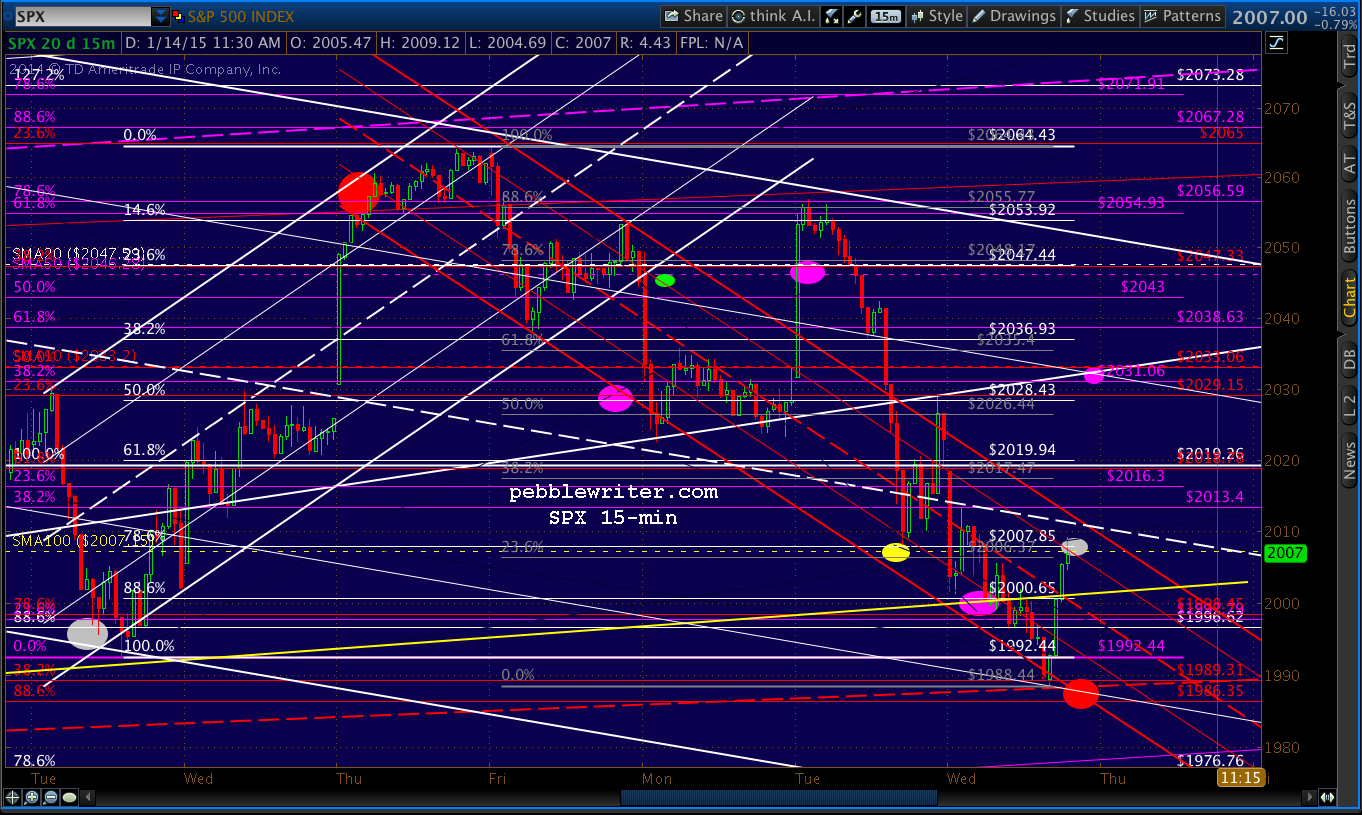
SPX just sliced through the SMAs and tagged 2054.75. It should top out between here and 2059 — the .886 of the drop and a backtest of the rising white channel. I’d be very careful about chasing it any higher.
It subsequently dropped to our downside target of the day, a plunge of 48 points to the .786 & SMA100 combo at 2008. I had actually expected it to come the following day (today.)
IMHO, this morning’s rally is overdone. But, the algos are propping it up. As such, I suspect any initial slide will be limited to a backtest of the SMAs — unless USDJPY reverses soon. But, odds are its reversal will come after the close and not affect SPX…The problem is that it should drop further. But. again, that could happen after the close without affecting SPX.
The bounce from there, again, overshot our upside target of 2020, but didn’t have enough juice to keep going and settled back to close within the falling red channel.
…SMA100 tag for SPX, we should see a nice bounce here. How far will depend on many factors, but I’d say at least back to the .618 at 2020. Beyond that, the rising white TL comes back into play.
All in all, a quite bearish 48-point drop from its initial 23-point ramp.
On to today…
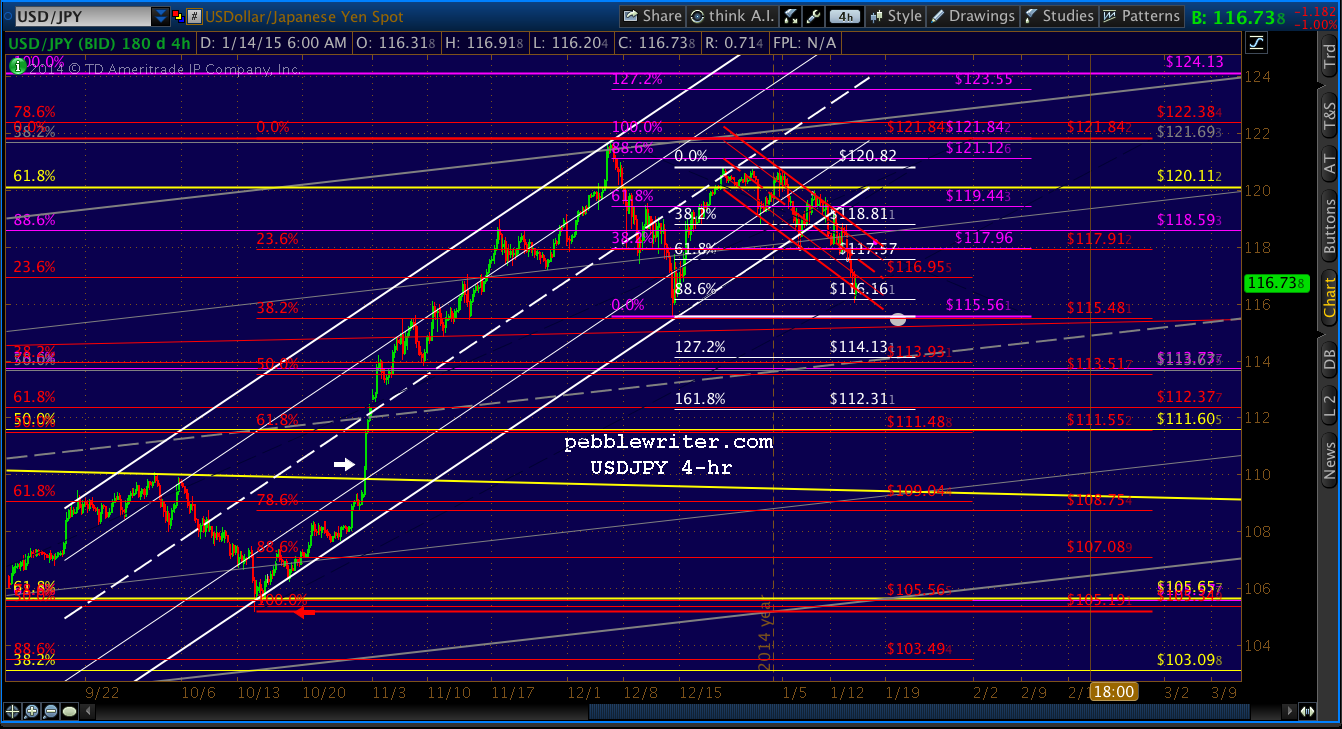
USDJPY reached our 116.68 target overnight — and, then some. This was the downside target we set on Monday, (the red circle) so the timing turned out pretty good.
The .786 would have kept the pair in our falling red channel, but this morning’s retail sales numbers were just too dreadful.
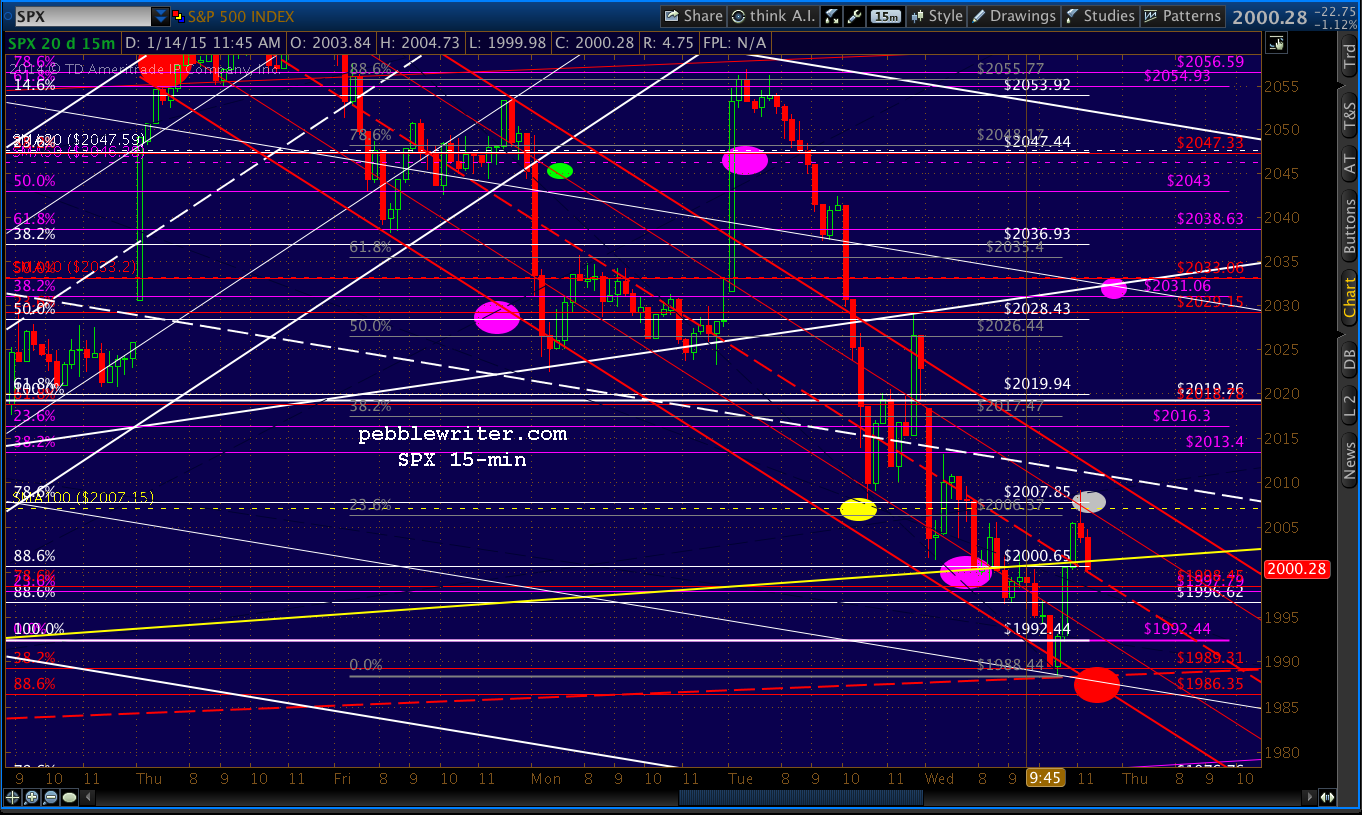
 The e-minis are following suit, currently off 23 after being down about 30 points earlier. SPX looks destined to reach the .886 (2000.65) we’ve been targeting. If it overshoots — and, there’s a decent chance — there’s channel support down around 1986ish.
UPDATE: 10:00 AM
SPX came pretty close to our initial downside target: 2001.38 versus 2000.65.
 USDJPY’s bounce at the .886 should provide a bounce for SPX as well. From there, it starts getting interesting.
continued for members…
First, note that this morning’s low coincides with a TL (yellow) off the Dec 16 lows. So, 2001.38 might be as good as the bears get this morning.
Re our next downside target, note that 1986 is the .886 of the red grid as well as the red channel midline — a pretty solid target.
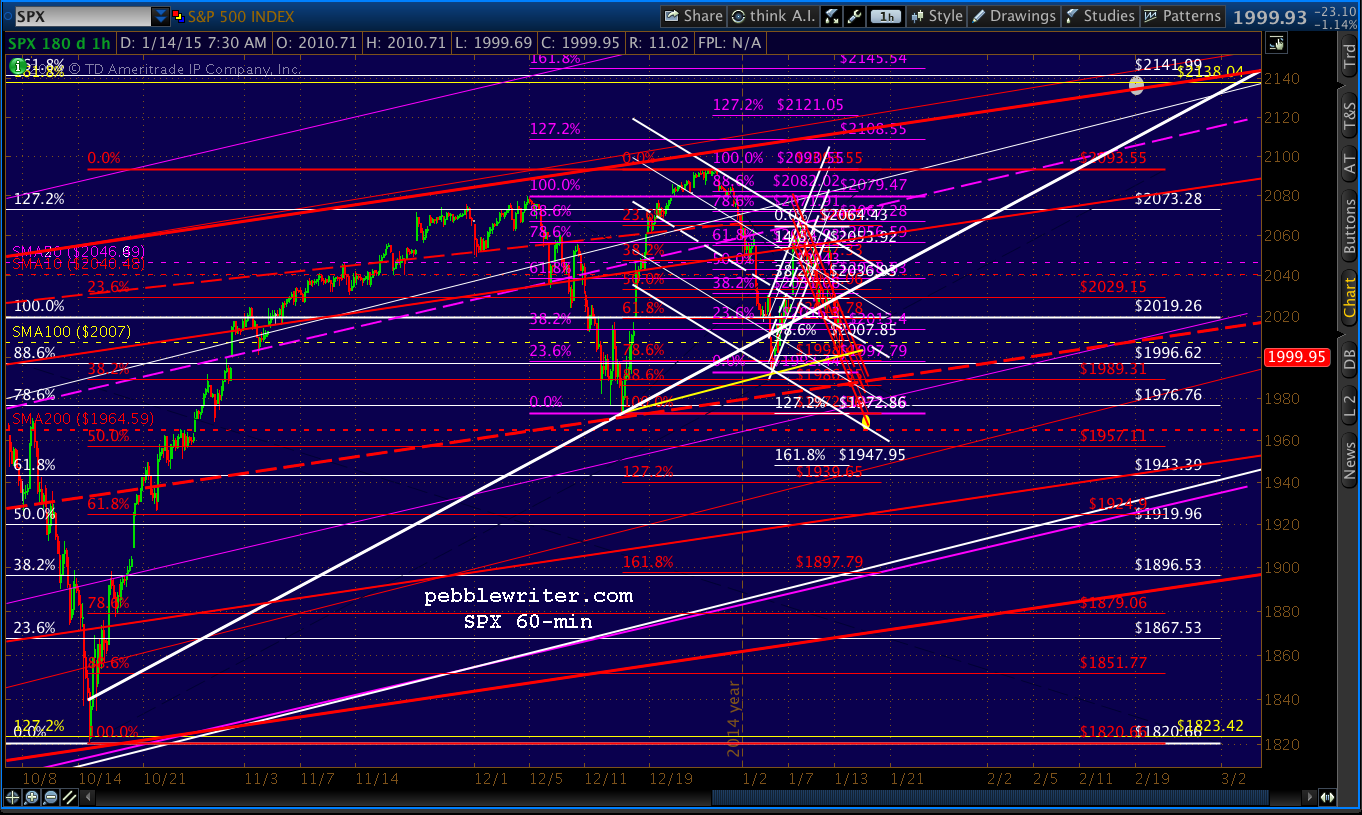
 If it doesn’t hold, the SMA200 (yellow dot) is only slightly below at about 1965. In a week or so (say, ECB decision time on the 22nd) it could be above the Dec 16 lows and provide a rock solid bottom — if the ECB makes good on its QE threats to initiate massive sovereign bond purchases.
Whether or not they will is anyone’s guess. Personally, I think they’ll find a way to do something less than the bulls hope for, but good enough to produce a bounce at the SMA200. I don’t know exactly what it would be, but that’s what the charts are suggesting. I don’t think the markets would be selling off as much as they are unless the insiders weren’t taking money off the table in anticipation of a disappointment.
On the other hand, it’s entirely possible that the current sell-off continues, the falling white channel holds, and SPX reaches the SMA200 by Friday. And, whatever pixie dust shoots out of Draghi’s ass on the 22nd takes the “market” to new highs.
If the ECB does a face plant and the investing world is left without a new carry trade vehicle, there is considerable more downside. Consider the rise from 1820 in mid-October. A drop to the SMA200 wouldn’t even reach the .500 retracement — let alone flesh out the larger rising channels.
 USDJPY has obviously made a huge run since mid-October, fueling SPX’s rise. If, as I suspect, it is trying to remain in a trading range of 115-119, then support is coming up pretty soon. A drop to even the red channel midline (intersects with the white 1.272 at 114ish) would really shake things up.
 More later.
UPDATE: 1:54 PM
Update on progress toward our 1986 target…within 2 pts. Probably good enough to risk a long position here at 1989 with tight stops. But, the actual .886 intersects with the falling red channel at about 3:30 ET.
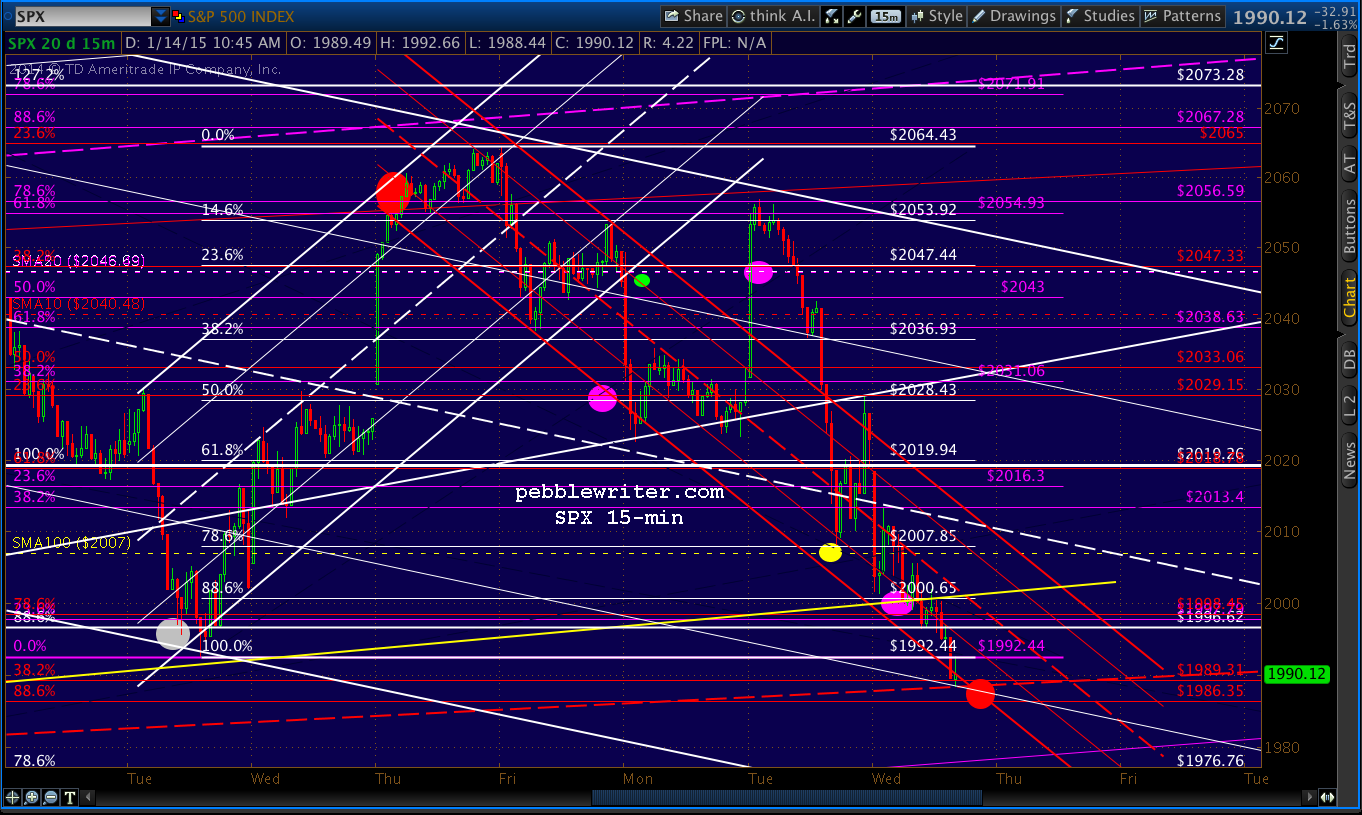
If/when it reverses, the first target is a backtest of the yellow TL, then the SMA100 at 2007 and white channel midline at 2011. Above that, the next target is 2030ish.
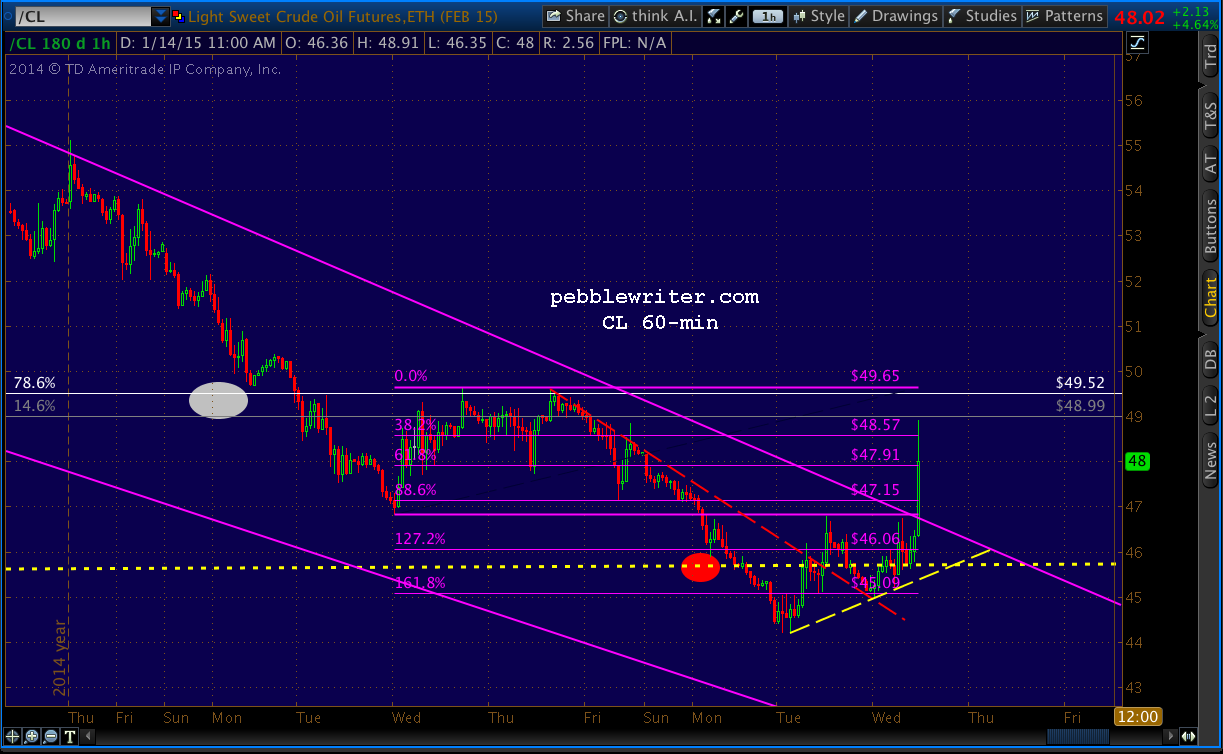
CL is marching higher, getting close to breaking out of a narrow falling wedge and back above the TL from 1998.
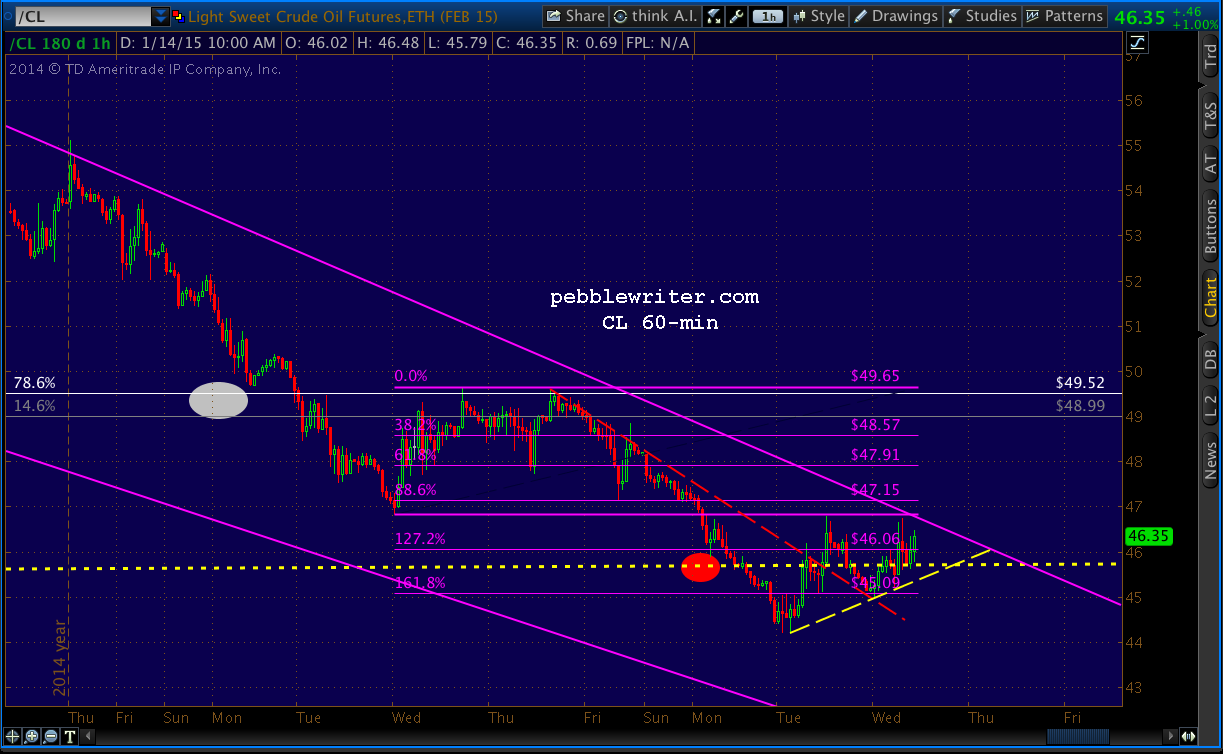
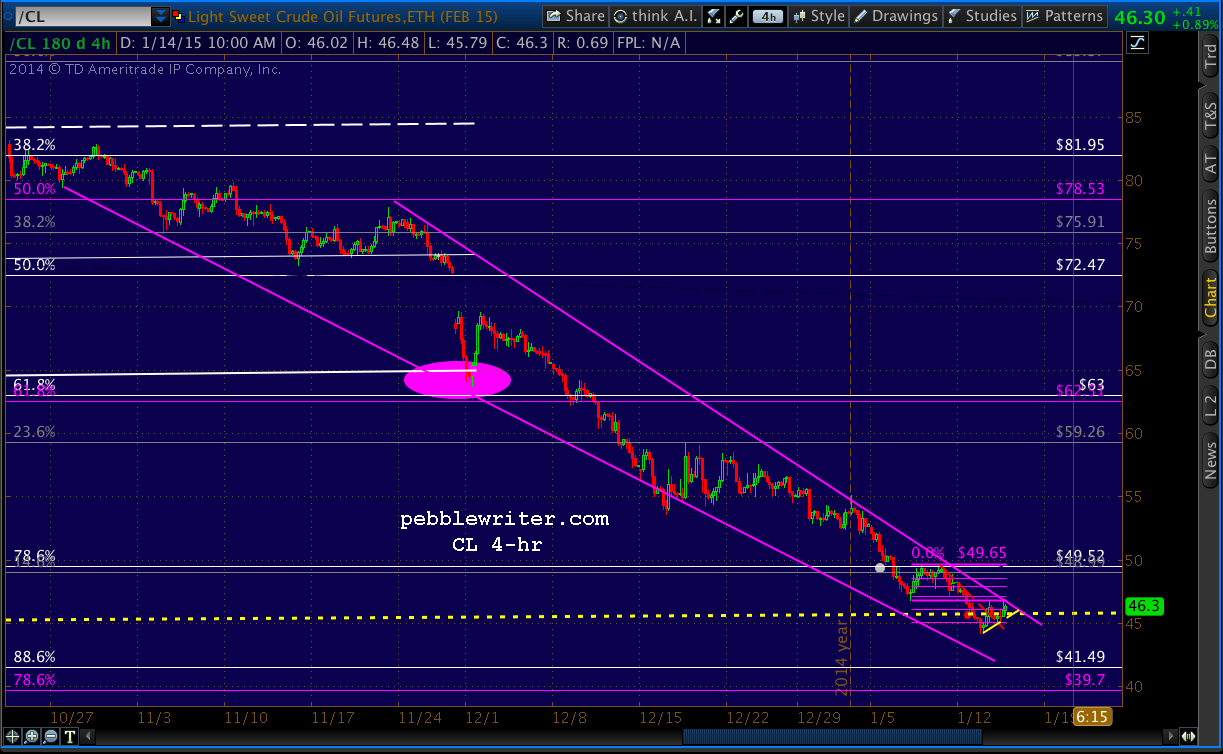 A break of the wedge would certainly help stocks.
UPDATE: 2:35 PM
SPX just reached the SMA100 at 2007. According to VIX and USDJPY, we should get a pullback here. But, I’d be inclined to take the day’s profits and see what happens tomorrow.
 UPDATE: 2:55 PM
If you ignored my last post and rode down to 2000 from 2007, this is probably a good place to look for a bounce. SPX is back to the yellow TL (another backtest!)
 More importantly, CL has broken out of the wedge discussed above.
 Last, I don’t think TPTB have any interest in a sub-2000 close. Ramp job, anyone?
UPDATE: 3:20 PM
Okay, if you ignored the subsequent post, too, here’s another chance to jump out with some nice gains. SPX just reached the white channel midline at 2011. For crying out loud, don’t be greedy!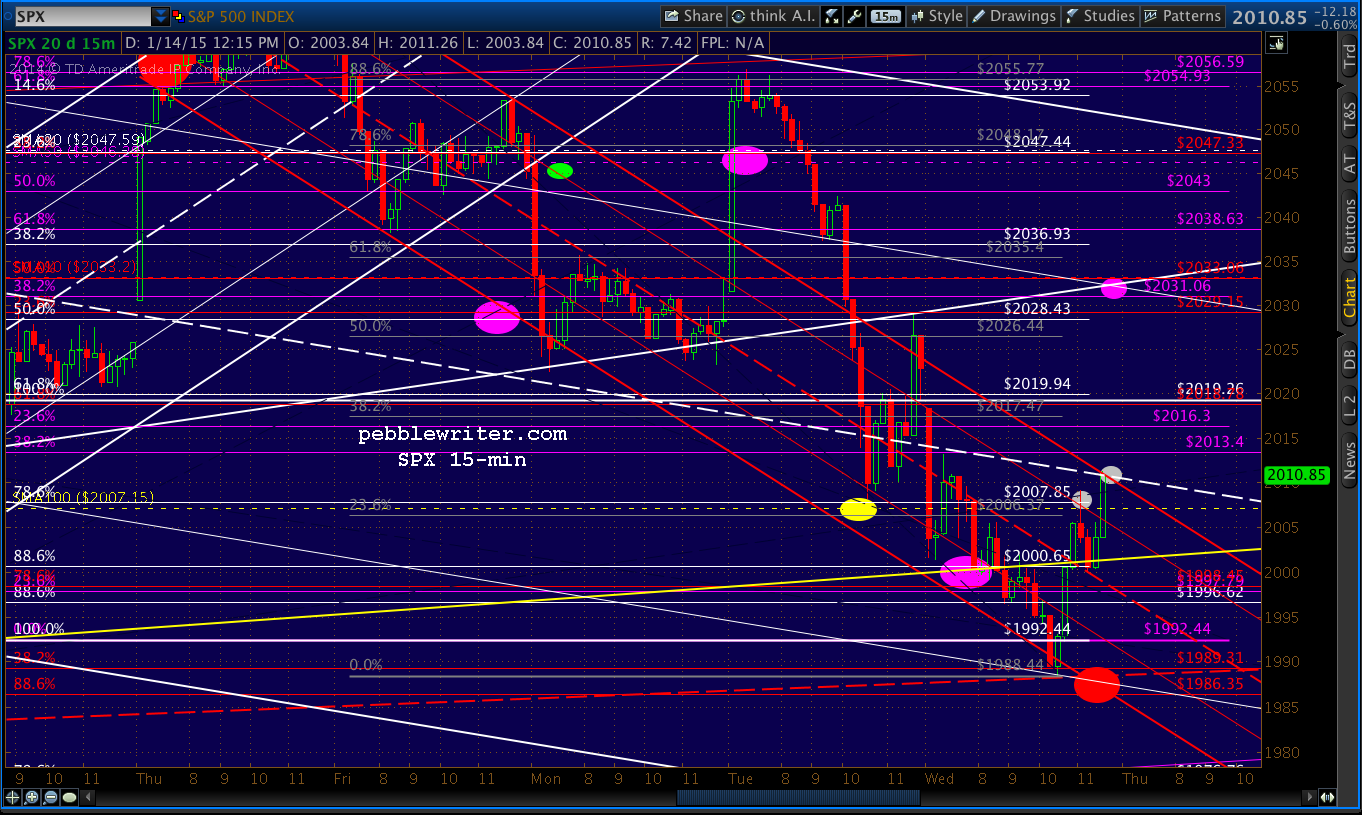 The reality is, I expect a very nice bounce here — with that 2030 level (1:54 update above) looking good for the next big move. But, the headline risk has been pretty substantial lately. As such, I wouldn’t carry any position overnight unless you have the means to hedge and/or monitor it closely.
Comments
One response to “Charts I’m Watching: Jan 14, 2015”
Any intermediate chart outlook from this level, sorry if you have already posted.