Year: 2015

  • Charts I’m Watching: Feb 10, 2015

    Yesterday’s forecast called for a dip to the 50-day moving average.  From the members’ section in our initial post:

    I’m looking for the initial move to take SPX to our 2046.7 target, with a secondary target of the SMA50 at 2043.90. If that should fall, the next strong support isn’t until the white .618 at 2032…

    2015-02-09-SPX 30 0600SPX accommodated with fairly accurate tags at our target prices and times.

    2015-02-10 SPX 30 0600We finished up the day with some indecision about that lower white target:

    Quick update…2nd target hit, and a 50:50 shot on the third.  VIX and bonds suggest it’ll happen tomorrow morning.  But, TPTB might easily hold the line here.  Hold the short only if you can hedge and/or handle the overnight risk.

    For the umpteenth time, news (founded or not) out of Greece dominated the overnight sessions.  Zerohedge has been running a story (citing Bloomberg) that — following offers from Russia and/or China to fund its deficits — Greece has obtained a 6-month extension on its debt deal with the ECB.

    Predictable, markets have ramped higher.  USDJPY broke through the trend line off the Dec highs — sending ES up over 12 points as we go to press.

    2015-02-10 USDJPY 60 0600continued for members(more…)

  • Fear and Loathing in the EU

    Isn’t it interesting how the exercise of democracy in the very cradle of democracy has the Eurozone scrambling?  No doubt the Troika wishes they could just turn back the clock, go back to the days of dictating economic austerity to member states.  But, central planning/banking has its limitations, and the Greek people have proven that citizens can, indeed, be pushed too far.

    In other news, the Baltic Dry Index reached its lowest level ever today.  For those unfamiliar, it’s a measure of the price of moving raw materials by sea and an accurate reflection of global trade.

    Screen Shot 2015-02-09 at 6.52.38 AMFriday’s shiny new unemployment report, which sent stocks soaring and bonds dumping, is likely to be forgotten as the Grexit again takes center stage.  Last Thursday afternoon’s forecast [see member section] proved fairly accurate:

    Given the volatility and manipulation of the last two days, I wouldn’t be surprised to see SPX slightly exceed 2064 in order to stop out the bears before reversing.

    When SPX overshot our target, we set our sites on 2073.28.  SPX reached 2072.4 before reversing on cue — bagging our first and nearly our second downside targets (2049 vs 2046.)

    2015-02-09-SPX 30 0600We concluded the day with an observation that there was more downside to come and that aggressive traders might wish to continue playing the downside.

    With the futures currently down 11 points, that was the correct call.

    USDJPY reversed nicely off the red TL as expected — though it topped out a little higher (119.21) than expected.

    USDJPY, having done its job, will certainly retrace a great deal of this morning’s gains.  Look for it to top out around 119.08.

    2015-02-09-USDJPY 30 0600Today’s targets coming up. continued for members…
    (more…)

  • Bond Alert: Feb 6, 2015

    This post updates our Jan 27, 2015 Update on Bonds:

    This morning’s unemployment report has sent yields soaring.  The reasoning is that stronger employment will cause a stronger/earlier rise in interest rates than the Fed would otherwise have planned.

    From a chart standpoint, the 10-year yield is very overbought.  In other words, we’d be aggressive buyers of notes here at 1.95% (128’150) with stops at 127’185.

    Note that TNX has again tagged the underside of the rising red channel channel…

    2015-02-06-TNX daily 1100…while prices (ZN) have tagged an important .618 Fib where it intersects with the .236 channel line.

    2015-02-06-ZN daily 1100We think this bounce is very overdone, and are sticking with our Jan 27 forecast of a late February target of 1.53-1.58.  The ideal date: around Feb 20.

    Because a channel bottom backtest is involved, the stops are pretty obvious.  A strong move north of this morning’s highs (19.53) would be cause for reassessment.

  • Charts I’m Watching: Feb 6, 2015

    USDJPY says it all — busting through the falling purple channel top, the red triangle top and the last significant high — busting the downward pointing harmonic pattern in red.

    2015-02-06-USDJPY 60 0600With futures up 5-6 points at present, SPX will most certainly break horizontal resistance and make a second higher high.  Like USDJPY, this busts the downside harmonic pattern (gray.)

    2015-02-06-SPX 30 0600The employment report (and, especially revisions) supposedly increases the odds of a rise in interest rates this year. So, there is a dark lining to this silver cloud.  Watch out for the scenario we described in yesterday’s member section:

    Given the volatility and manipulation of the last two days, I wouldn’t be surprised to see SPX slightly exceed 2064 in order to stop out the bears before reversing.

    USDJPY, having done its job, will certainly retrace a great deal of this morning’s gains.  Look for it to top out around 119.08.

    continued for members

    Unless SPX moves strongly through the top (2065), this is probably a good shorting opportunity.  Updated charts in a moment.

    UPDATE:  9:53 AM

    This is technically a megaphone pattern — a series of lower lows and higher highs (marked here with red lines.)  It can break out or break down.  But, the assumption is always a reversal at the bounds unless proven otherwise.  So, it can be played as a short, but with relatively tight stops.2015-02-06-SPX 15 0657I also like the very well-formed rising wedge (also in red.)  If it does reverse, targets include the .886 at 2055 for starters, followed by the purple channel top at around 2046.

    If it breaks out, instead, look for a move to the purple channel line crossing the 1.272 at 2073.28.

    GLTA.

    UPDATE:  1:13 PM

    SPX eased up through the red TL signifying the megaphone top at 2065 to nearly tag our 2073 target (0.88 away), but has since fallen back below the red TL.  Note that the purple .786 was tagged, which makes for a decent reversal spot.  Downside targets, as detailed above, are the .886 at 2055 and channel top/.786 combo at 2046.

    2015-02-06-SPX 15 1013Note that I’ve sketched in a rising white channel that uses the rising wedge upper bound as its own.  This is purely speculative, but I often find that over-exuberant wedges broaden into channels when TPTB are determined to support a push higher.  The fact that the midline intersects with my downside target is a bonus, and lends credence to the 2046 target.

    I probably don’t need to remind members (but, will anyway) that the normal and obvious downside targets such as backtests have been less than reliable ever since the market manipulation became commonplace over the past two years.  Stops are highly recommended.

    UPDATE:  3:00 PM

    SPX just reached our initial target: the .886 at 2055.  I still like the 2046 target more, but we’ll see.  USDJPY seems to have dug in at current levels, and may not come off until after the close.

    2015-02-06-SPX 15 1200I just posted an alert on bonds, which — IMHO — made much too big a move this morning.  In fact, it’s making me wonder if 2046 is enough of a downside move.

    Thus, I’m throwing a couple of other targets onto the chart such as the red .618 at 2015 and the SMA200 at 1991.  It’s currently at 1979 and increasing about a point/day, so it’ll be there soon enough.  And, TPTB have been itching to tag it — just didn’t want to get things pointed in the wrong direction.  This way, they can tag strong support based on a Fib and SMA.

    UPDATE:  3:35 PM

    Cautious types might wish to take profits here at 2050 — a nice 22-pt gain from this morning’s reversal at 2072.  Aggressive types, especially those able to hedge their positions over the weekend — I think there’s more downside to come…

    2015-02-06-SPX 15 1231…especially if VIX pokes through that midline…

    2015-02-06-VIX 60 1235…and, USDJPY reverses as it should.

    2015-02-06-USDJPY 60 1235Just know that TPTB might plan on defending that purple channel top fairly strenuously — unless the megaphone pattern holds and it was all just a head-fake.

    GLTA.


  • Charts I’m Watching: Feb 5, 2015

    Yesterday was one of those “will she or won’t she” days, with SPX dancing around the SMA50 all day long before finally nearly tagging our upside target at the white .886 (2054.74 vs 2055.08.)

    2015-02-05 SPX 30 0600We expected a sell-off to the white .618/SMA10 combo at 2032 at that point.  From the 3:37 update in yesterday’s members’ section:

    Just came to within .34 of the .886.  It’s worth shorting here for the move to 2032, but only with tight stops in case they ramp it up overnight.  As before, keep an eye on the SMA50 at 2044.

    It got down to 2036.72 before a last minute blip higher in USDJPY provided a lift.  And, as we suspected, they ramped it up overnight.  E-minis are currently showing a 14 point gain that seems to be waning as the opening bell approaches.

    2015-02-05 USDJPY 60 0600Note that, for all its threats to break out, USDJPY continues to follow the purple channel top lower.  That hasn’t stopped it from providing timely boosts when needed.  But, the effect will be limited until a breakout occurs — if it does.

    A troubling development for bulls: VIX.

    continued for members(more…)

  • Charts I’m Watching: Feb 4, 2015

    CL rallied hard yesterday…

    2015-02-04 CL 60 0600 …providing a relief rally for SPX… 2015-02-04 SPX daily 0600…that was only belatedly aided by USDJPY.2015-02-04 USDJPY v ES 0600Our original call was for SPX to move higher if USDJPY pushed through the purple channel:

    At this rate, [SPX’s] SMA10 looks to be tested on the opening.  If USDJPY can break out of the purple channel, there should be additional upside.

    USDJPY broke out only briefly before falling back (the white arrows.)  But, equities kept soaring to keep up with oil.  The last two hours of the session were boosted beyond our 2036 sell signal when USDJPY rejoined the party.

    2015-02-04 USDJPY 60 0600SPX gave lip service to the SMA50 with an 8-pt drop, then blew through the .786 before closing just shy of the .886 at 2055.

    Daily forecast coming up.

    continued for members(more…)

  • Charts I’m Watching: Feb 3, 2015

    Greece.  The confusion continues.  But, it hasn’t stopped the USDJPY-driven algos from boosting S&P 500 futures 50 points off yesterday’s lows.

    SPX hit our next downside target (yellow dot) on the nose yesterday. This was a TL connecting the Jan 6, 14 and 16 lows as discussed last Friday afternoon.

    2015-02-03 SPX 15 0600It then bounced to an appealing upside target — the SMA100 at 2010 — which seemed like a great place to short again (11:39 update.)

    It dipped pretty convincingly, shedding 20 points toward the SMA200 until about an hour before the session ended.  At this point, the Greece is fixed rumors heated up and it spurted higher to complete a Bat Pattern at the small white .886.

    USDJPY took over at that point, moving back above the red triangle bottom and even the falling purple channel top.  It looks like the SMA200 tag will have to wait a bit longer.

    2015-02-03 USDJPY 15 0610

    Note that DX has reached the lower bound of the acceleration channel that’s kept it rising since mid-December — usually with positive effects on stocks.

    2015-02-03 DX v ES 60 0600At this rate, the SMA10 looks to be tested on the opening.  If USDJPY can break out of the purple channel, there should be additional upside.  If not, the pop should turn into a drop fairly quickly.

    UPDATE:  9:35 AM

    Looks like a good place to sell. Note the white 1.272 is essentially also the larger scale .618.  And, USDJPY has continued to settle after tagging the upper bound mentioned above.

    2015-02-03 SPX 15 0634The very latest out of Germany — the soap opera which is the Greece debt negotiations is looking messier and messier:

    From Bloomberg:

    Volker Kauder, the caucus leader for Chancellor Angela Merkel’s Christian Democratic-led bloc in German parliament, calls Greek debt recommendation “half-baked” demands a refrain from new proposals “every day.”
    “We’re not going to play this game,” Kauder tells reporters in Berlin ahead of CDU/CSU caucus meeting. “I’m not ready to comment on half-baked plans every day. The fact remains that we have agreements with Greece and not with a government — and these agreements have to be adhered to.”
    “Greek Prime Minister Alexis Tsipras’s new government has a right to make proposals, though must bear consequences”
    “The German tax payer mustn’t be held liable for the decisions of this leftist-populist government. It’s up to Greece to decide.”
    Troika of ECB, IMF and Commission must remain as negotiating partner with Greece.
    “I don’t like the tone of voice out of Athens at all.  That’s not the way to talk to one another in Europe.”
    “There are new proposals and new reports coming out of Greece all the time and all of Europe and beyond seems to be holding its breath.”
    “A government should first of all reflect, should make concrete proposals and not present something new every day.”
    “The new Greek government doesn’t create any trust this way.”

    Doesn’t sound terribly “fixed,” does it?

    Speaking of the euro mess, note that the EURUSD continues to rebound since our bottom call upon its reaching our 1.12 target 10 days ago [see: Jan 23 update on EURUSD].

    2015-02-03 EURUSD daily 0700With JPY going sideways and the euro strengthening, it makes one wonder if that DX channel will hold…

    continued for members(more…)

  • Charts I’m Watching: Feb 2, 2015

    As we’ve been discussing for nearly two weeks, a triangle in USDJPY has been driving the volatile sideways action in SPX.  Yesterday, while half the world was absorbed in football, the triangle finally broke down — just long enough to tag a meaningful retracement.

    2015-02-02-USDJPY 15 0600By the time the game was over, USDJPY was safely back in the triangle, where it currently resides in the narrowing territory between the purple channel top and the triangle bottom.

    It’s a lot easier to manipulate futures prices over a low-volume weekend, and this one was no exception. Has USDJPY’s plunge taken place right about now, SPX would be testing the SMA200 down at 1974.  But, that’s not the way the script reads…

    S&P futures fell 9-points with the initial plunge, but have since risen more than 13 off the bottom. They’re currently showing a gain of 7 points – meaning yet another test of the white channel top and/or purple channel midline.

    2015-02-02-SPX 15 0600If the rally can be sustained beyond that, the SMA100 is currently around 2010. But, bulls might wish to keep an eye on the fading rally in oil.  CL briefly tested 50 — almost at the .886, and has since hinted at a retracement.

    2015-02-02-CL 60 0615

    UPDATE:  10:11 AM

    SPX just reached our next downside target at 1980.  A reminder, this is a TL that connects the Jan 6, 14 and 16 lows that we detailed in the 3:55 update (members’ section) on Friday afternoon.

    2015-02-02-SPX 15 0710Note that this move below 1988 completes a traditional H&S Pattern that would target 1912 if it were to hold.  Needless to say, not many H&S Patterns have held in the past couple of years.  They’ve effectively been banned by central bankers and algo-centric HFTs.

    More importantly, though, it officially kills off the IH&S that TPTB were trying to sell us.  From here, the SMA200 becomes a much more reachable target — though we wouldn’t be surprised to see a decent bounce at this TL.

    Next moves coming up.  continued for members(more…)

  • Charts I’m Watching: Jan 30, 2015

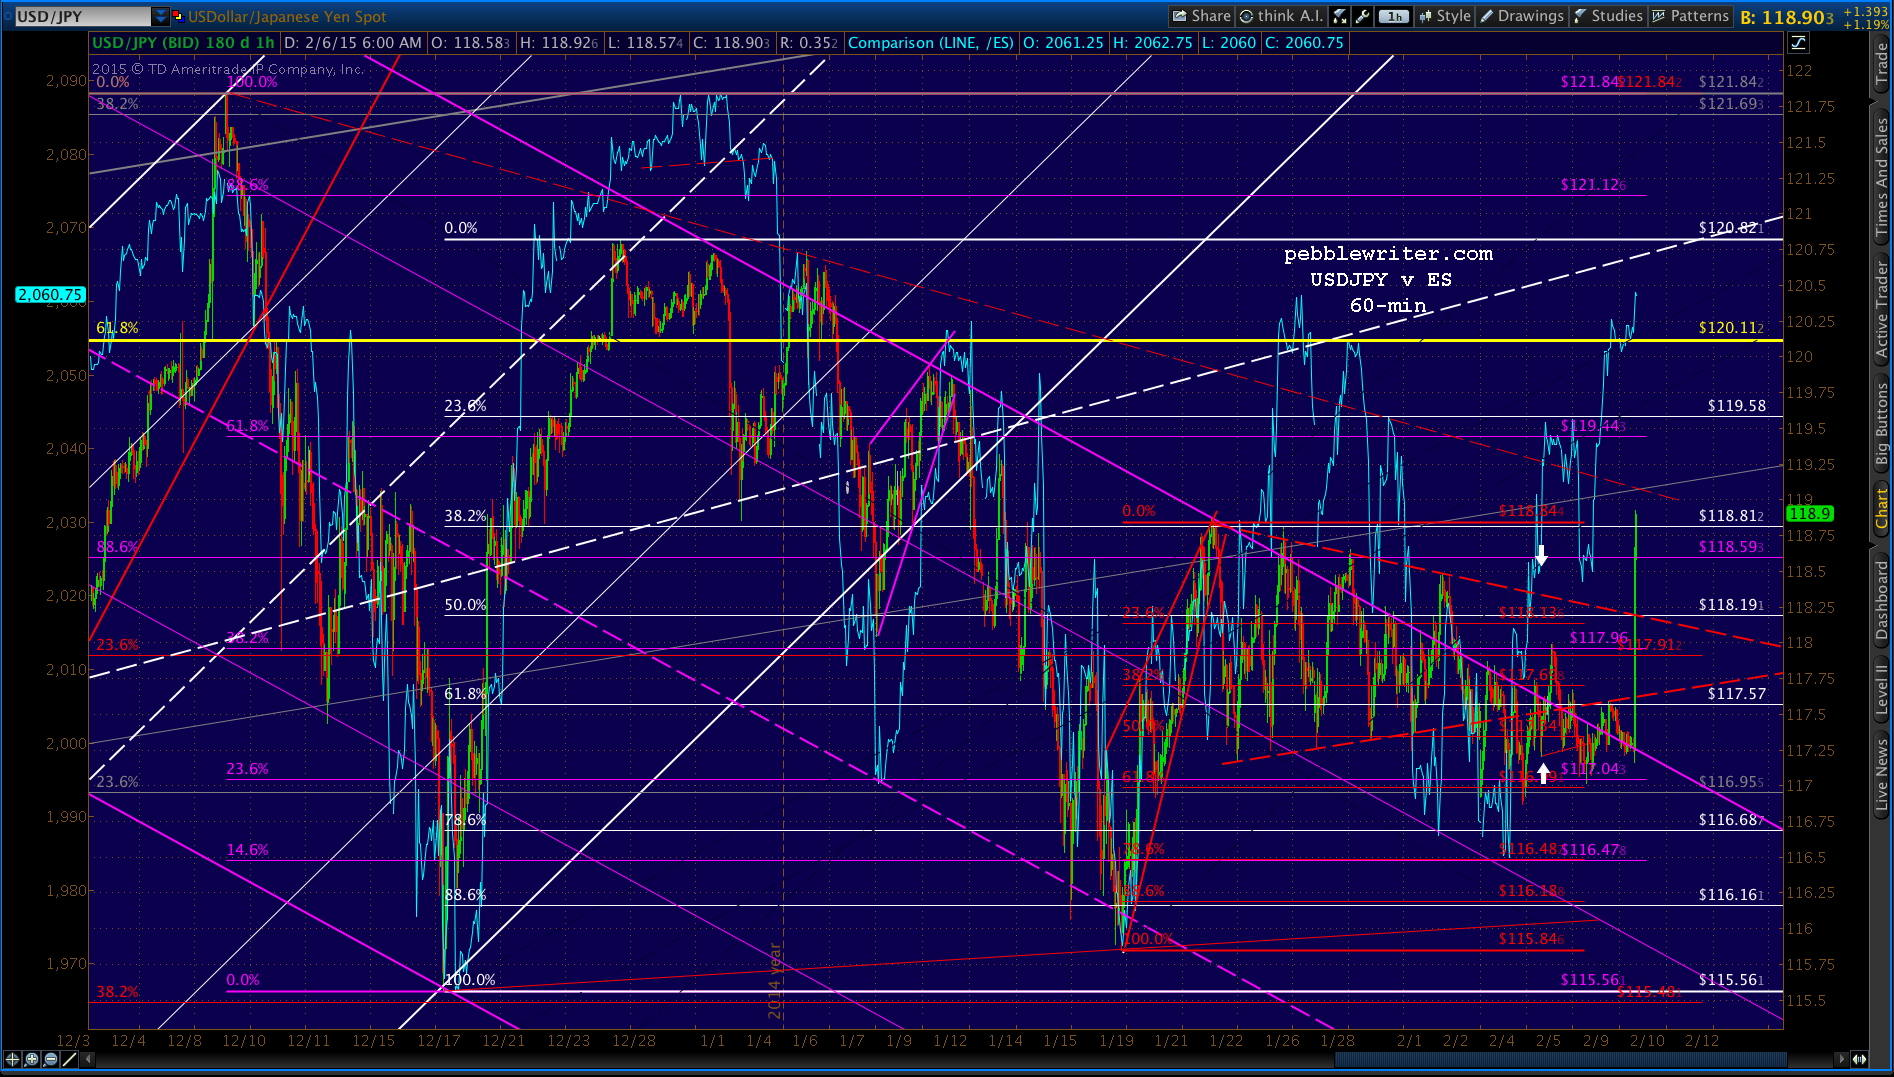
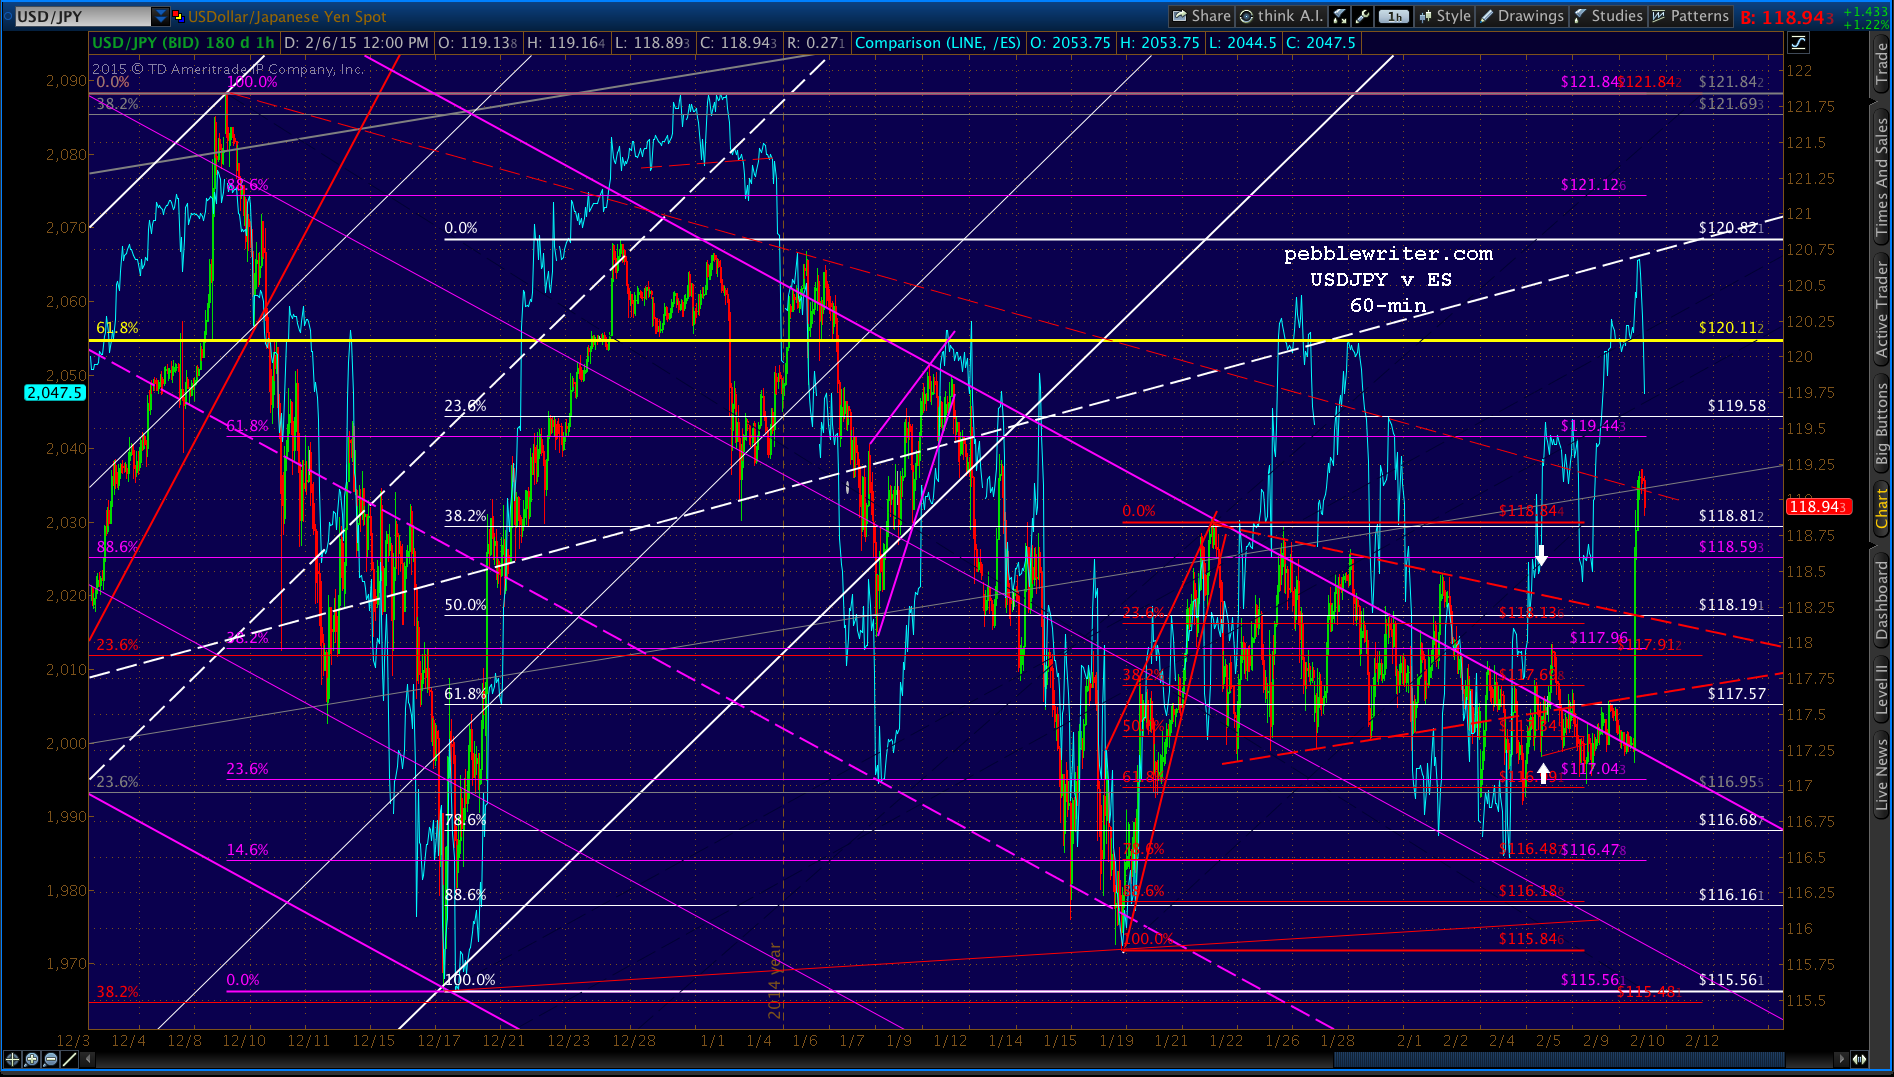
    Yesterday’s equity price action revolved around whether or not USDJPY would break above the purple channel top in order to test the upper bound of a triangle pattern it’s been tracing out since Jan 20.  From yesterday’s initial post:

    Note that USDJPY bounced off the lower triangle bound, and is again flirting with the channel top and a return to the [triangle] upper bound.  I believe it’ll pop out of the channel — even if it’s only intra-day — and provide a nice lift for SPX.  If it doesn’t, then the falling red channel could get SPX down to the SMA200 by late today or tomorrow.

    That’s exactly what happened.  USDJPY’s initial pullback at the channel top drove SPX to its lows of the day where it was stick-saved at a mere 1.02 above the previous low, thereby keeping the IH&S Pattern (technically) alive.

    2015-01-30-USDJPY v ES 60 0555The stick save was accomplished by a push through the channel top to the triangle upper bound referenced above, which it held long enough to drive SPX 35 points off its lows.  USDJPY held those prices through the close, at which point it fell all the way back into the channel and is testing the triangle lower bound.

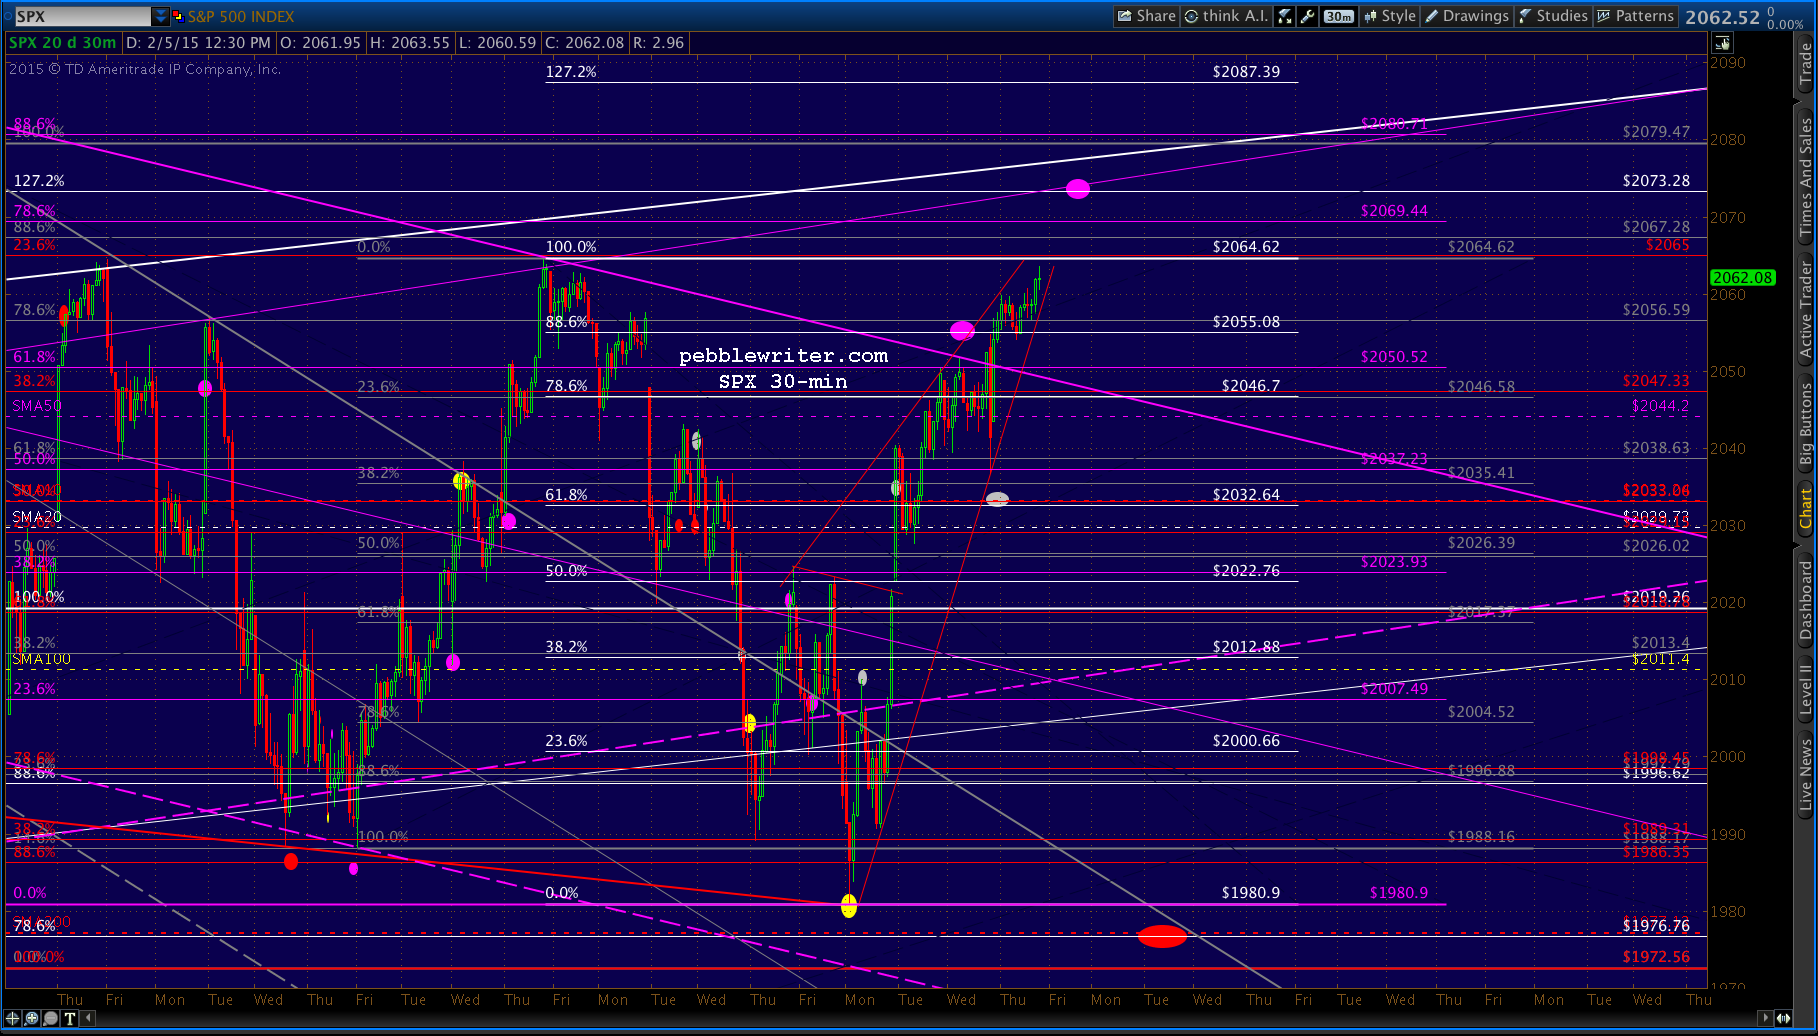
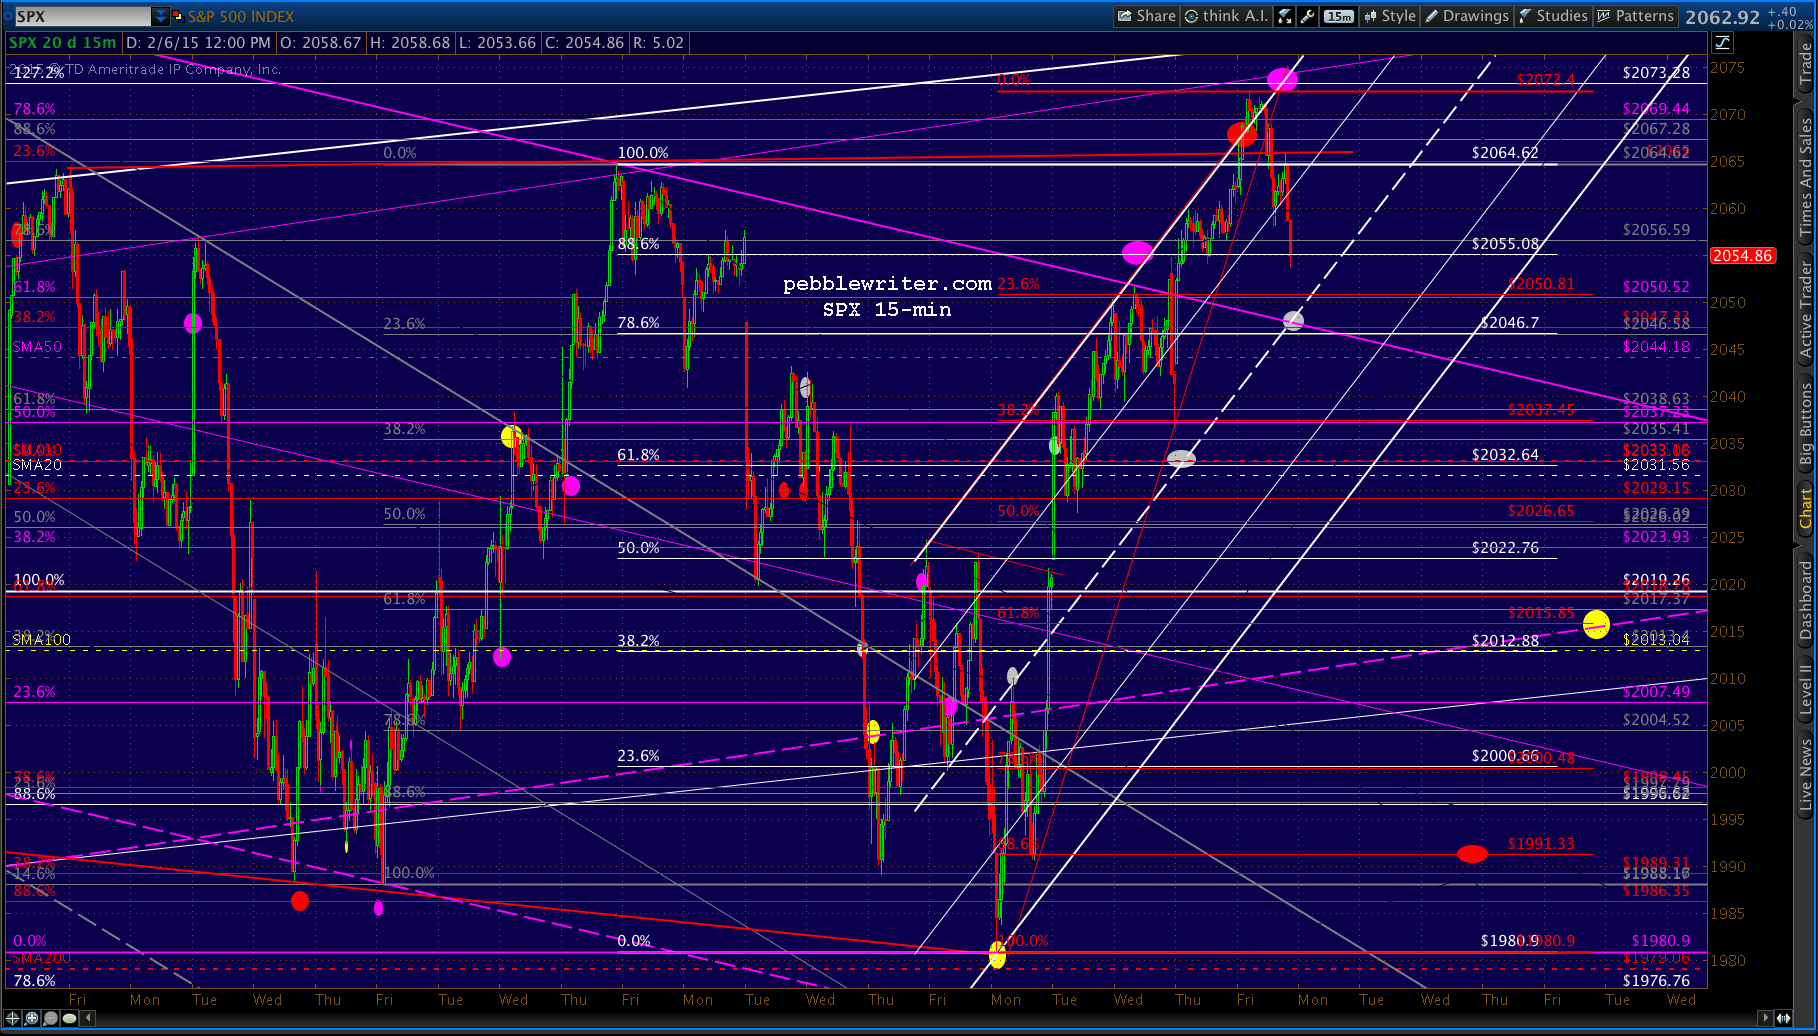
    Though SPX’s initial drop was lower than we expected, the rise was along the lines of what we were looking for:

    TPTB might want to breach Tuesday’s low (2019.91) in order to screw up a potentially bearish wave count. A move by USDJPY above the triangle top could do it.  Be cautious, as the algos seem to be back in charge.

    SPX reached 2024.64 before falling back to close at 2021.  USDJPY’s fall back to the triangle bottom has driven futures down over 20 points.  A backtest of the falling white and red channels at around 2006 seems like the easy call.  Whether it holds at that point will depend on… wait for it…whether USDJPY bounces off the triangle lower bound for a 6th time.

    2015-01-30-SPX 15 0615Hopefully there’s no doubt in anyone’s mind anymore that the daily direction of the “market” is being almost completely determined by the yen carry trade.  Since the daily price action of USDJPY is almost completely manipulated by central banks and HFT algos, that means the stock “market” is also.

    The chart pattern in USDJPY makes it rather obvious.  But, as we wrote several weeks ago, it seems that TPTB don’t really care anymore just how obvious are their day to day manipulations.  Pick a price for USDJPY, peg it there, and voila! — SPX goes right where you want it.  Almost makes one yearn for the good old days of market maker manipulation.

    UPDATE:  9:50 AM

    It’s– it’s– a miracle!  You’ll never guess what happened…!

    2015-01-30-USDJPY 60 0649
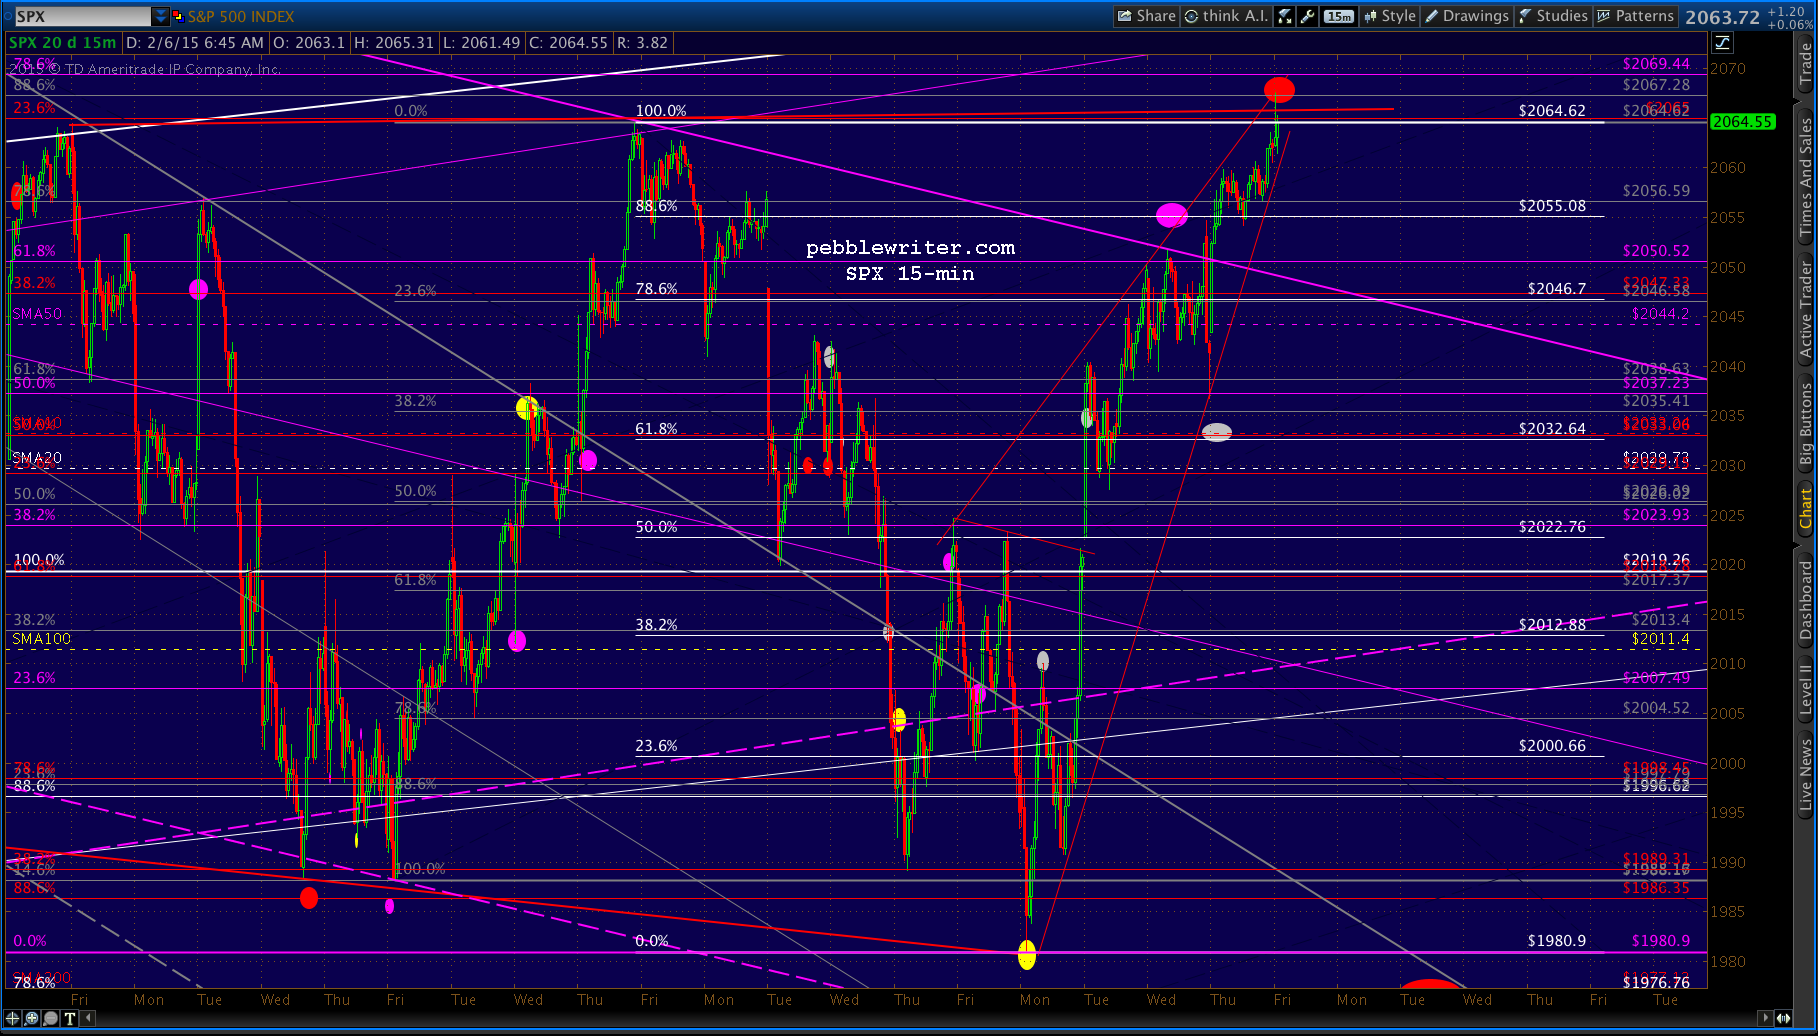
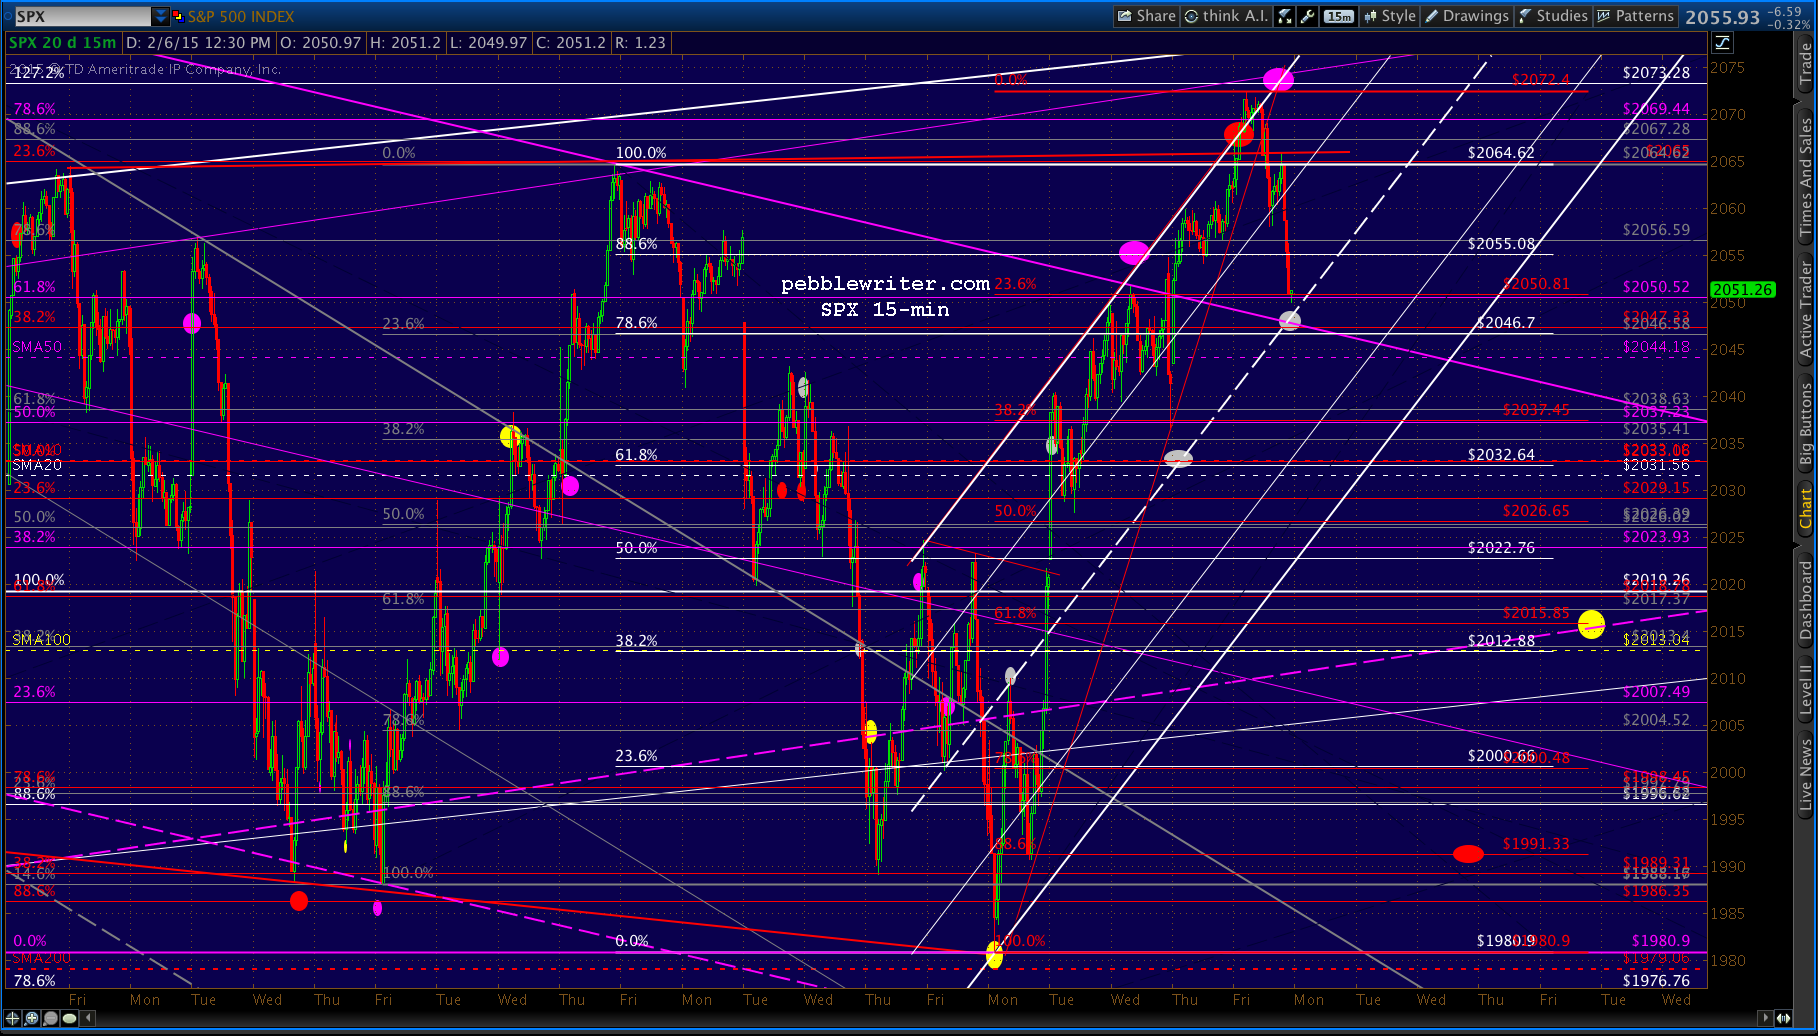
SPX tagged the SMA100 and bounced about 8 points so far.  In case you’re thinking “this can’t go on forever; the triangle is contracting,” you’re right.  The triangle’s apex looks to be about Feb 16.  And, the top of the purple channel passes beneath the triangle’s lower bound next Wednesday.

    But, as we saw last night, USDJPY’s rises produce more upside for SPX than its falls produce downside.  This has been the case for the past two years, and isn’t likely to change anytime soon.

    USDJPY is coming up on the purple channel top again, meaning yet another opportunity for a reversal.

    continued for members

    I believe SPX will get down to our target — or at least close to it when USDJPY reverses.  At that point, it’ll be up to the algos to see whether or not they can erase January’s negative print (-1.83%) by the end of the day.

    2015-01-30-SPX 15 0704By my calculations, we’d need somewhere around 36 points, or SPX 2051.  It would be a massive reversal off today’s lows, so probably not too likely.  But, I wouldn’t put it past them to try.  According to Deutche Bank’s Jim Reid:

    A good January has usually (but not always) been associated with a good year for US equities. Indeed using 87 years of data from Bloomberg, there have been 55 positive Januaries with 44 of those going on to have positive years with an average increase of about +20%. Of the 32 negative January months that we’ve had since 1928, ‘only’ 14 of those went on to finish the year higher in the end with average annual returns of around +14%. The remaining 18 negative Januaries were associated with a negative full year performance with an average return of around -14%. Clearly past performance doesn’t guarantee future returns and its a bit spurious but its always fun to look at. Indeed post crisis we’ve seen a few counter trend moves as three years (2014, 2010 and 2009) have seen the year bounce back from a bad January performance.

    Note that the exceptions to a bad January portending a bad year came in years with substantial QE.  Probably just a coincidence…

    Of course, if they decide to let USDJPY give up that triangle, then there’s plenty more downside — the SMA200 at 1974, for starters.  But, as we pointed out yesterday, that would mean wasting a perfectly good IH&S.

    UPDATE:  11:10 AM

    USDJPY just dipped below the triangle…

    2015-01-30-USDJPY 60 0810…meaning SPX’s bounce is fading fast.

    2015-01-30-SPX 15 0810UPDATE:  2:20 PM

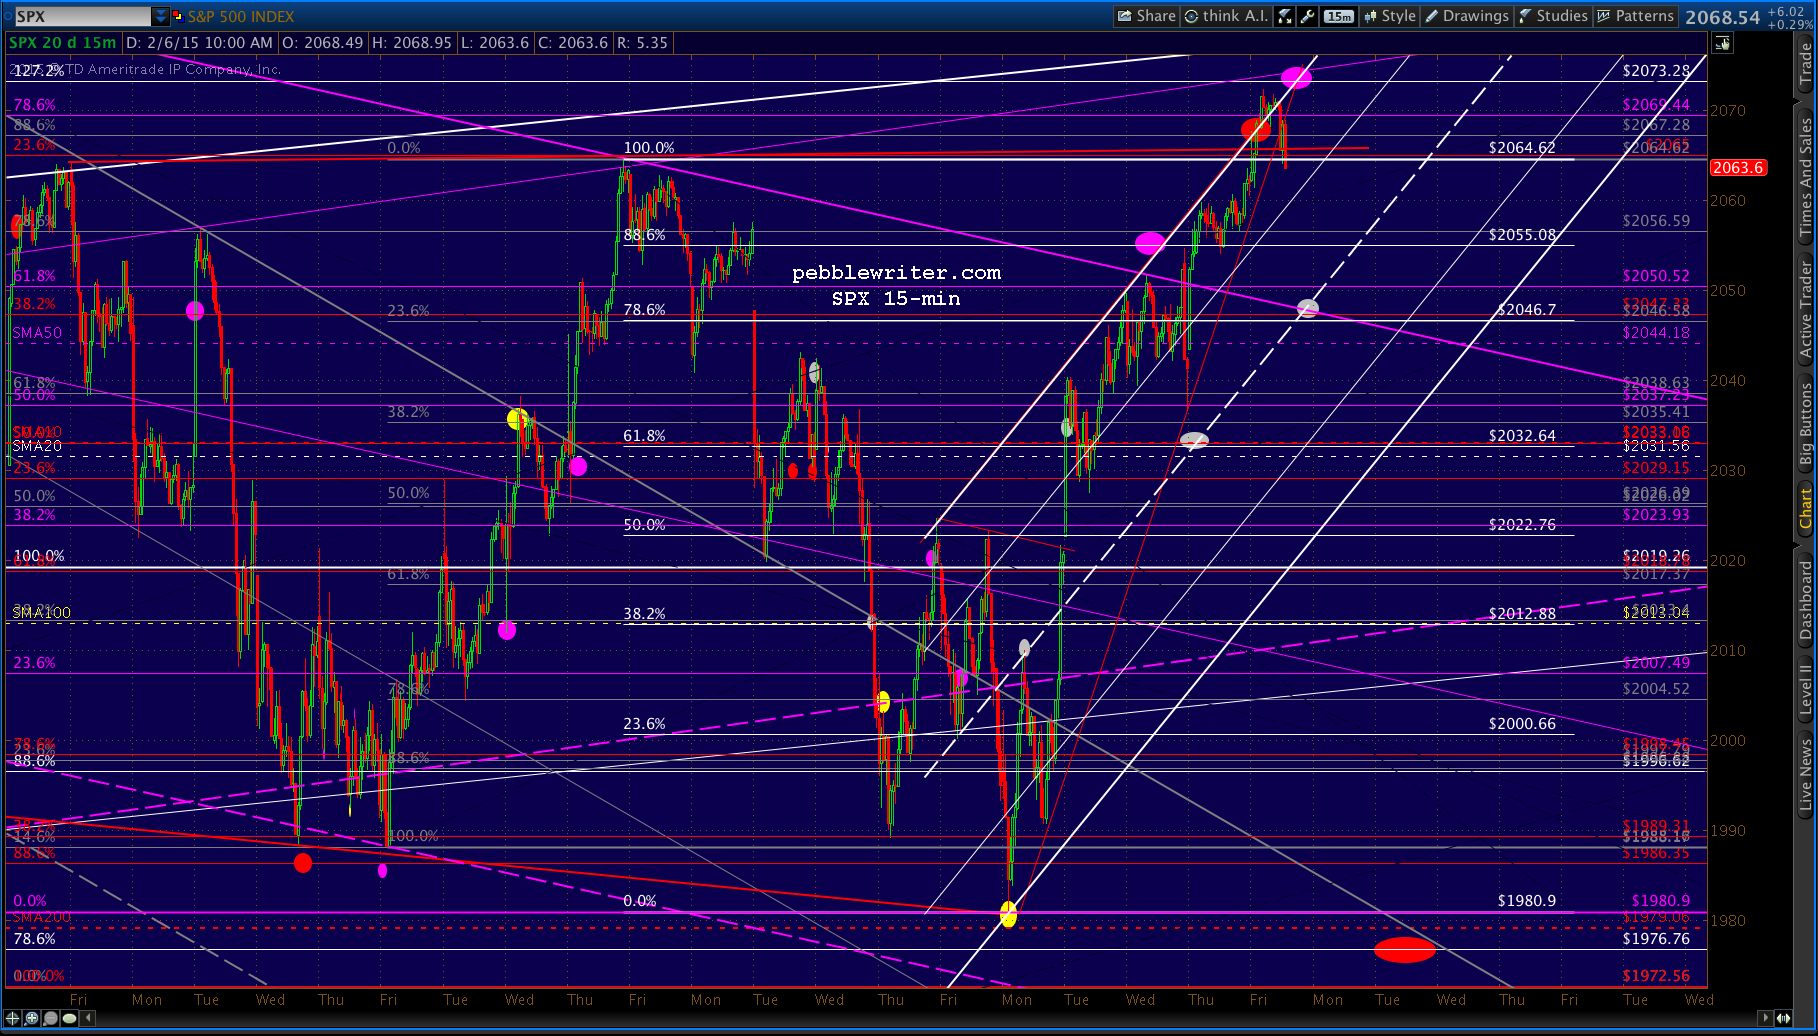
    Another miraculous recovery for stocks…

    2015-01-30-SPX 60 1122…thanks to USDJPY, which was just kidding about the drop through the floor of the triangle.

    2015-01-30-USDJPY 15 1119USDJPY will need to poke through the yellow channel if SPX is to really get going.

    UPDATE:  3:55 PM

    Bit of a headfake there, but things are turning negative going into the close.  Or is the sell-off the headfake?

    2015-01-30-USDJPY 15 1255 2015-01-30-SPX 60 1255GLTA.


  • Charts I’m Watching: Jan 29, 2015

    Yesterday was another one of those days when everything just fell into place.  From the initial post:

    With the close at the SMA10 support yesterday, and a subsequent pop in the futures, the immediate trend looks to be higher…

    Continued in the members’ section:

    If SPX can hang on to the TL connecting to the 2019 lows, that TL could be considered part of a larger rising channel… If, however, prices drop below the tentative purple channel bottom, then our Gartley Pattern target at 2004 starts to look pretty good.

    The pre-opening chart (below) showed both upside and downside scenarios — courtesy of the impending FOMC announcement.  The key to which direction SPX took was the purple channel bottom mentioned above.

    2015-01-28 SPX 15 0615SPX popped at the opening, gaining 13 points to tag our upside target at 2040, then reversed dramatically in three waves to tag our 2004 target in the closing minutes (bottomed out at 2001.49.)

    2015-01-29 SPX 15 0600The only adjustment we needed to make was to move the yellow target to later in the day — thanks to the initial spike following the Fed’s proclamation that the economy is hunky dory.

    We called for a rebound at 2004, as it completes a Gartley Pattern (the white .786) as well as a Crab Pattern (the smaller, white 1.618.) and  — yet, again — tests the SMA100 and a key channel midline.

    The falling red channel has served us well on the slide from 2064.  At this point, however, SPX has to decide whether to respect the falling white channel, into which it strayed in its latest backtest.

    continued for members(more…)