

Yesterday was another one of those days when everything just fell into place. From the initial post:
With the close at the SMA10 support yesterday, and a subsequent pop in the futures, the immediate trend looks to be higher…
Continued in the members’ section:
If SPX can hang on to the TL connecting to the 2019 lows, that TL could be considered part of a larger rising channel… If, however, prices drop below the tentative purple channel bottom, then our Gartley Pattern target at 2004 starts to look pretty good.
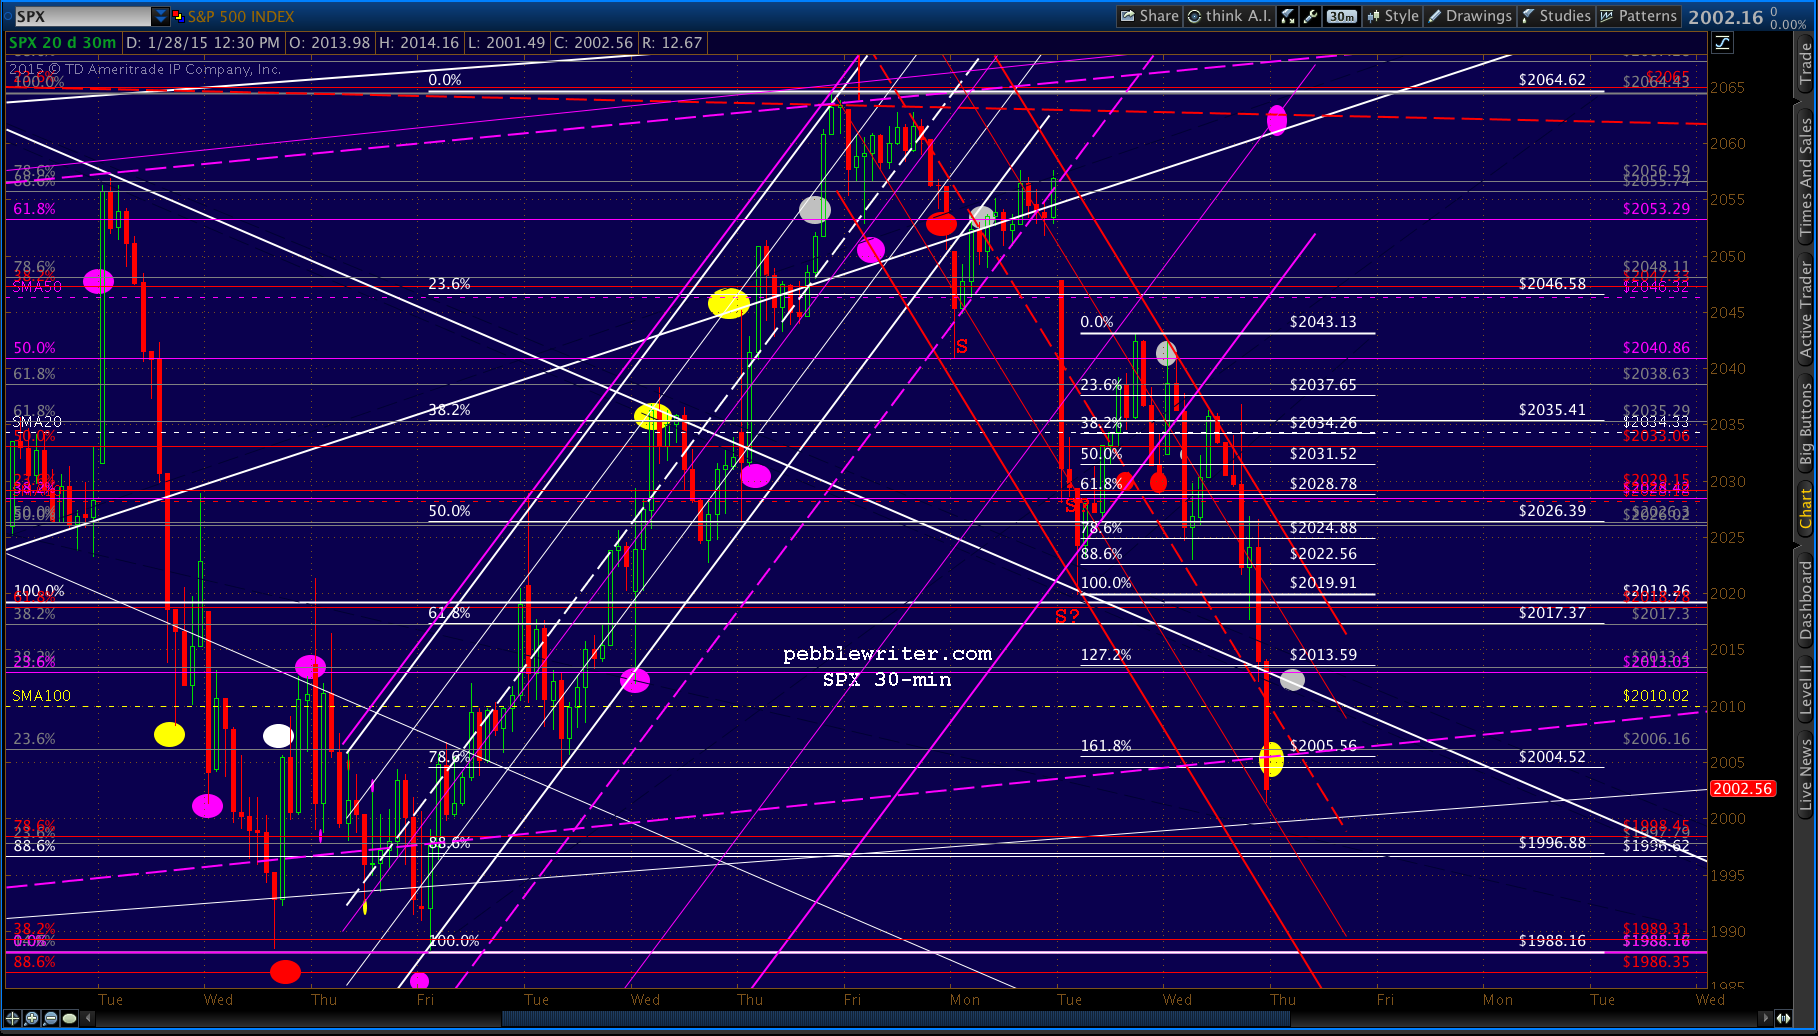
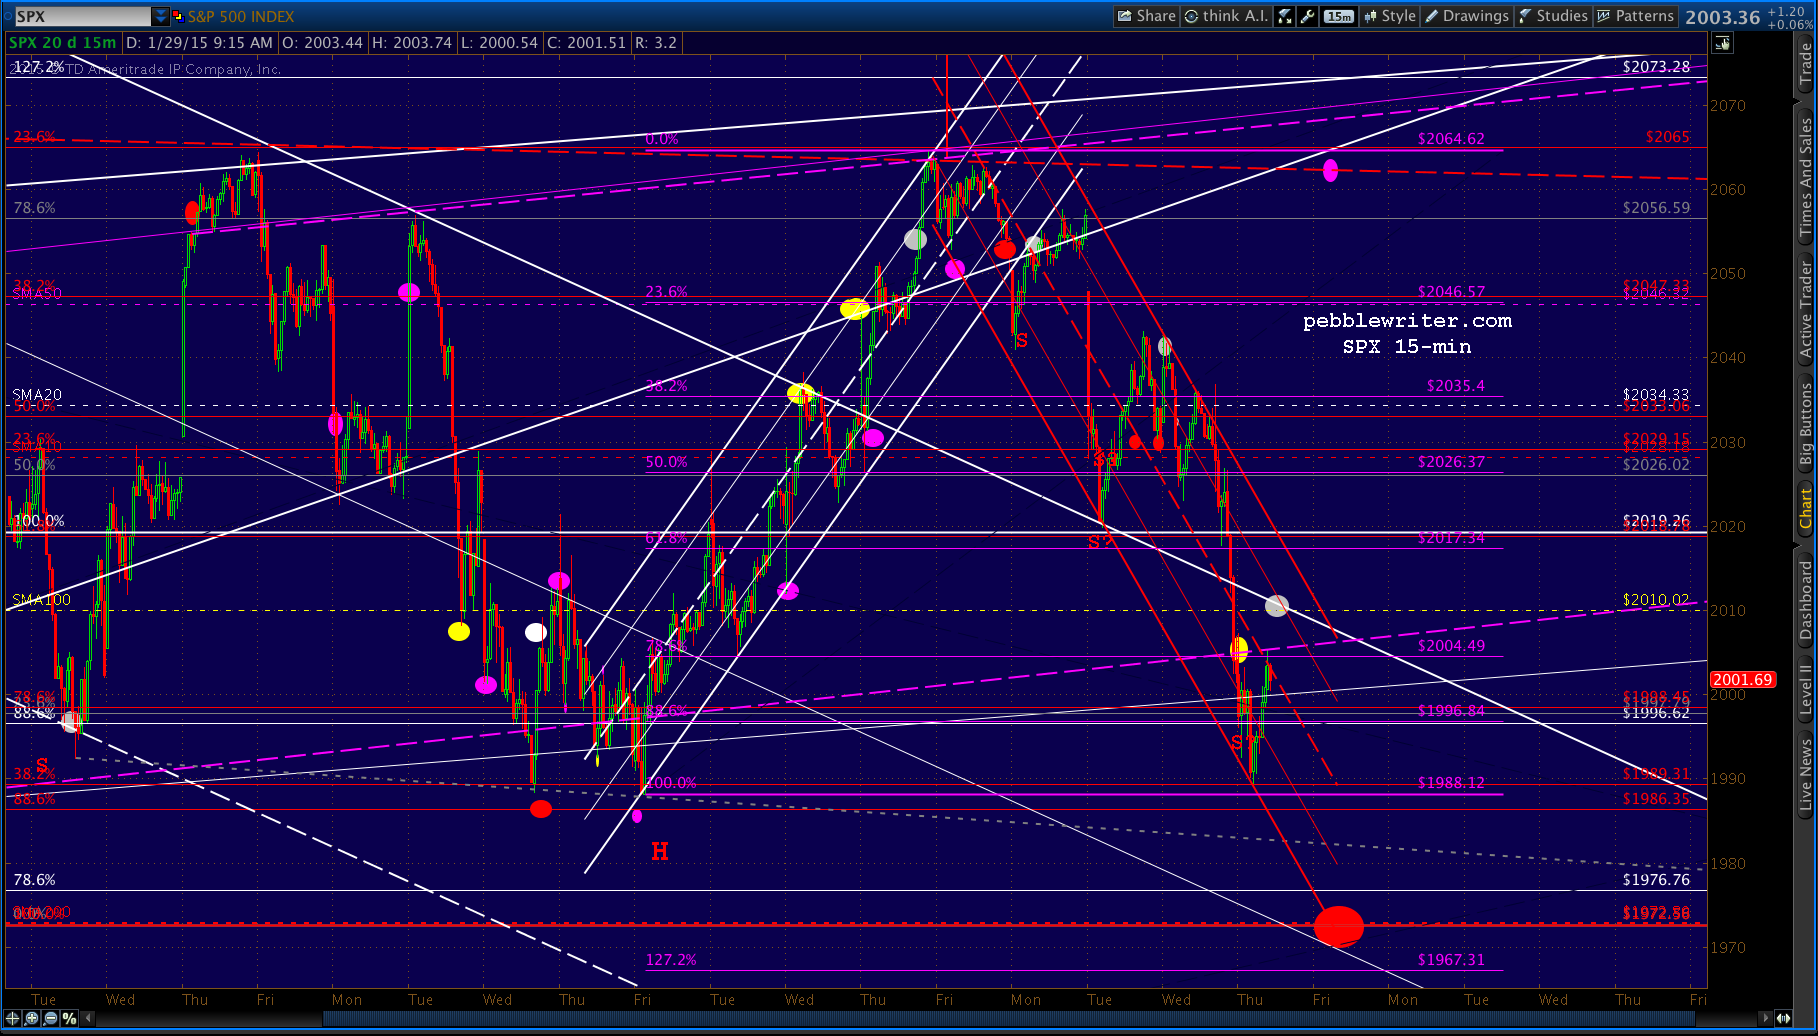
The pre-opening chart (below) showed both upside and downside scenarios — courtesy of the impending FOMC announcement. The key to which direction SPX took was the purple channel bottom mentioned above.
 SPX popped at the opening, gaining 13 points to tag our upside target at 2040, then reversed dramatically in three waves to tag our 2004 target in the closing minutes (bottomed out at 2001.49.)
 The only adjustment we needed to make was to move the yellow target to later in the day — thanks to the initial spike following the Fed’s proclamation that the economy is hunky dory.
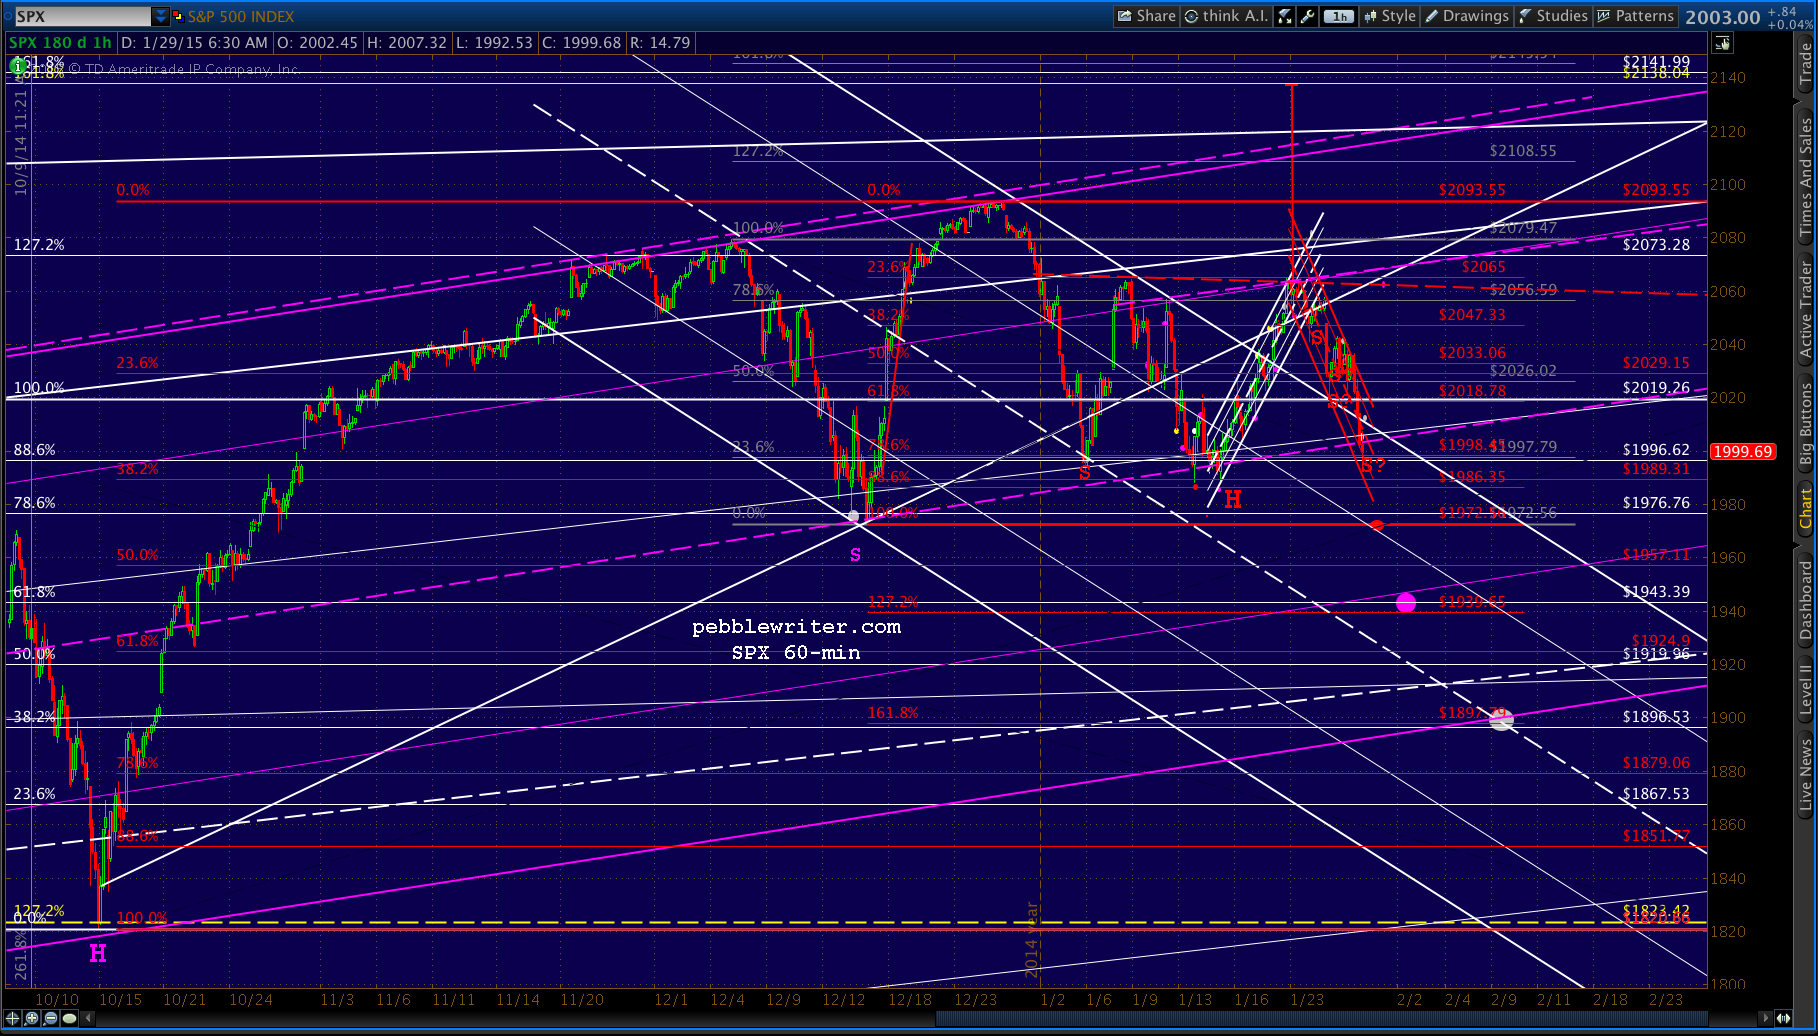
We called for a rebound at 2004, as it completes a Gartley Pattern (the white .786) as well as a Crab Pattern (the smaller, white 1.618.) and — yet, again — tests the SMA100 and a key channel midline.
The falling red channel has served us well on the slide from 2064. At this point, however, SPX has to decide whether to respect the falling white channel, into which it strayed in its latest backtest.
continued for members…
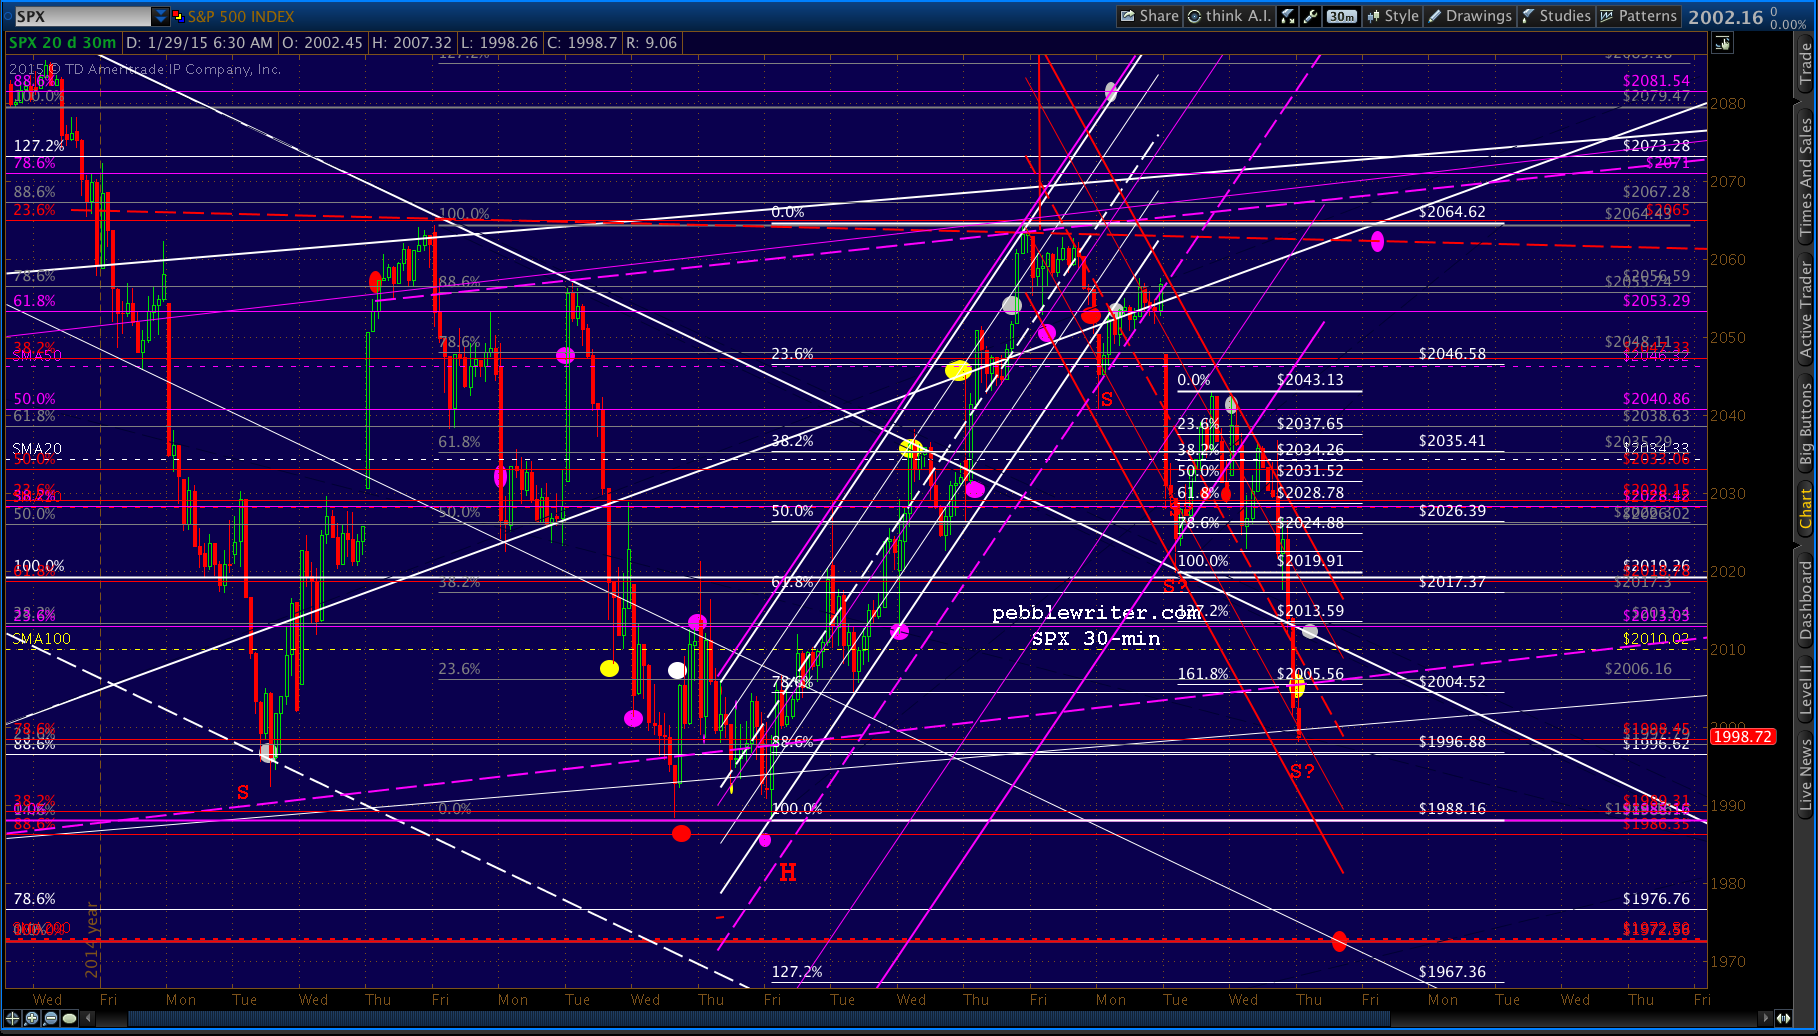
We should see a backtest of the SMA100 (2010), followed by the white channel itself. If prices can push up and out of the white channel, then SPX can go on and attempt to complete that IH&S. Otherwise, the SMA200 (1972ish) is our next downside target.
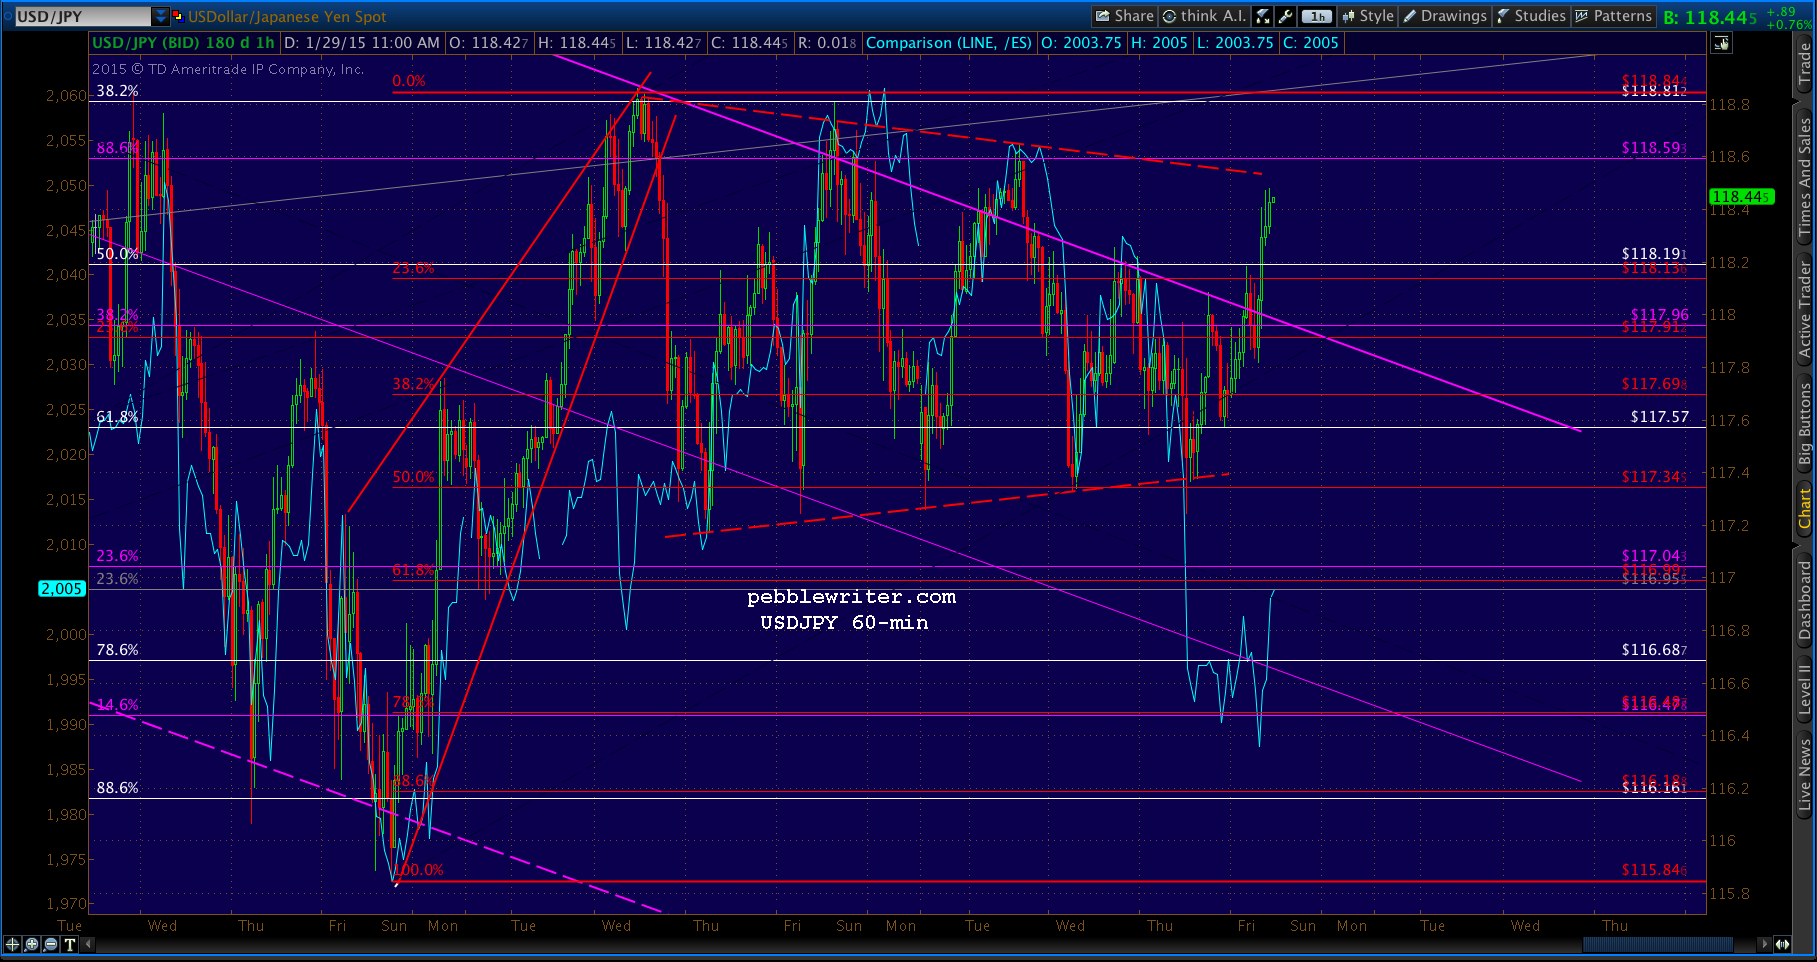
 Note that USDJPY bounced off the lower triangle bound, and is again flirting with the channel top and a return to the triangle upper bound (red, dashed.)
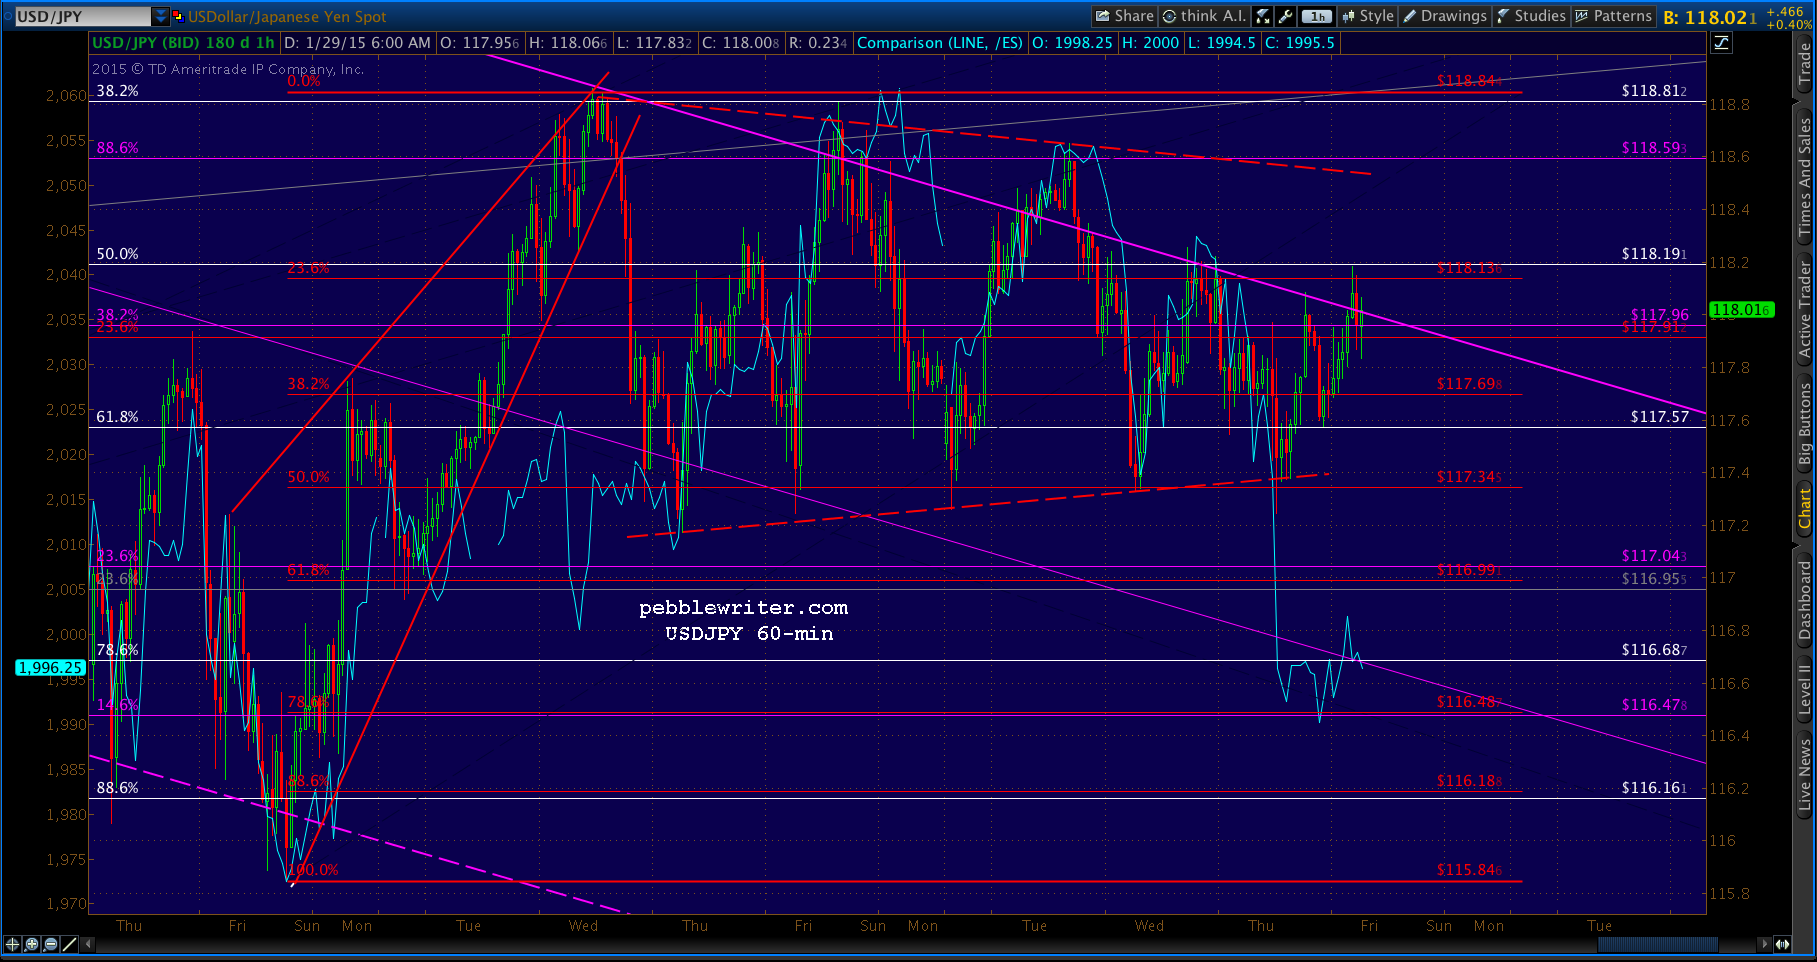 I believe it’ll pop out of the channel — even if it’s only intra-day — and provide a nice lift for SPX. If it doesn’t, then the falling red channel could get SPX down to the SMA200 by late today or tomorrow.
UPDATE: 9:40 AM
USDJPY popped above the channel top, then scampered back below — leaving SPX without any go juice after backtesting the SMA100. It’s going to try here at the .886 at 1998.88. Note that the left shoulder of our potential IH&S was at 1992.44, so we’ll put a red “S” at the same price — as a reversal here would be symmetrical. A drop below 1988.12 would invalidate the whole pattern.
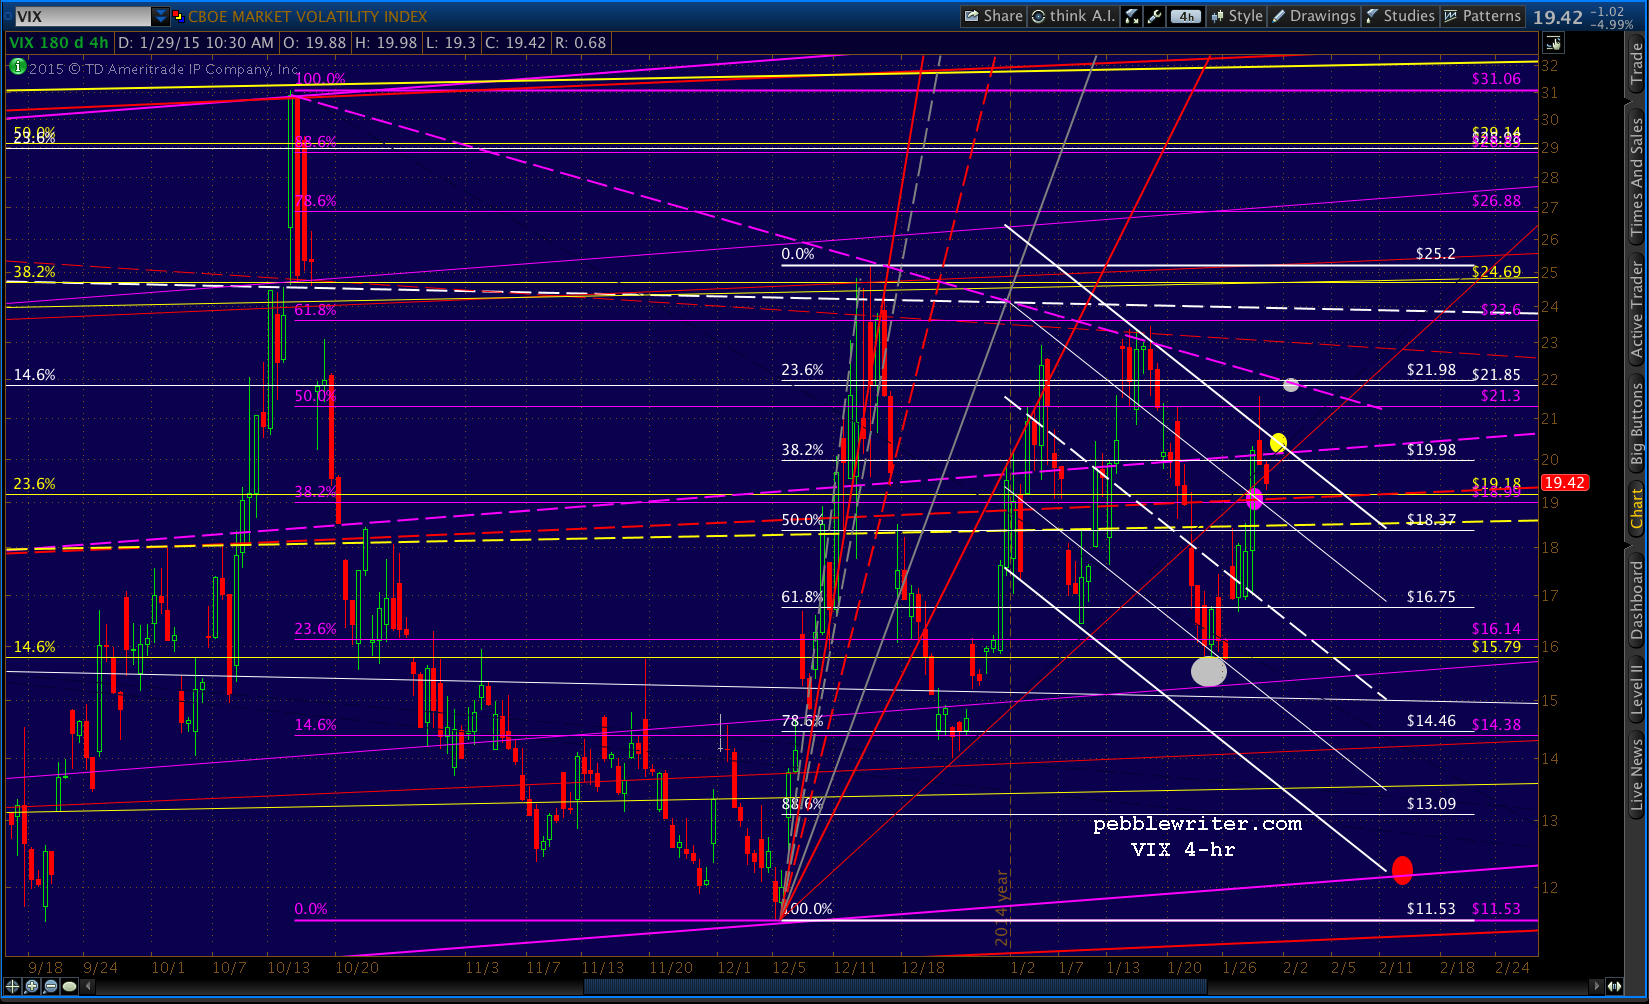
 VIX — which reached our upside target yesterday — has now reached the top of its falling white channel.
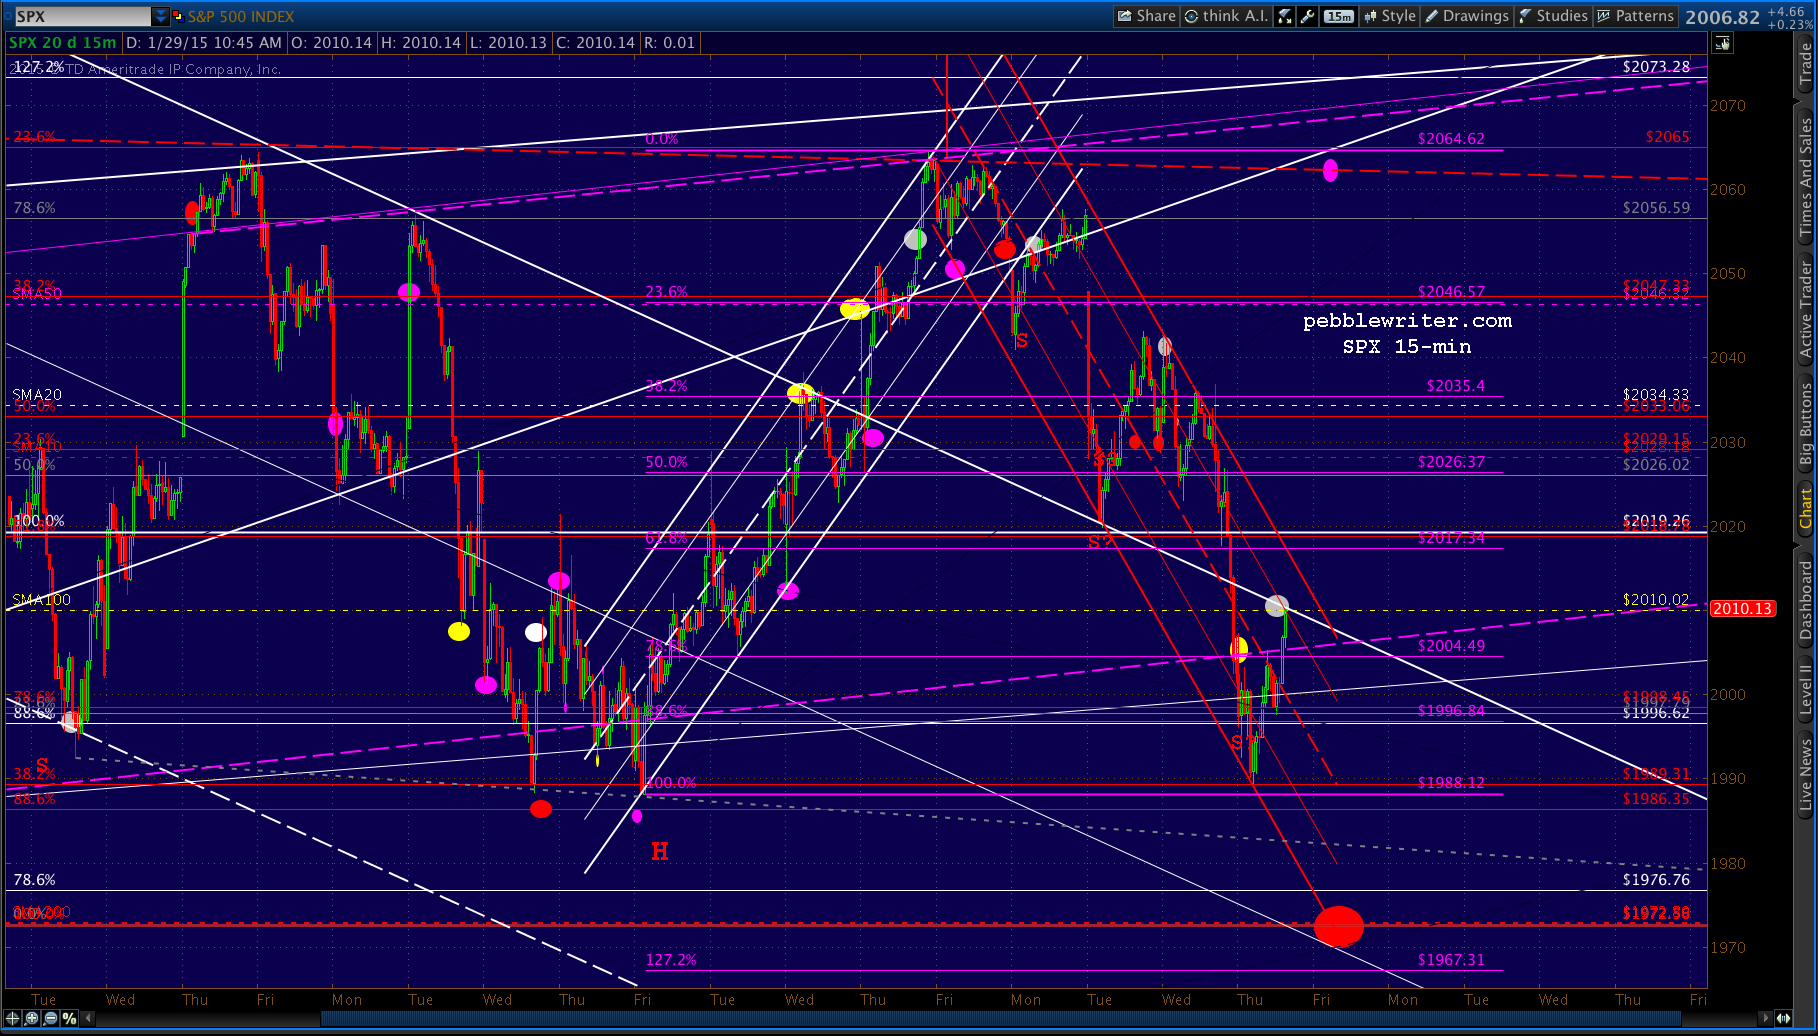
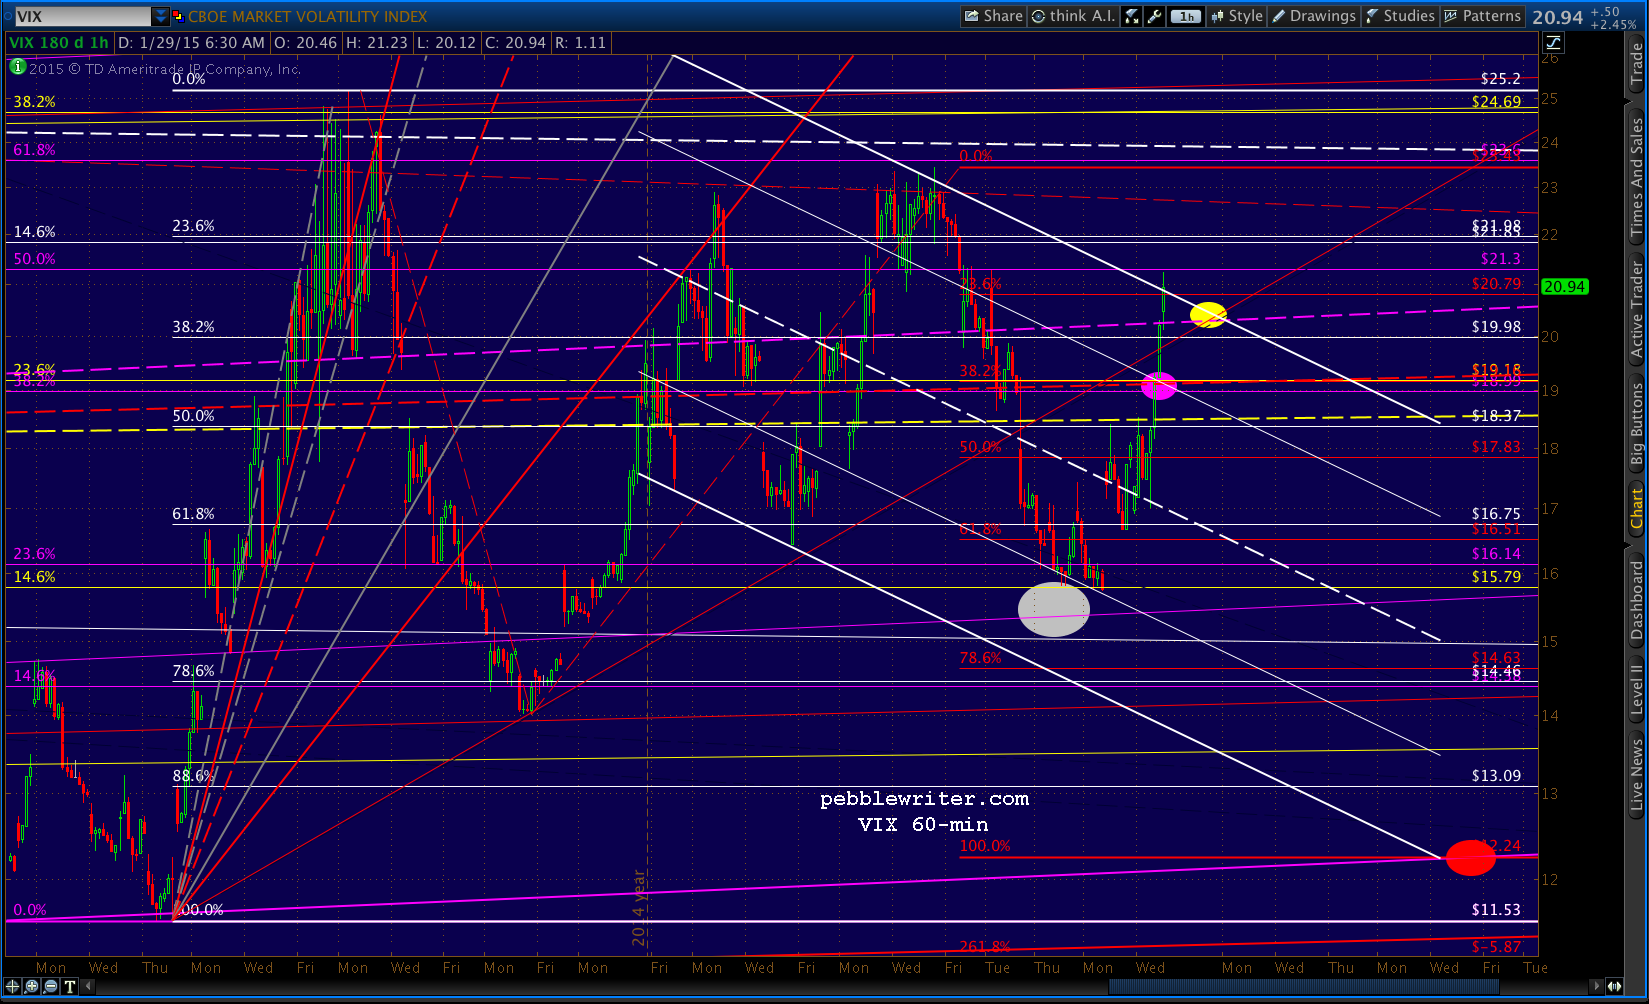 Assuming SPX reverses here, our first obstacle will be the white channel top up at 2012 or so.
Note that the purple channel midline mentioned above has stopped three previous declines. If it should fail this time, the .236 line is down around the red 1.272 at 1939 and the bottom is near the red 1.618 at 1897.79.
 Yesterday’s incursion into the white channel could be chalked up to wiggle room in its placement. But, a close today without clearly breaking back out would do some serious damage to the idea of a breakout.
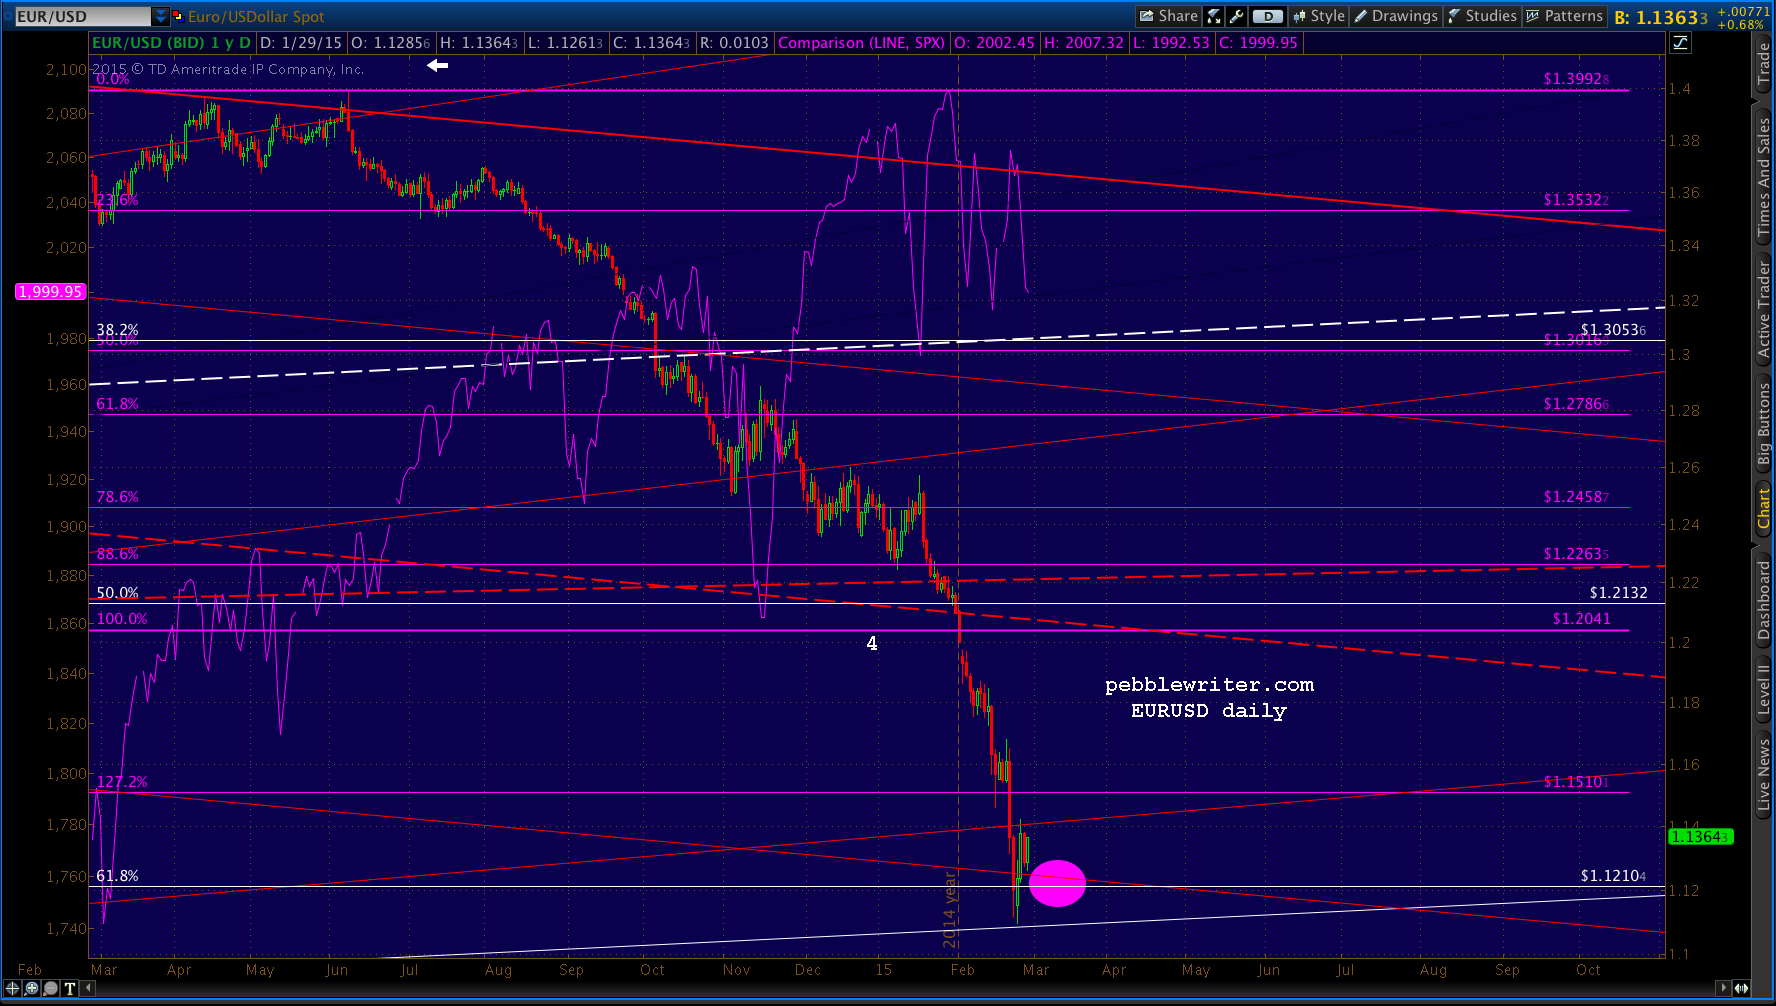
As we’ve maintained all along, stocks are almost totally dependent on USDJPY for their ascent. The chart below shows the difficulty SPX has faced since USDJPY topped out in December. Needless to say, the purple TL needs to hold in order for bulls to have any hope.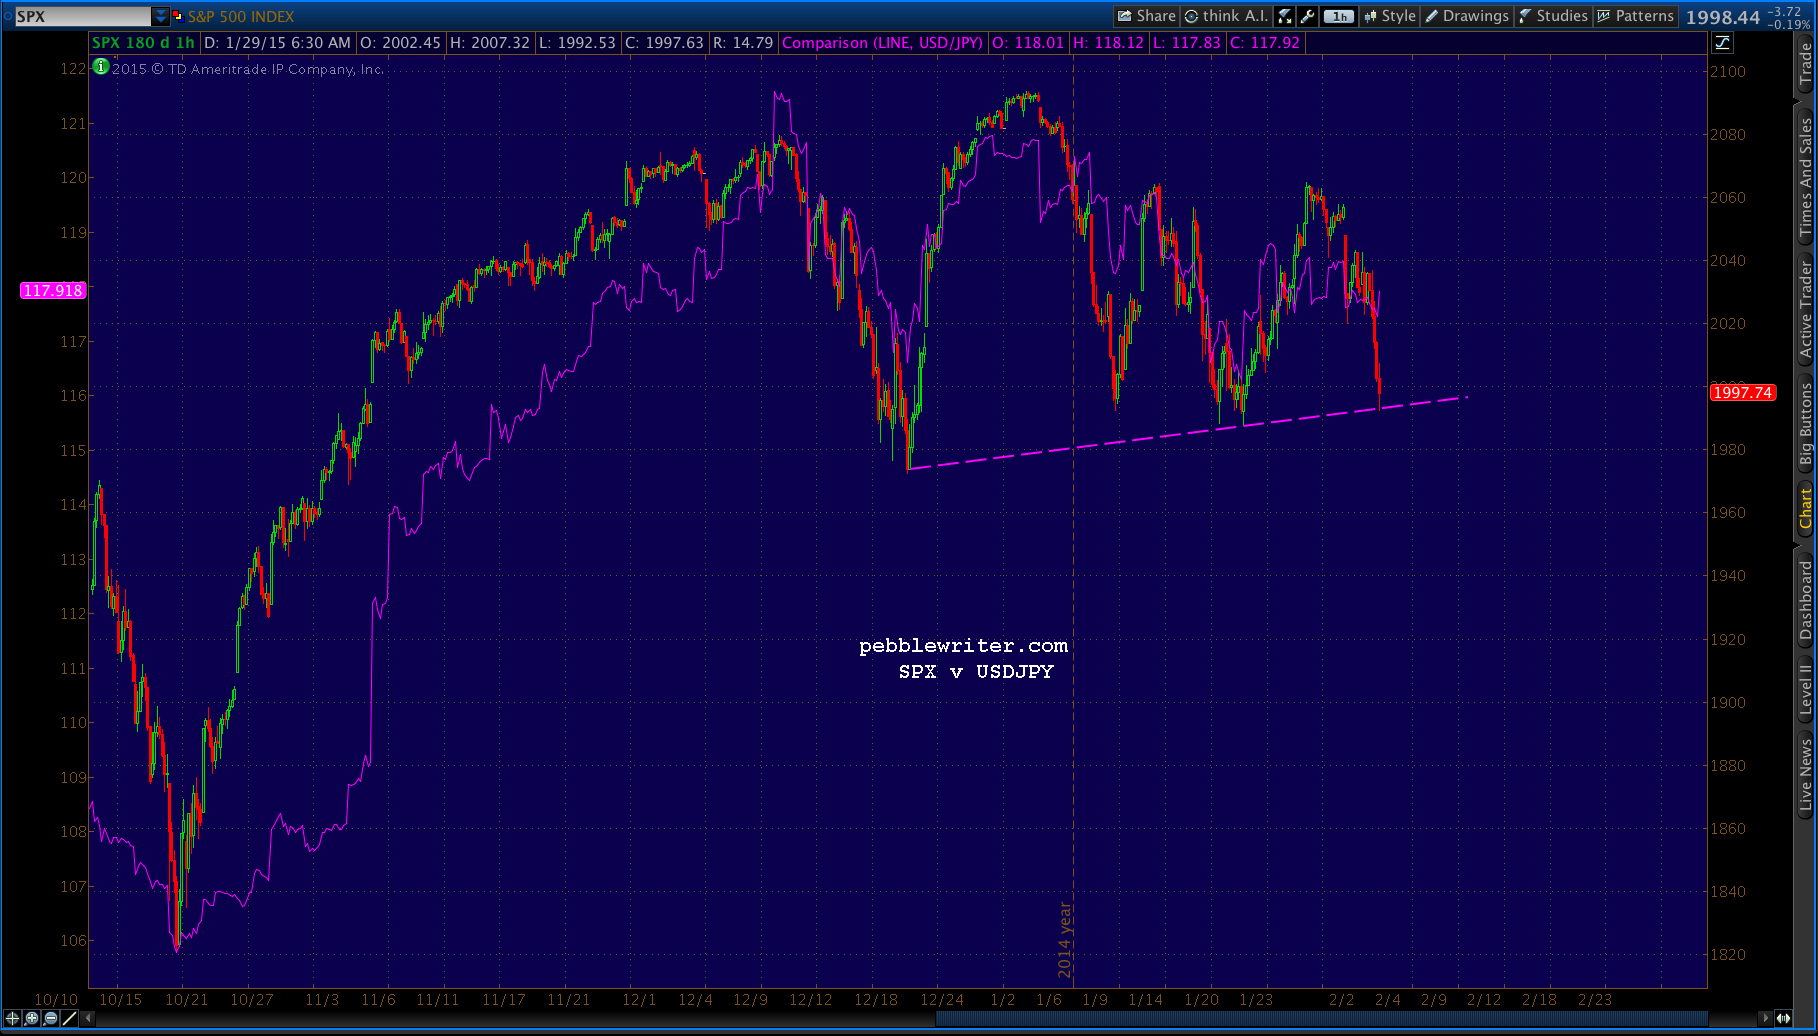 TPTB were clearly hoping for EURUSD to pick up the carry trade where USDJPY left off, but the pair had already made its move. It bottomed at our 1.12 target on Jan 23 and has since bounced higher.
 Until it can reestablish a downturn, USDJPY will continue to carry the ball.
UPDATE: 12:20 PM
Speaking of carrying the ball… USDJPY broke above the purple channel top as expected and is closing in on the red triangle top.
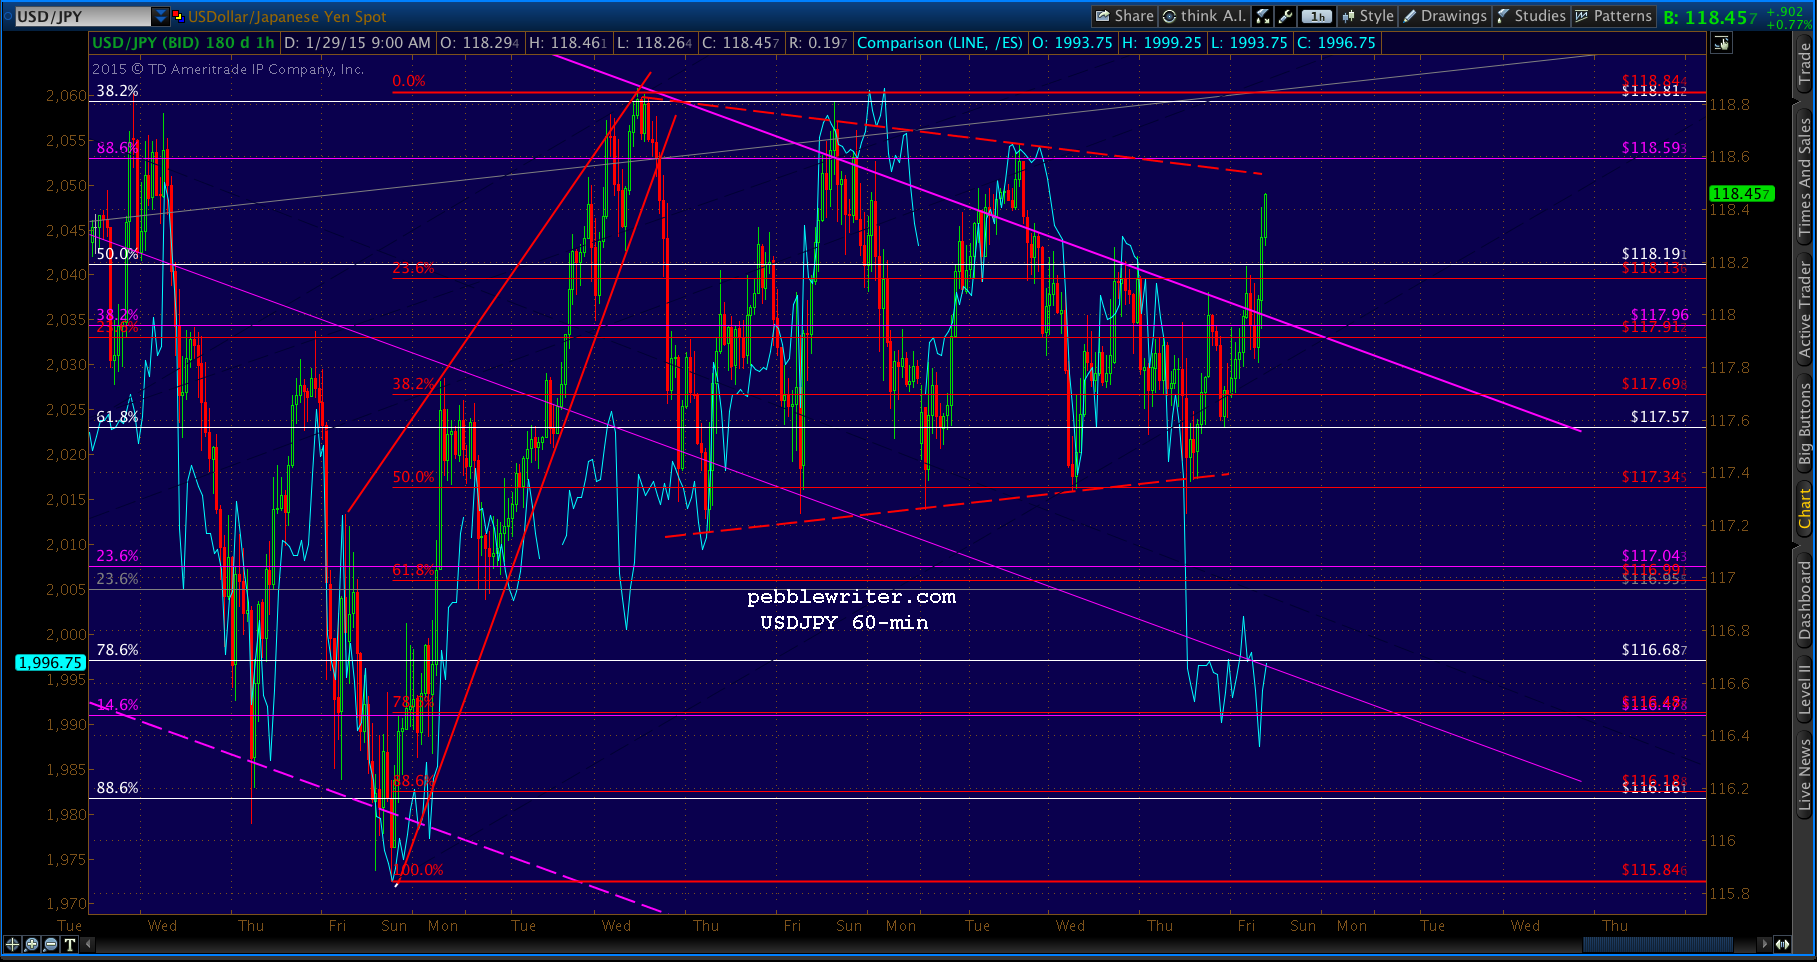 SPX reached the purple midline and is anticipating USDJPY’s reversal. If USDJPY should push through temporarily, watch for the SMA100 to be backtested at its intersection with the falling white channel (white dot.)
If USDJPY actually breaks out (somewhat less likely) then we’ll see higher.
 It’s ironic that in order to reach the SMA200 (at least in the next day or two) SPX would have to discard a perfectly good IH&S Pattern.
UPDATE: 1:45 PM
SPX just reached the white channel top. USDJPY is getting close, but hasn’t quite reached the triangle upper bound, so I wouldn’t be surprised to see SPX overshoot a little bit.
The top of the falling red channel intersects with the purple .618 at 2017.34. Anything higher would be a breakout.
 USDJPY: close, but not quite there…
 VIX: looking toppy — at least on an interim basis. We should see a backtest of the broken channel midline on this move, but note the white dot on the TL connecting the previous tops. This could easily correlate with a dip to SPX’s SMA200, and would make for a good line in the sand.
 TPTB might want to breach Tuesday’s low (2019.91) in order to screw up the potentially bearish wave count. A move by USDJPY above the triangle top could do it. Be cautious, as the algos seem to be back in charge.
I like the idea of a drop from here to retrace some of the gains from this morning’s 1989 lows, followed by an overnight plunge to tag 1967-1972 in the morning. It would inject the maximum degree of confusion into the “markets,” thus complying with Pebblewriter’s Razor.
Most people are familiar with Occam’s Razor:
The simplest explanation is usually the right one.
And, Hanlon’s Razor is quite popular:
Never attribute to malice that which can be adequately explained by stupidity.
But, where market makers are concerned, I swear by Pebblewriter’s Razor:
Never attribute to random chance that which can be easily explained by market makers’ malice.
I have to run out, but will try to post towards the end of the session. Keep an eye on that red channel, and stay alert to the possibility of a fake breakout. GLTA.