Yesterday’s forecast called for a dip to the 50-day moving average. From the members’ section in our initial post:
I’m looking for the initial move to take SPX to our 2046.7 target, with a secondary target of the SMA50 at 2043.90. If that should fall, the next strong support isn’t until the white .618 at 2032…
 SPX accommodated with fairly accurate tags at our target prices and times.
 We finished up the day with some indecision about that lower white target:
Quick update…2nd target hit, and a 50:50 shot on the third. VIX and bonds suggest it’ll happen tomorrow morning. But, TPTB might easily hold the line here. Hold the short only if you can hedge and/or handle the overnight risk.
For the umpteenth time, news (founded or not) out of Greece dominated the overnight sessions. Zerohedge has been running a story (citing Bloomberg) that — following offers from Russia and/or China to fund its deficits — Greece has obtained a 6-month extension on its debt deal with the ECB.
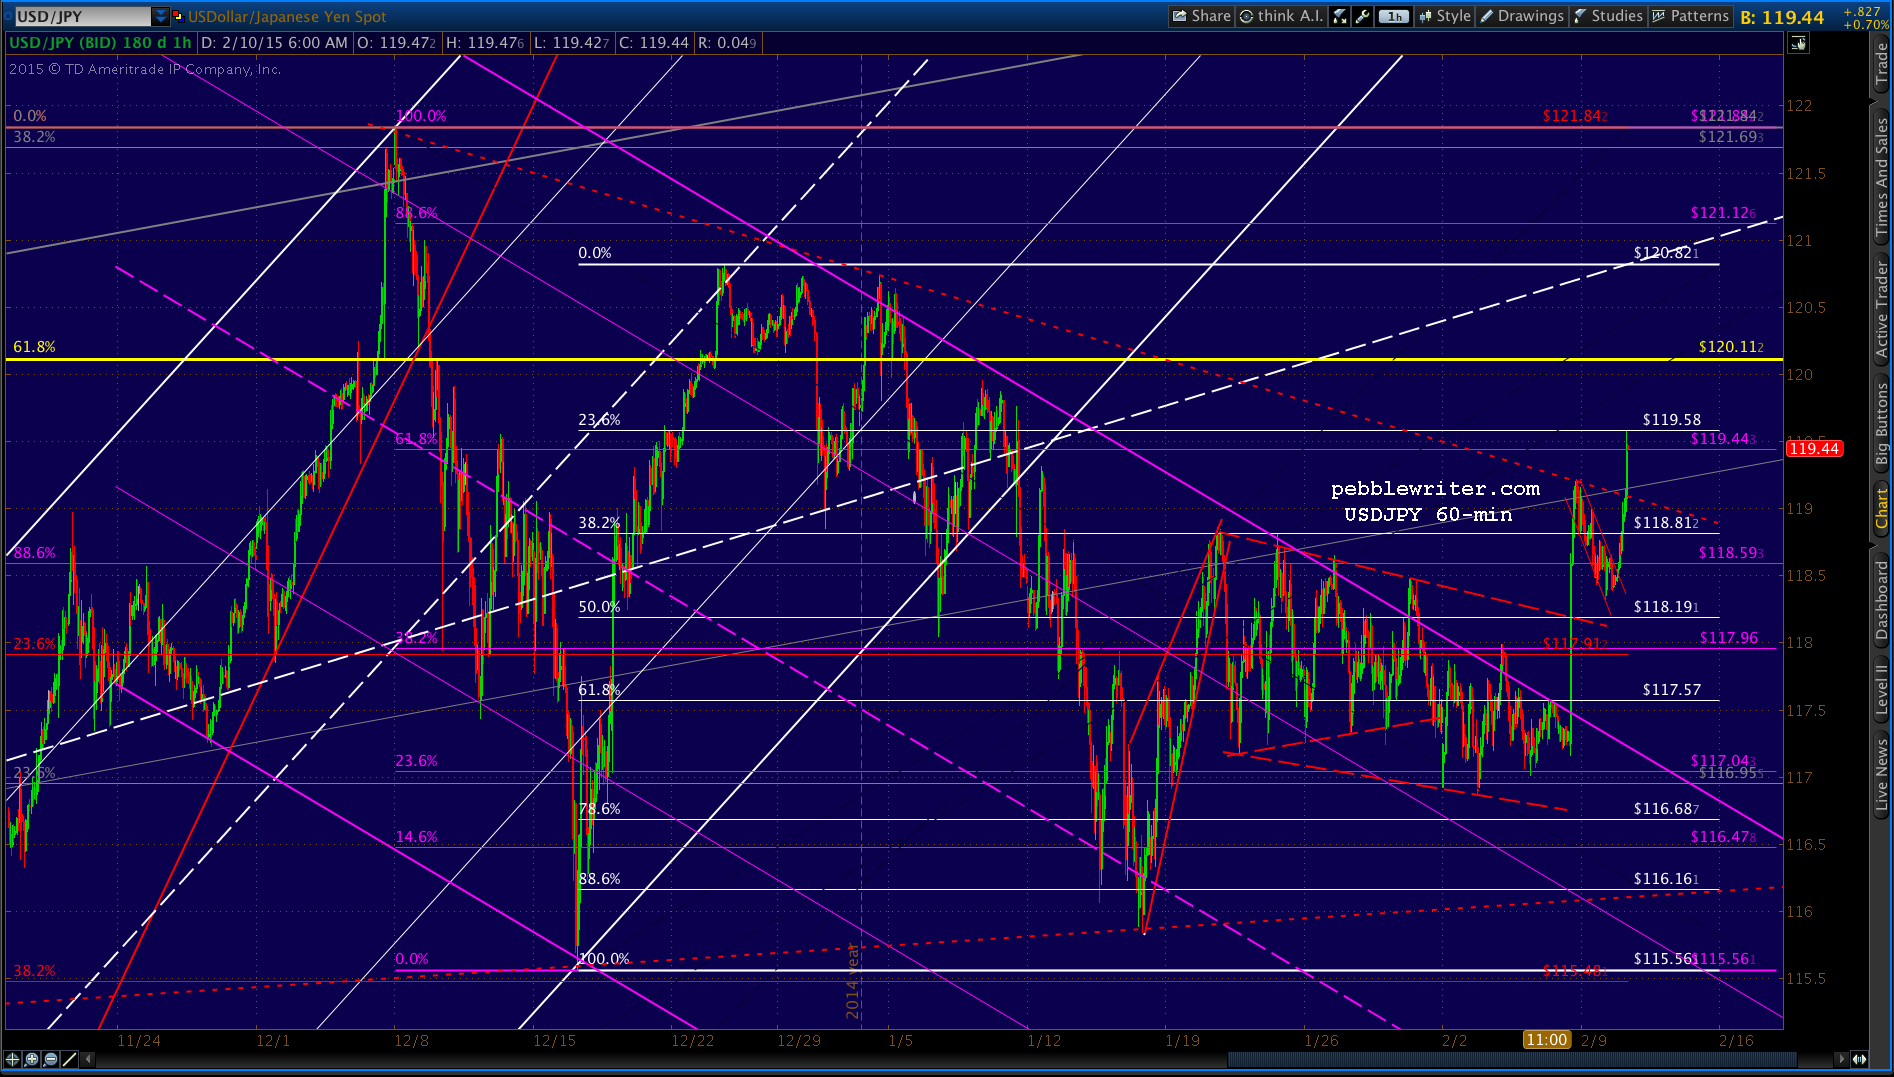
Predictable, markets have ramped higher. USDJPY broke through the trend line off the Dec highs — sending ES up over 12 points as we go to press.
 continued for members…
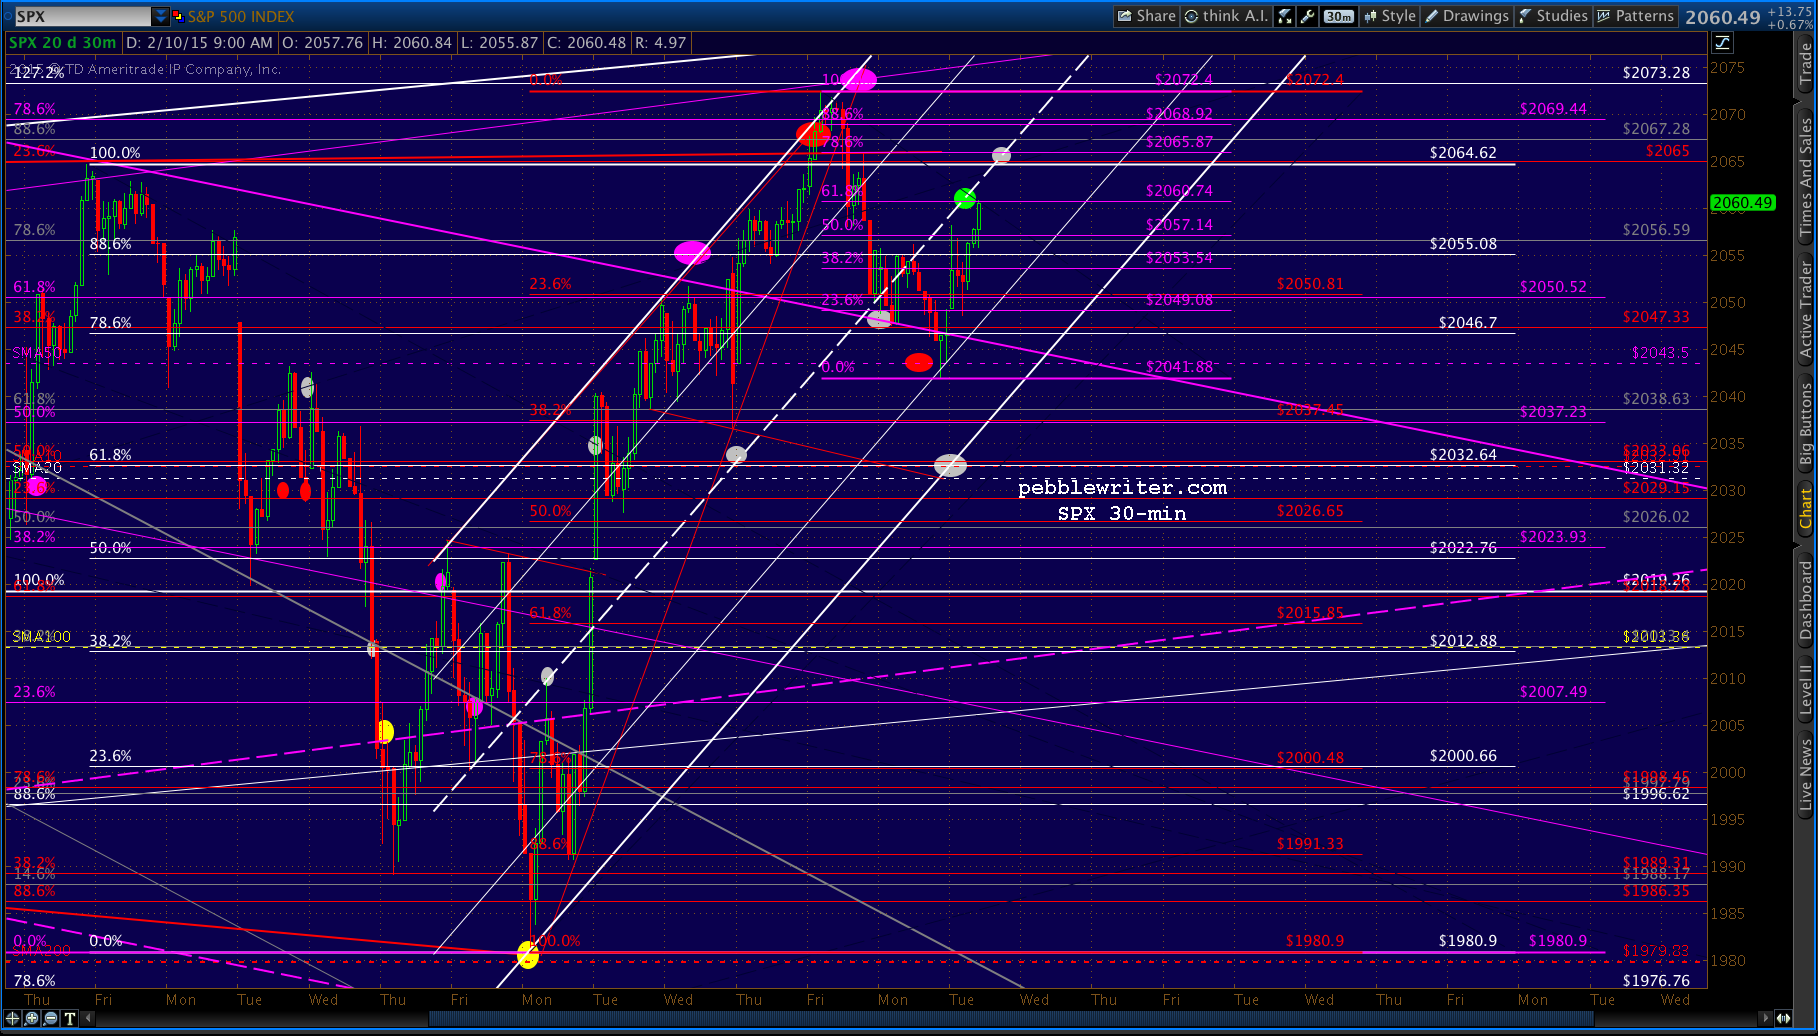
While the USDJPY breakout is impressive, it is hitting resistance at the white .236. Therefore, follow-though might be difficult. I’m looking for a pop in SPX to the purple .618 at 2060.74, after which we might see it retreat. 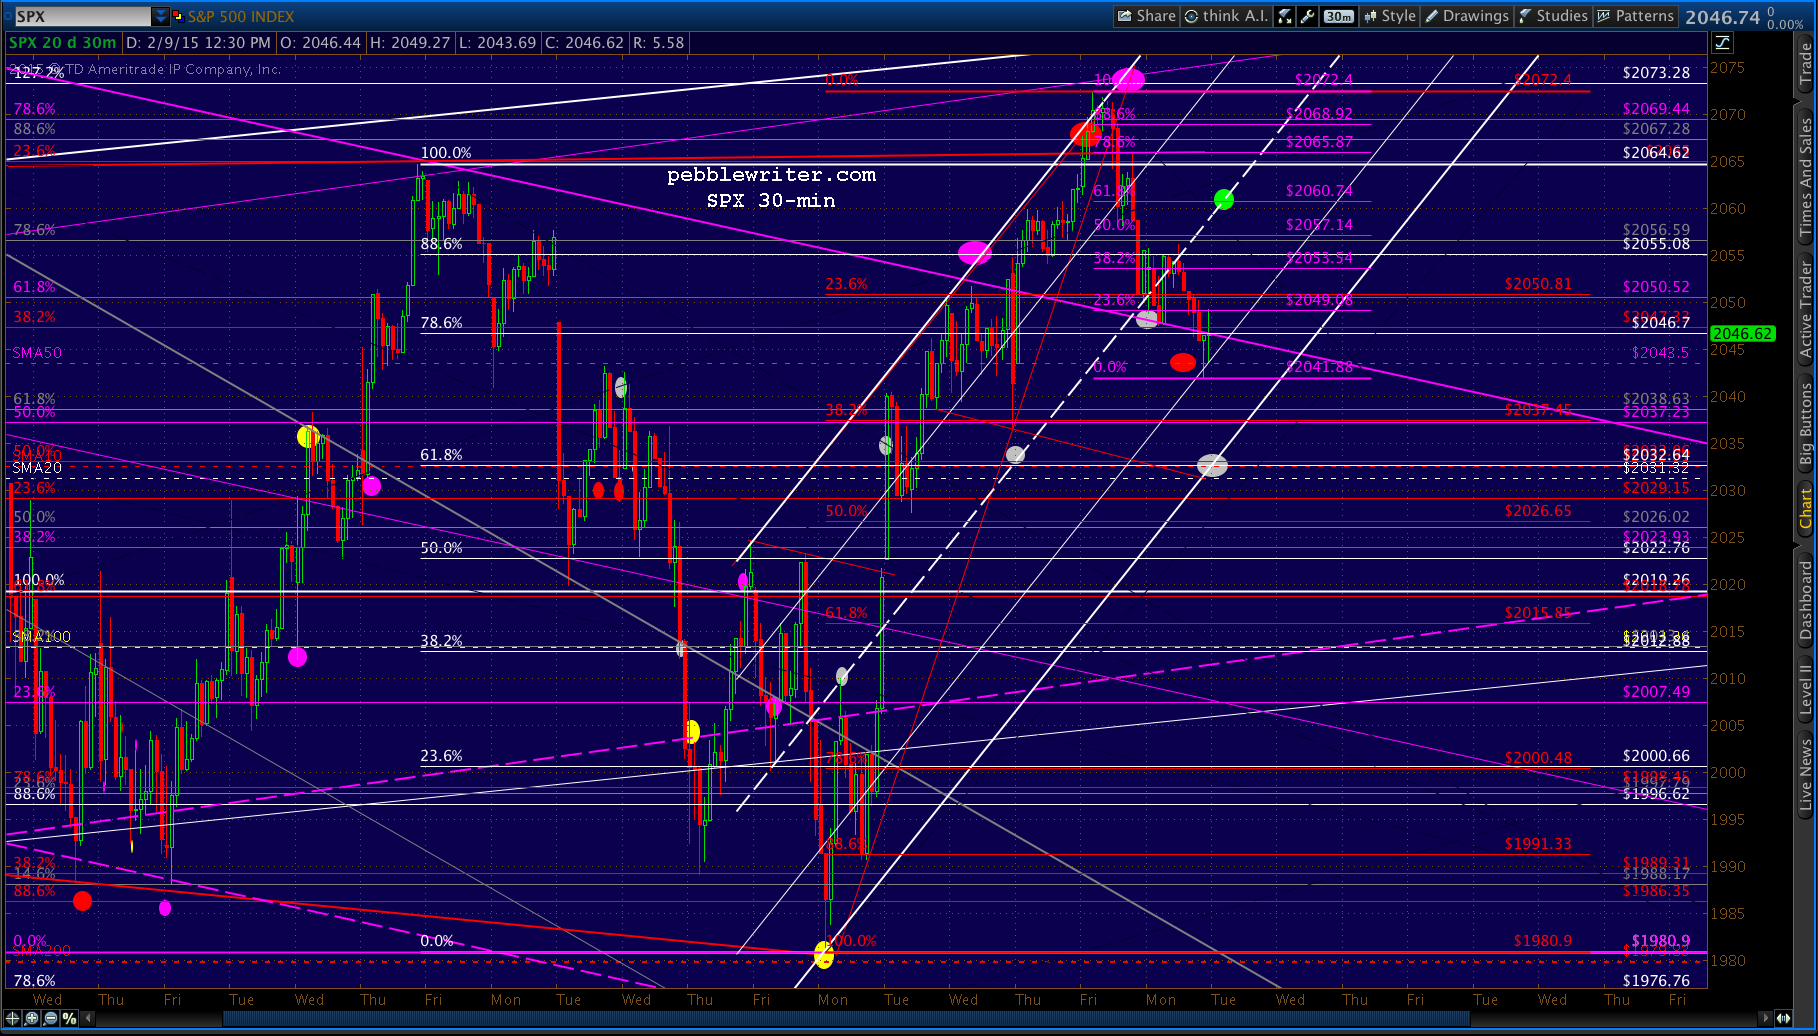 To be clear, SPX’s backtest on the purple channel top is definitely bullish. If it holds, and SPX can push through the previous highs, then 2138 is back in the spotlight. But, USDJPY will need to cooperate — principally by breaking through the yellow .618 at 120.11. Recall that this is a key Fib level, and the one that marked the start of SPX’s troubles back in December.
 It’s now safe to say the falling purple channel is kaput.
UPDATE: 12:17 PM
Just reached our first target at the .618. I think it’ll keep going, probably up to the .786 at 2065.87 — though it might not be a straight line.
 VIX looks like it might get a bounce here.
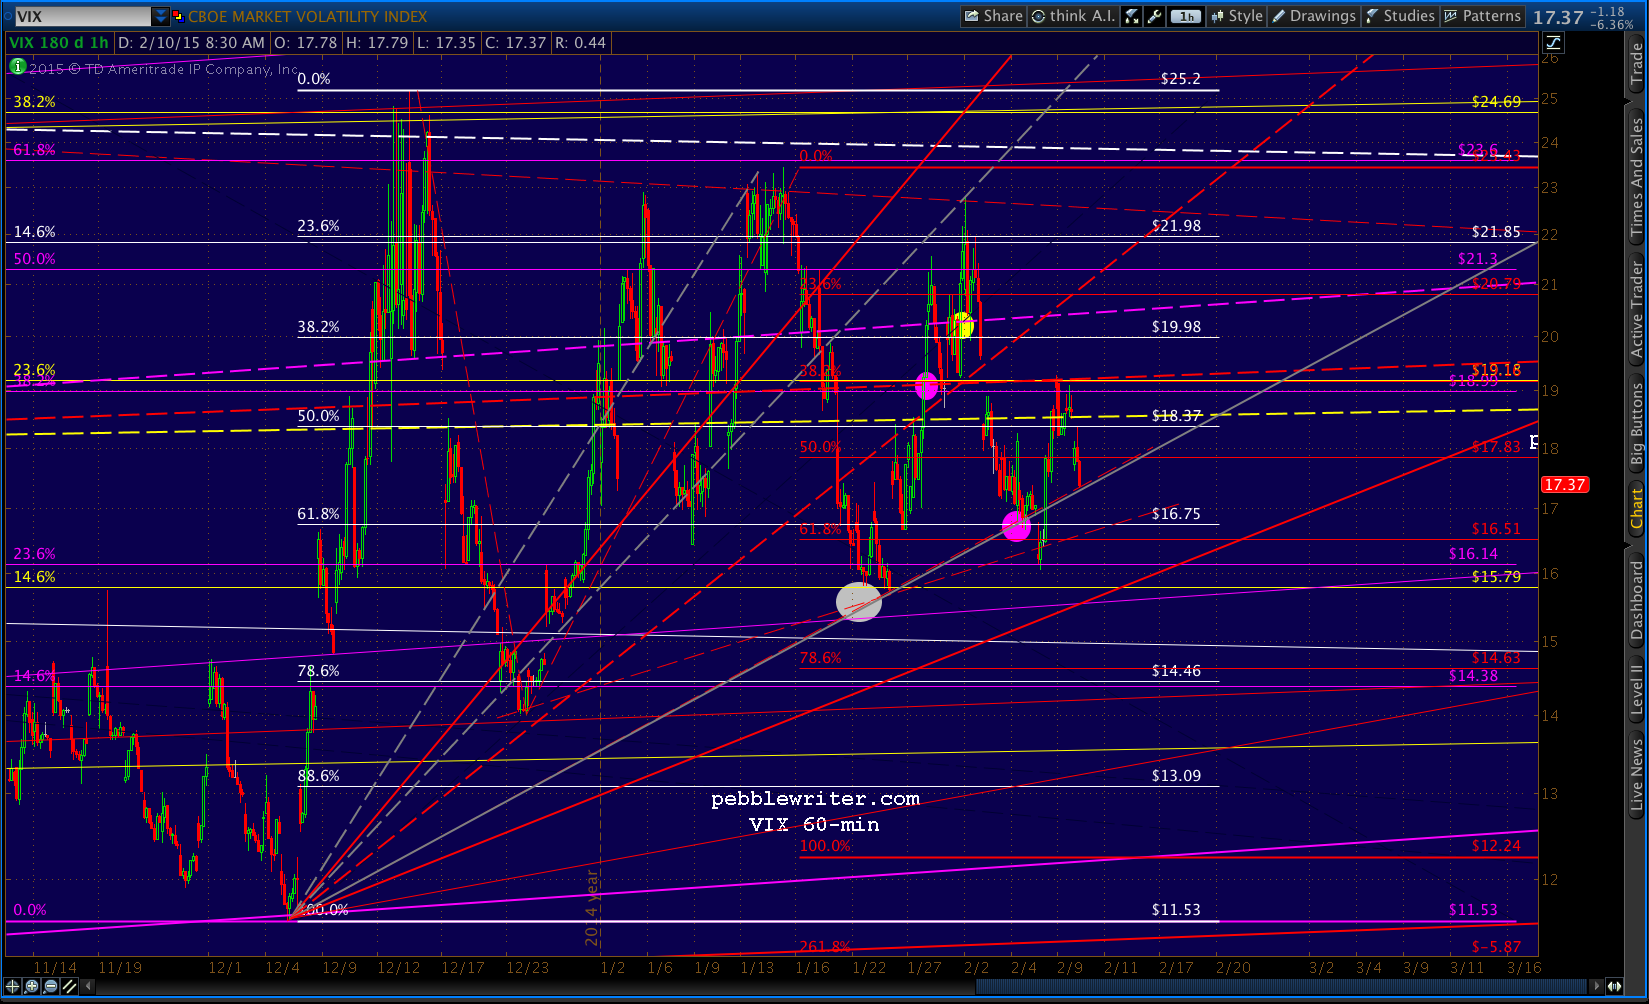 I like the idea of a reversal at the .786 because it sets up a Butterfly Pattern at the purple 1.272 — which is also the larger scale purple .886 (the drop from 2093 to 1980.) Charts coming up…
UPDATE: 2:52 PM
SPX is just about at the purple .786, so I’d take a crack at shorting it here at 2065.72…
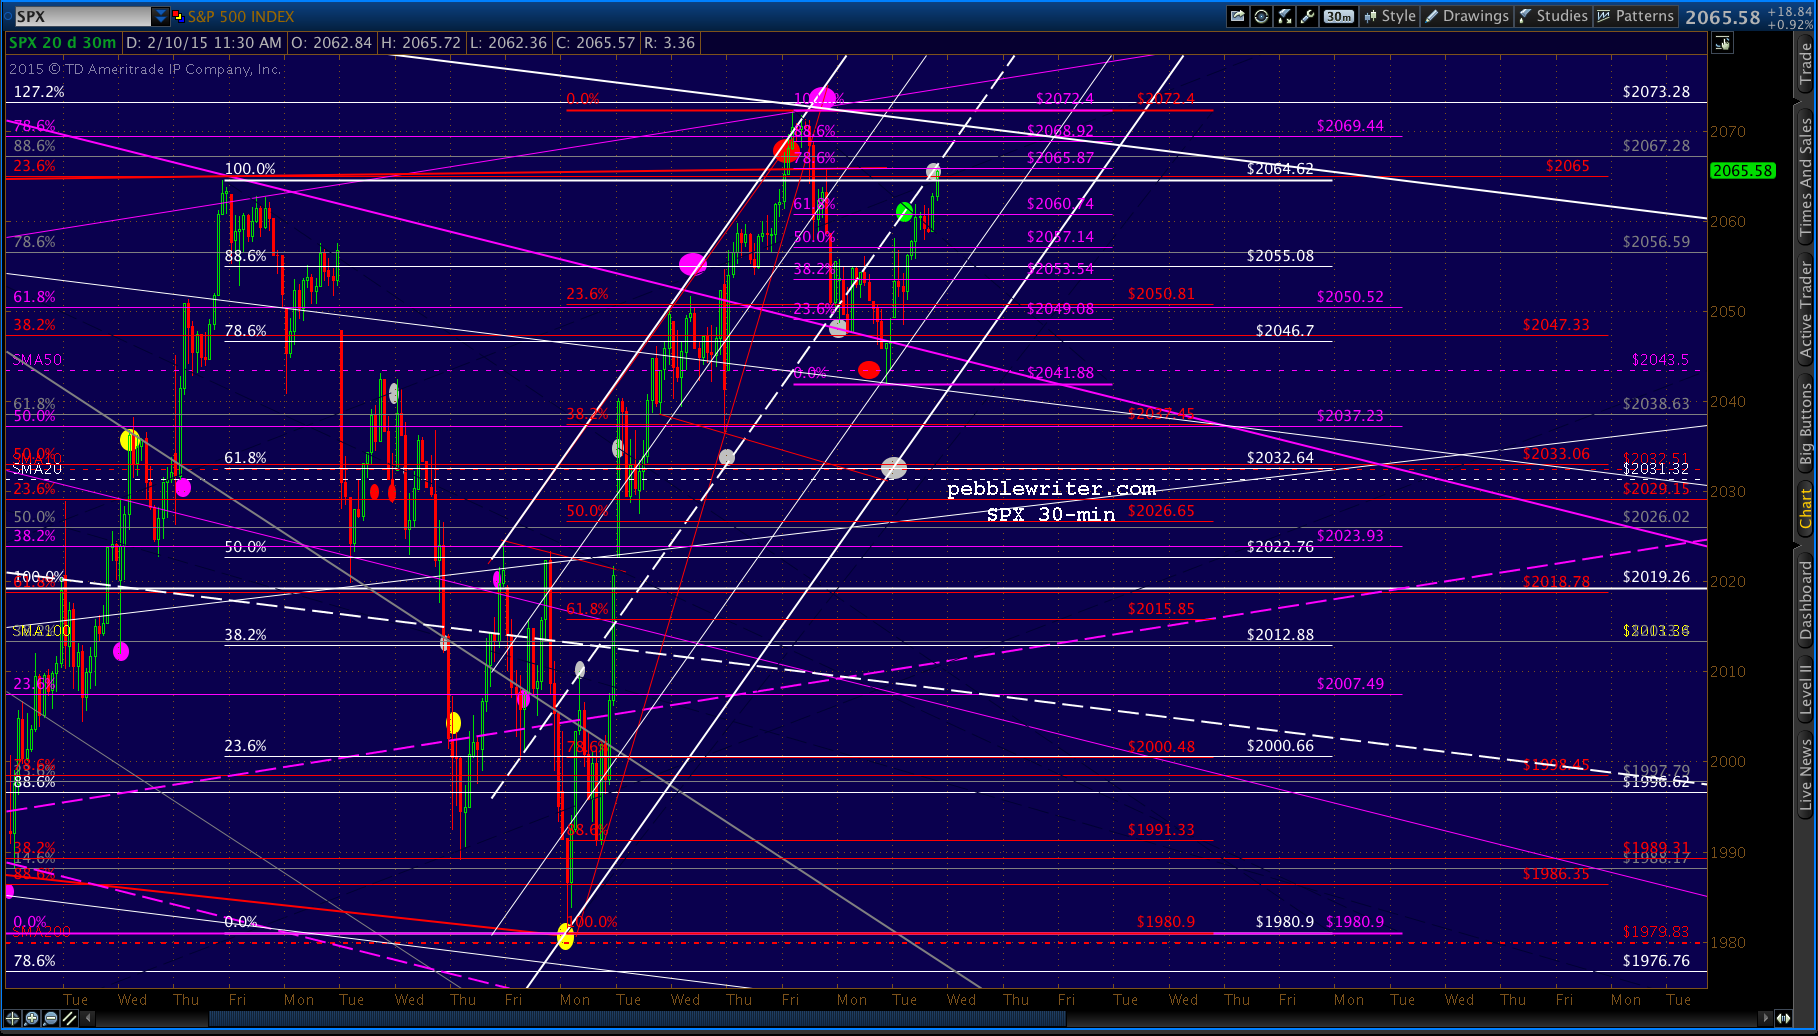 …only because the purple 1.272 meshes nicely with the purple .886 at 2080.71. If I’m wrong, we should see the .886 at 2068.92 instead.
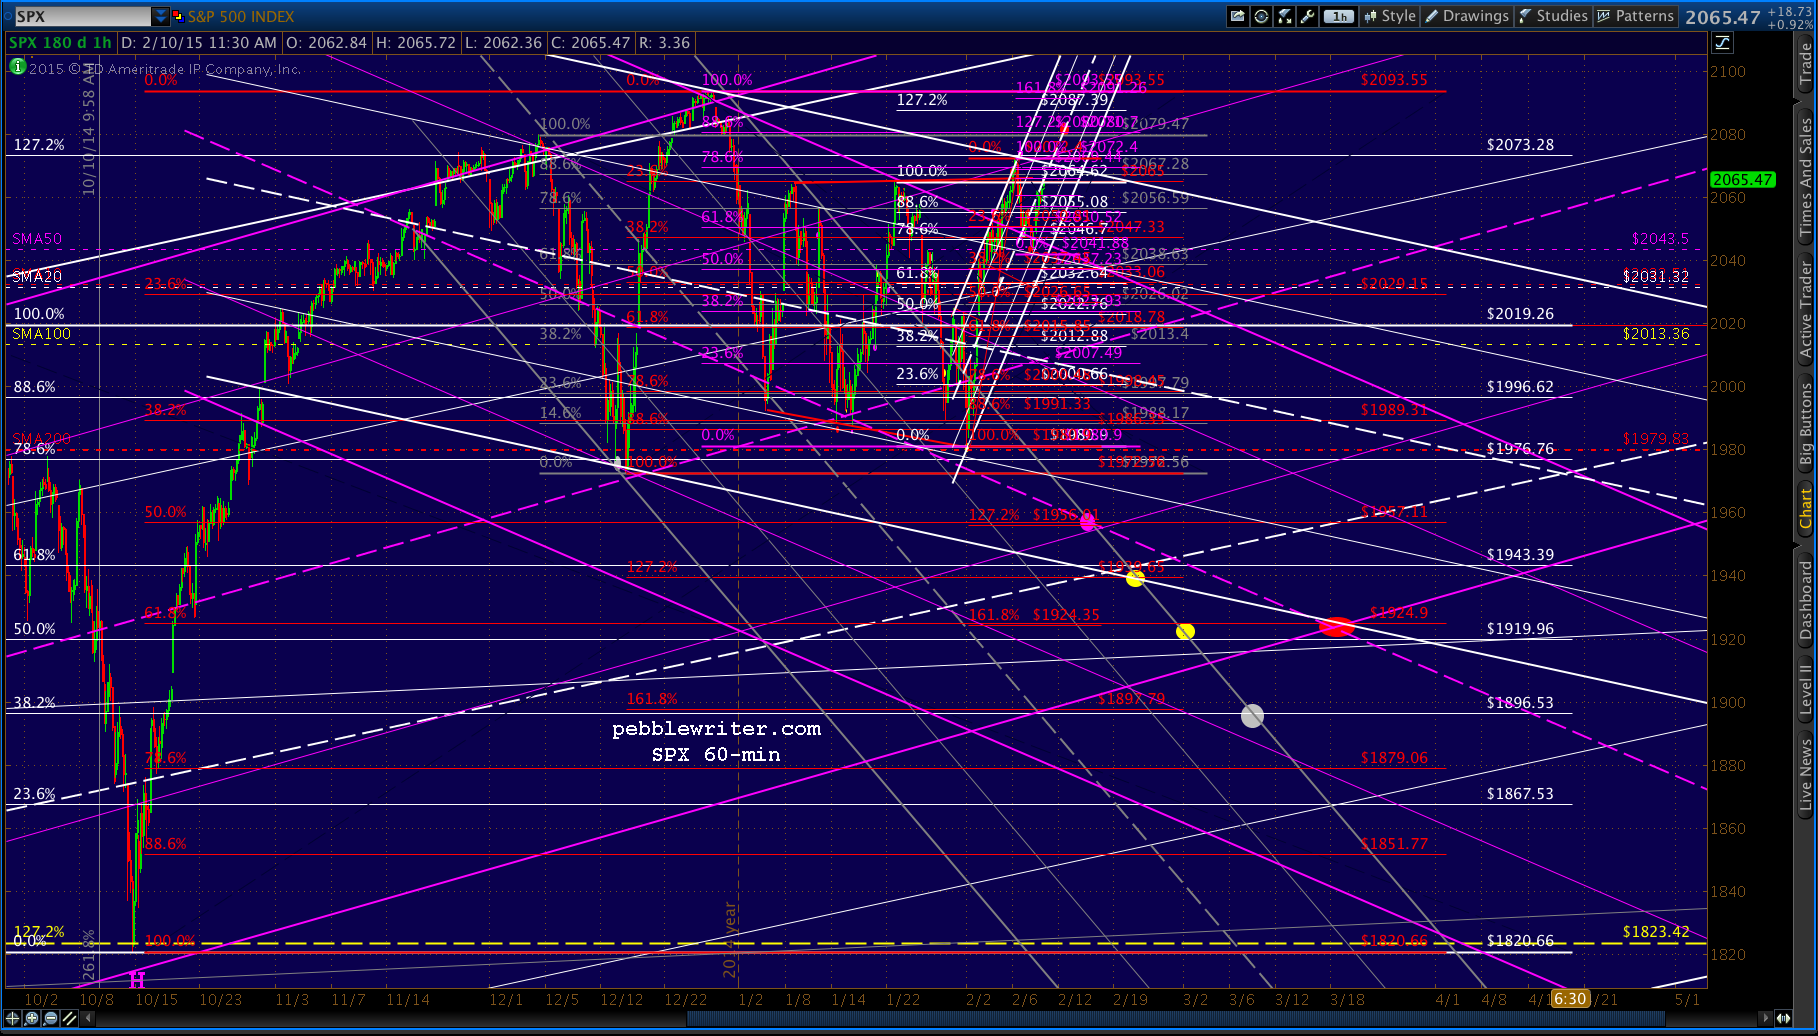
The bigger picture shows the failure and backtest of the falling gray channel. I suppose we could place another potential falling channel (in white below), but it seems a bit forced.