Year: 2015

  • Charts I’m Watching: Mar 11, 2015

    SPX hit our purple target yesterday, bounced to the first level of resistance at the SMA50, and continued toward the red target.  The purple target was first suggested on Mar 4:

    If the H&S should play out, it would target around 2060 — which is coincidentally (or not!) the SMA50 and might allow a backtest of the broken falling gray channel.

    We added the red target on Mar 6 [see: Is Good News Good?]

    2015-03-06 SPX 60 1040The white dot (2062-2066) would suffice, but an actual tag would be down around the purple dot at 2057.   If that should fail, then the red dot at the white .618/SMA100 intersection (2033ish) makes a great deal of sense.

    BTW, the white channel below is new, having been placed there to illustrate the proportion of the latest decline relative to the previous.  It’s a lame placement, but one that bulls might just latch on to (we know, never end a sentence with a preposition; but, doesn’t “a placement onto which bulls might just latch” sound silly?)

    2015-03-11-SPX 60 0621The futures are up about 5 points overnight due to the usual USDJPY antics.  Here, too, I’ve inserted a new channel.  The white one we’ve been using offered a well-defined top and midline and a messy bottom.

    The purple one we’ve inserted is a bad fit, but one that the bulls will pray is legitimate.  The way the BOJ sees it, any chart pattern is fine as long as it targets the moon.

    2015-03-11-USDJPY 60 0621Since so much is riding on USDJPY, EURUSD and CL at the moment, this post is continued at: Those Wacky Central Bankers.  There, we’ll try to make some sense of the plunge in oil prices, the euro and the yen in light of central bank objectives.

  • Charts I’m Watching: Mar 10, 2015

    Last Friday, we updated SPX’s price targets to reflect the completion of the H&S Pattern we had originally forecast back on March 4.

    If the H&S should play out, it would target around 2060 — which is coincidentally (or not!) the SMA50 and might allow a backtest of the broken falling gray channel.

    Ultimately, I think we’ll see backtest of the falling gray channel as we suggested last Wednesday.

    With the e-minis off as much as 20 points earlier this morning, the stage is indeed set for our target — the SMA50 — to be tested.

    2015-03-10-ES 60 0600As we discussed in yesterday’s members’ section:

    …at this point I’d have to go with more downside before the big bounce gets started in earnest.  The SMA50 at 2062 would be a good starting point, though the gray channel backtest at 2055-2057 is more appealing.

    From there, the “market’s” next moves might surprise a lot of traders.

    continued for members(more…)

  • Charts I’m Watching: Mar 9, 2015

    Last week’s charting worked out well, with the H&S Pattern and price targets we forecast Wednesday Mar 4

    2015-03-04-SPX 60 0652…playing out nicely by Friday.

    2015-03-09-SPX 60 0600USDJPY reached our 121.12 target a few days ahead of schedule — which, unless the previous high is at least tested, will leave it with little levitating power.

    2015-03-09-USDJPY 60 0601And, CL is showing few signs of being ready to reverse just yet.

    2015-03-09-CL 60 0630Aside from the ECB’s QE finally starting, and a couple of Fed president’s speaking today, I don’t see a lot that could change Friday’s intermediate-term forecast.

    continued for members(more…)

  • Is Good News Good?

    Futures responded to this morning’s jobs numbers by promptly selling off…

    2015-03-05-ES 60 0615Look for ES to complete the little H&S Pattern targeting 2052.  Whether it’ll be allowed to play out is another matter altogether.  USDJPY ramping is in full swing…

    2015-03-06 USDJPY 60 0615
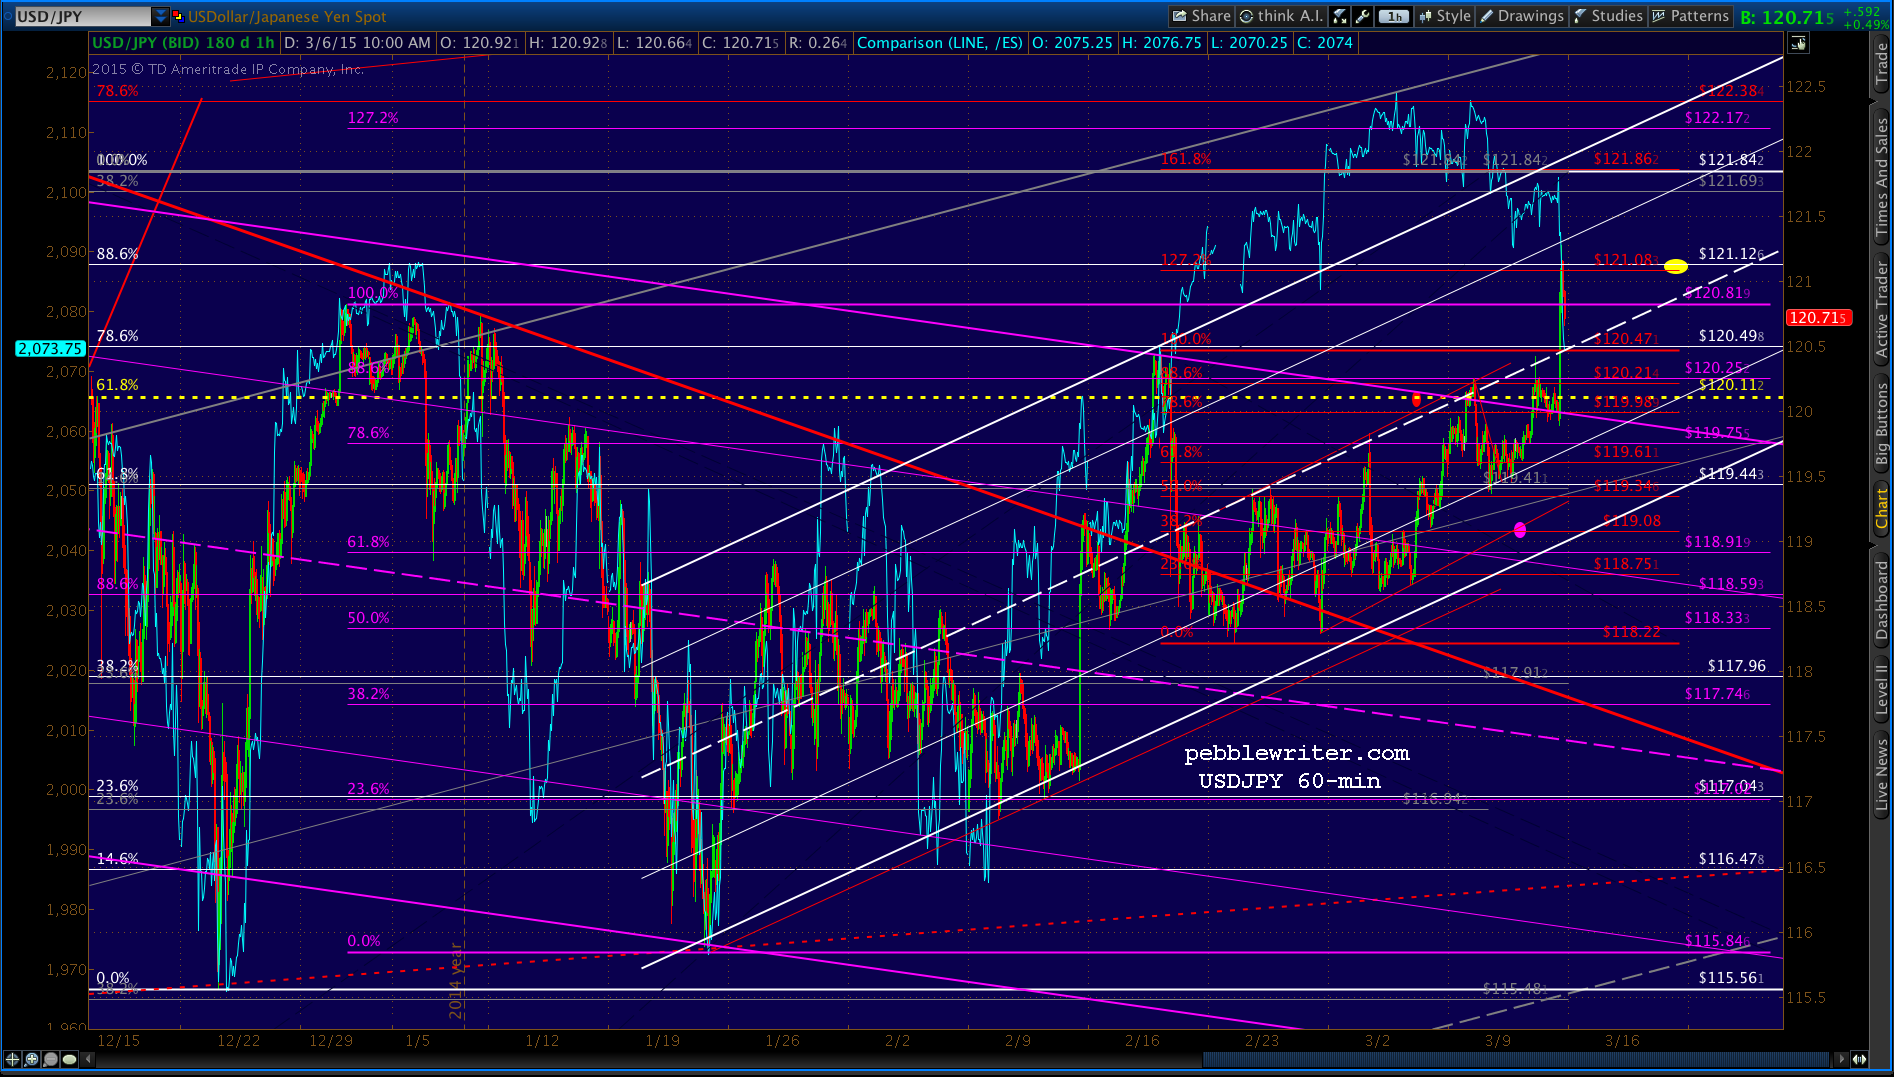
…with the pair approaching our upside target of 121.12 — the .886 retrace of the drop from the December highs.2015-03-06 USDJPY daily 0640But, CL is falling off the wagon once again — seemingly on its way to tag 47.66.

    2015-03-06 CL 60 0640Needless to say, the jobs picture is problematic for the FOMC.  Having balked at reducing market support when unemployment fell below 6.5% and then 6.0%, can they rationalize ZIRP at 5.5%?

    Whether or not we think they should, they no doubt will.  Simply put, the US cannot afford higher rates.  With $18 trillion in debt, a mere 1% increase in rates translates to an extra $180 billion in annual interest payments.  That would increase interest payments as a share of annual government expenditures from the current 6% to 11%.

    If rates increased to a normalized 6%, annual interest payments would soar to nearly $1 trillion — about 26% of the nation’s budget.  It would exceed every category of spending, including military, social security and health care.

    Screen Shot 2015-03-06 at 7.42.43 AMThat’s if we were miraculously able to hold the line at only $18 trillion in debt.  And, it completely ignores the impact of off-balance sheet financing which most estimates put at another $50 trillion or so.

    UPDATE:  1:00 PM

    Heck of a day for our charts.  This one that we posted on Wednesday2015-03-04-SPX 60 0652…turned out to be fairly predictive!

    2015-03-06 SPX 60 1004New targets coming up.

    continued for members

    I’ve adjusted the purple channel to include the low just reached of 2072.93.  Note that it is just slightly higher than the (presumed) wave 1 high of 2072.40, which would keep everything looking bullish for the wavers out there.

    This being Friday (and the “markets” being totally manipulated) that doesn’t mean we’ll stay north of 2072.40 prior to any bounce.  In fact, my leading case is a slight wave 1/wave 4 violation before a bounce up to backtest the SMA20 — currently at 2094ish.

    2015-03-06 SPX 60 1040
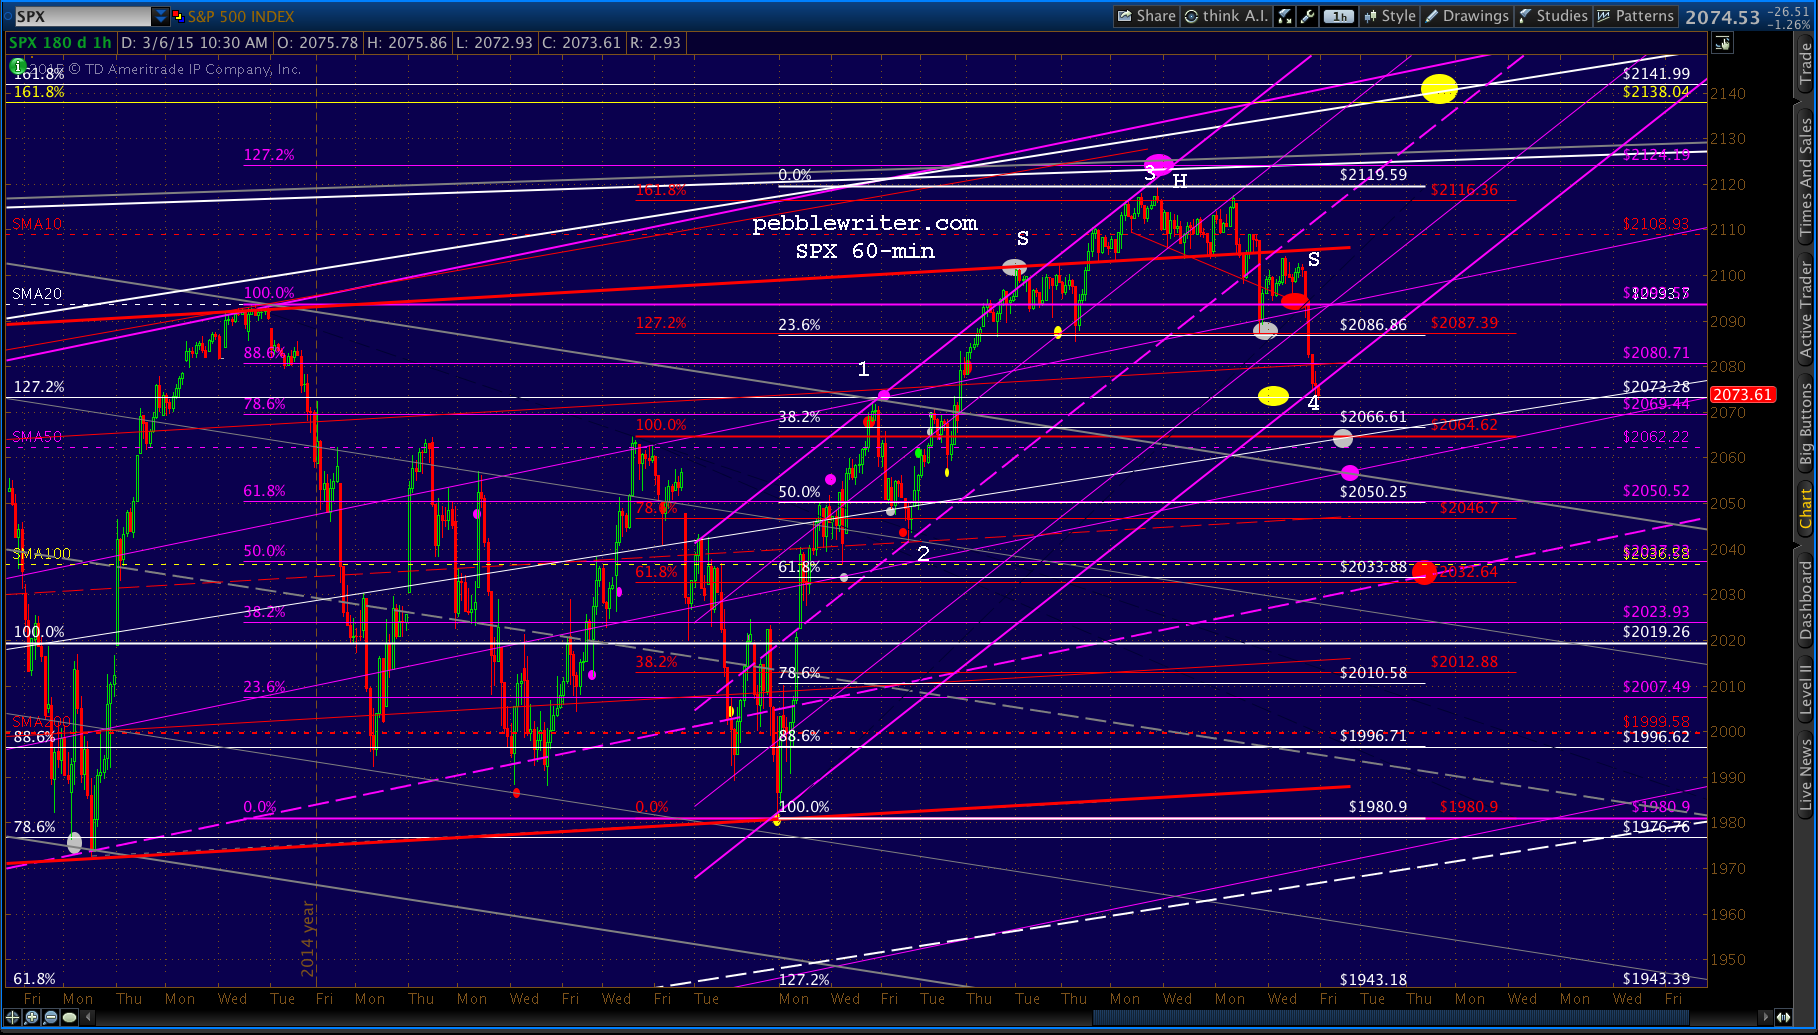
It could be by just a few pennies — enough to stop out weak longs before a nice bounce.  But, ultimately, I think we’ll see backtest of the falling gray channel as we suggested Wednesday:

    If the H&S should play out, it would target around 2060 — which is coincidentally (or not!) the SMA50 and might allow a backtest of the broken falling gray channel.

    The white dot (2062-2066) would suffice, but an actual tag would be down around the purple dot at 2057.   If that should fail, then the red dot at the white .618/SMA100 intersection (2033ish) makes a great deal of sense.

    Odds are it would entail two separate waves that could even stretch into Monday, but CL still has a ways to go to our 47.66 target (which better sets up 45.86 BTW)……2015-03-06 USDJPY 60 1108

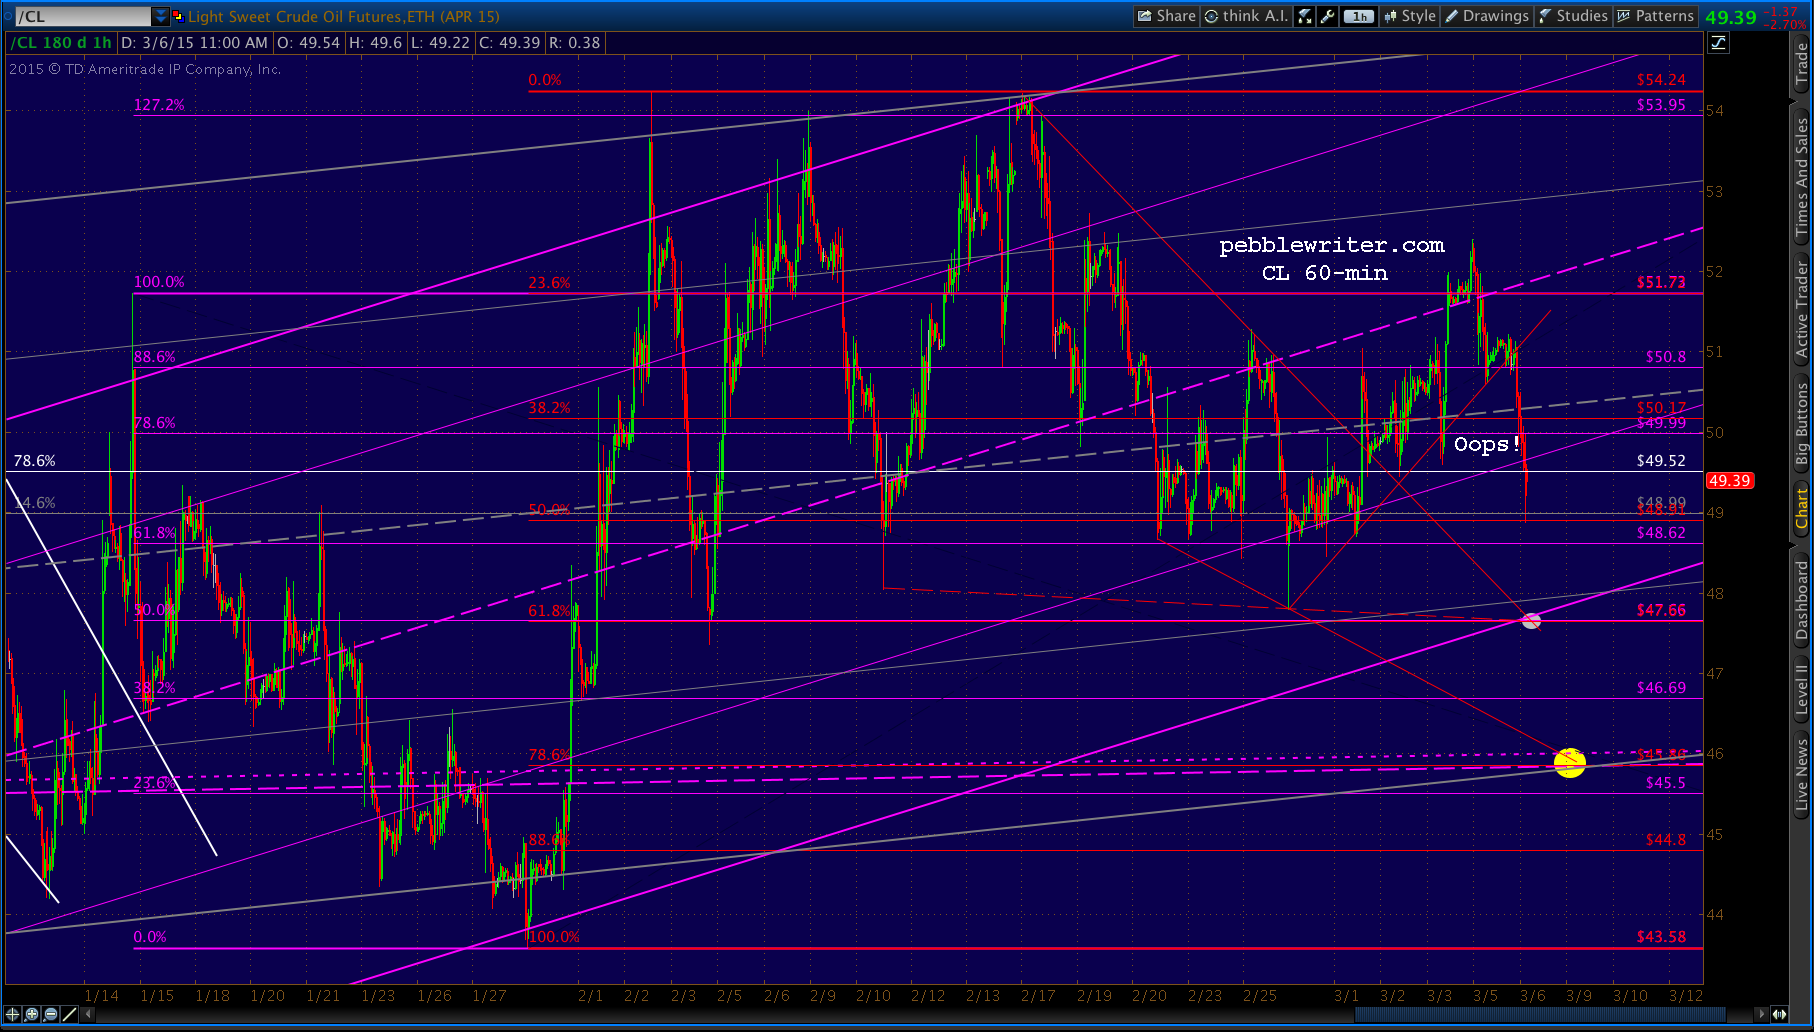
    …and USDJPY has to get back down below 120.11 before turning into a pumpkin.

    2015-03-06 USDJPY 60 1058So, we’ll look for a bounce up to 2093, followed by a drop to 2057 before the dust settles.

    If, on the other hand, the bulls pull a rabbit out of their hats and turn this thing around (in the past, 50:50′ these days, more like 70/30) then the purple channel clearly could take us up to 2138 as early as next Monday or Tuesday.

    But, as we discussed last week, I expect TPTB will attempt a strong move through that critical Fib level in order to keep the party going.  And, I’m not sure that this is the right time/place.


  • Spoofing for Oil

    A lot of people get that wrong.  They talk about drilling for oil.  But, what’s the point, when you can just spoof for it instead?

    [If you’ve missed our previous discussions of spoofing, the WSJ recently put out a nice article and video discussing it in some detail.]

    Crude light stumbled badly yesterday morning after the news came out that oil inventories had risen at the fastest rate since 2001.  It dropped below $50, breaking a little trend line that it’s been climbing since the 27th.

    2015-03-04-CL 60 0848Stocks were none too happy with this development.  SPX promptly fell about 23 points to tag our target from Monday — the 20-day moving average.

    If the past is any indication, SPX isn’t quite ready to make its next major move….l’m looking for SPX to move lower before moving higher, with the likely target being a test of the SMA20.

    2015-03-04-SPX 60 0725Since oil’s drop had caused stocks to also drop, it stands to reason that a recovery in oil would also trigger a recovery in stocks.  At least that’s the way algorithms work.

    Sure, there is some economic logic baked in there somewhere: rising oil prices eventually contribute to higher profits in the oil complex.  But, generating higher profits takes more than a few minutes. And, stocks were getting beat up pretty badly.

    Enter the oil-fueled algorithm and its vehicle: the spoof.  As Nanex’s Eric Hunsader points out, oil is being kept afloat by orders that are placed by those with no intention of being filled.

    Like ES, USDJPY, and other financial instruments/assets, it’s an effective way to temporarily boost prices.  Done cumulatively, it’s an effective way to keep prices on an upward track — even in the face of horrid fundamental supply/demand news.20150304_crude3_0CL, having led stocks lower, suddenly spiked 5% on the very worst day of fundamental supply/demand news in 14 years.  2015-03-05-CL 60 0600Stocks — or rather the algos that drive stock prices — were only too happy to respond.

    2015-03-05-SPX 60 0630Oil now yields the floor to USDJPY, which spiked above the .618 at 120.11 this morning in order to save stocks’ bacon today.

    2015-03-05-USDJPY 60 0600EPILOG: 4:30 PM

    To believe any of the above, you’d have to accept that TPTB are taking concrete steps to manipulate oil, currencies and securities prices.  It would mean price action that, on its face, is designed to prop up SPX.

    Earlier, we talked about the importance of 120.11 for USDJPY (the yellow, dashed trend line.)  Don’t look now, but USDJPY not only slipped just past it, but closed slightly above it.

    2015-03-05-USDJPY 60 1300And, CL, which needed to maintain the rising red trend line from a week ago…  Guess what?  It could hold, but my money is on the fundamentals mattering this time.  In other words, I’d revert to short here for our 41.14-42.41 target range.

    2015-03-05-CL 60 1300

  • Charts I’m Watching: Mar 4, 2015

    SPX acted pretty much according to plan yesterday — getting most of the way to our 2093.55 target before CL and USDJPY panicked and bounced higher into the cash close.  From yesterday’s members’ section:

    My hunch is that we’ll see SPX decline to our 2093.55 target — particularly if USDJPY declines to flesh out the rising white channel (118.75ish, depending on when) or lower.

    It’s a continuation of the theme posted on Monday:

     If the past is any indication, SPX isn’t quite ready to make its next major move….l’m looking for SPX to move lower before moving higher, with the likely target being a test of the SMA20.

    2015-03-04-SPX 60 0615CL has continued higher, but ran into the channel midline that might hinder further upside.

    2015-03-04-CL 60 0615While USDJPY — after backtesting the broken red TL — has continued lower.

    2015-03-04-USDJPY 60 0615Assuming we get some follow-through this morning, what next?

    If 2093.55 fails, then the SMA20 at 2088.3 is the next level of support.  That would leave an interesting potential H&S Pattern in place, with the dashed white line representing the SMA20 as the neckline.

    updated chart in a few

    UPDATE: 9:37 AM

    2015-03-04-SPX 60 0637I think the target will be wherever SPX happens to be when USDJPY reverses and heads higher.  Currently, 119.08 looks like the most obvious target.  It’s on the thin red TL up from 118.33 and would intersect with the purple .618 Fib.

    Note that a full .886 retrace of the rally from last Friday would hit the red target at 118.75 we identified yesterday as appealing.  Given that SPX is selling off pretty nicely with a minor downturn overnight, we can only imagine how big an impact that might have.

    UPDATE:  9:54 AM

    SPX has reached 2090.55 so far.  At this point, the neckline is plenty flat enough.  And, it has nailed the larger purple channel’s .786 line and very close to the small purple channel’s .236 line.

    [A drop by CL to 50.17 would help SPX reach our actual target; but, this is probably low enough to get a bounce — at least into the european close.  It’s worth keeping an eye on.]

    2015-03-04-SPX 60 0652If the H&S should play out, it would target around 2060 — which is coincidentally (or not!) the SMA50 and might allow a backtest of the broken falling gray channel.

    continued for members... (more…)

  • Charts I’m Watching: Mar 3, 2015

    As we discussed yesterday, SPX may not be ready to make its next move.  The critical USDJPY Fib of 120.11 was tested and has rebuffed (for now) any further advances.

    2015-03-03-USDJPY daily 0600Likewise, VIX tested the .886 again and (for now) couldn’t penetrate it.

    2015-03-03-VIX daily 0600CL popped through the TL we discussed in the members’ section…

    2015-03-03-CL 60 0615…which, with USDJPY’s temporary move higher than 120.11, was enough to boost stocks higher on the day.

    2015-03-03-SPX daily 0600It’s difficult to overstate the importance of USDJPY’s actions.  Two of the previous rejections resulted in 100+ point declines for SPX.

    The third didn’t, but on that occasion USDJPY merely backtested the broken pennant top, and SPX was further aided by oil’s rebound and some nifty VIX monkey-hammering that broke the rising trend.

    2015-03-03-VIX daily 0735

    continued for members(more…)

  • Charts I’m Watching: Mar 2, 2015

    Friday saw a repeat of the SMA10 test, but this time SPX closed slightly below that support.

    2015-03-02-SPX daily 0600The futures are holding their cards close to the vest this morning, with ES off about 1 point.  USDJPY is going mostly sideways…

    2015-03-02-USDJPY 60 0615…while CL — off 1.5% — continues to hint at a retreat to the .786 or .886.

    2015-03-02-CL 60 0611We’re examined the timing of breaching important resistance many times over the years.  If the past is any indication, SPX isn’t quite ready to make its next major move.

    continued for members(more…)

  • Charts I’m Watching: Feb 27, 2015

    Still on the road today, so today’s post will be brief…

    *  *  *  *  *

    Yesterday’s call for a dip to the SMA10 was fairly accurate.  SPX reached 2103.76, which is about where the SMA10 was after all the dust settled.

    2015-02-27-SPX daily 0838So, now we’ll look for the other shoe to drop.  SPX’s upside targets remain in place, and USDJPY shows no signs of spoiling the party at this time — with the white .886 or the previous high as a likely target to lever stocks higher.

    2015-02-27-USDJPY daily 0830Interestingly, DX is coming up on the .500 retracement of the decline from 121 to 71.  It looks like a pretty good channel intersection as well.  Perhaps a reversal in next week or so?

    2015-02-27-SPX daily MAs 0821GLTA.


  • Charts I’m Watching: Feb 26, 2015

    The e-minis are essentially flat this morning following the first negative inflation (aka deflation) print since the financial crisis.  There’s an obvious retreat level around 2102.50 that would allow the rising red channel to flesh out and a backtest of the larger rising white channel (the upside target is equally obvious at the red 1.272 @ 2120.98.)

    2015-02-25 ES 60 0620Such a decline might enable SPX to tag the 10-day moving average at 2100.08.  Though the daily rising wedge looks intact…

    2015-02-25 SPX daily MAs 0620…the 60-min shows a breakdown late yesterday.

    2015-02-25 SPX 60 0630Rising wedges have been notoriously unreliable since central banks took the wheel.  About the best bears can usually hope for is that they broaden into a rising channel.  Still, SPX was allowed to dip below the lower bound, so we’d be inclined to bite…

    …if only USDJPY weren’t riding to the rescue.

    2015-02-26 USDJPY 60 0630UPDATE:  9:50 AM

    On our usual, detailed chart, it’s fair to say the rising white channel from Feb 2 looks like it’s finally ready to give up the ghost.  The purple one we proposed about a week ago would gain additional credence with a backtest at 2100 — its midline.

    The timing looks like next Monday, Mar 2.  That would necessitate a delay of the 2138 tag — which fits with my leading scenario just fine.  Though, I can easily envision a bigger drop to, say, 2093.55 right here and now.

    The key for bulls is to frame it as a backtest of the horizontal red channel.  If that should fail to hold, a dip to the SMA20 at 2068.24 would permit a backtest of the broken falling gray channel and further flesh out the rising purple channel.

    2015-02-26 SPX 60 0650It looks like that might have to wait, however, unless CL can poke through the bottom of the rising red channel.  I believe it will, but am less clear on the timing.

    2015-02-26 CL 60 0700ES has done its part, having nearly reached this morning’s initial downside target.

    2015-02-26 ES 60 0705Unfortunately, I’ll have to examine it after the fact.  I have a plane to catch and won’t be able to check in until after the close.

    GLTA.