

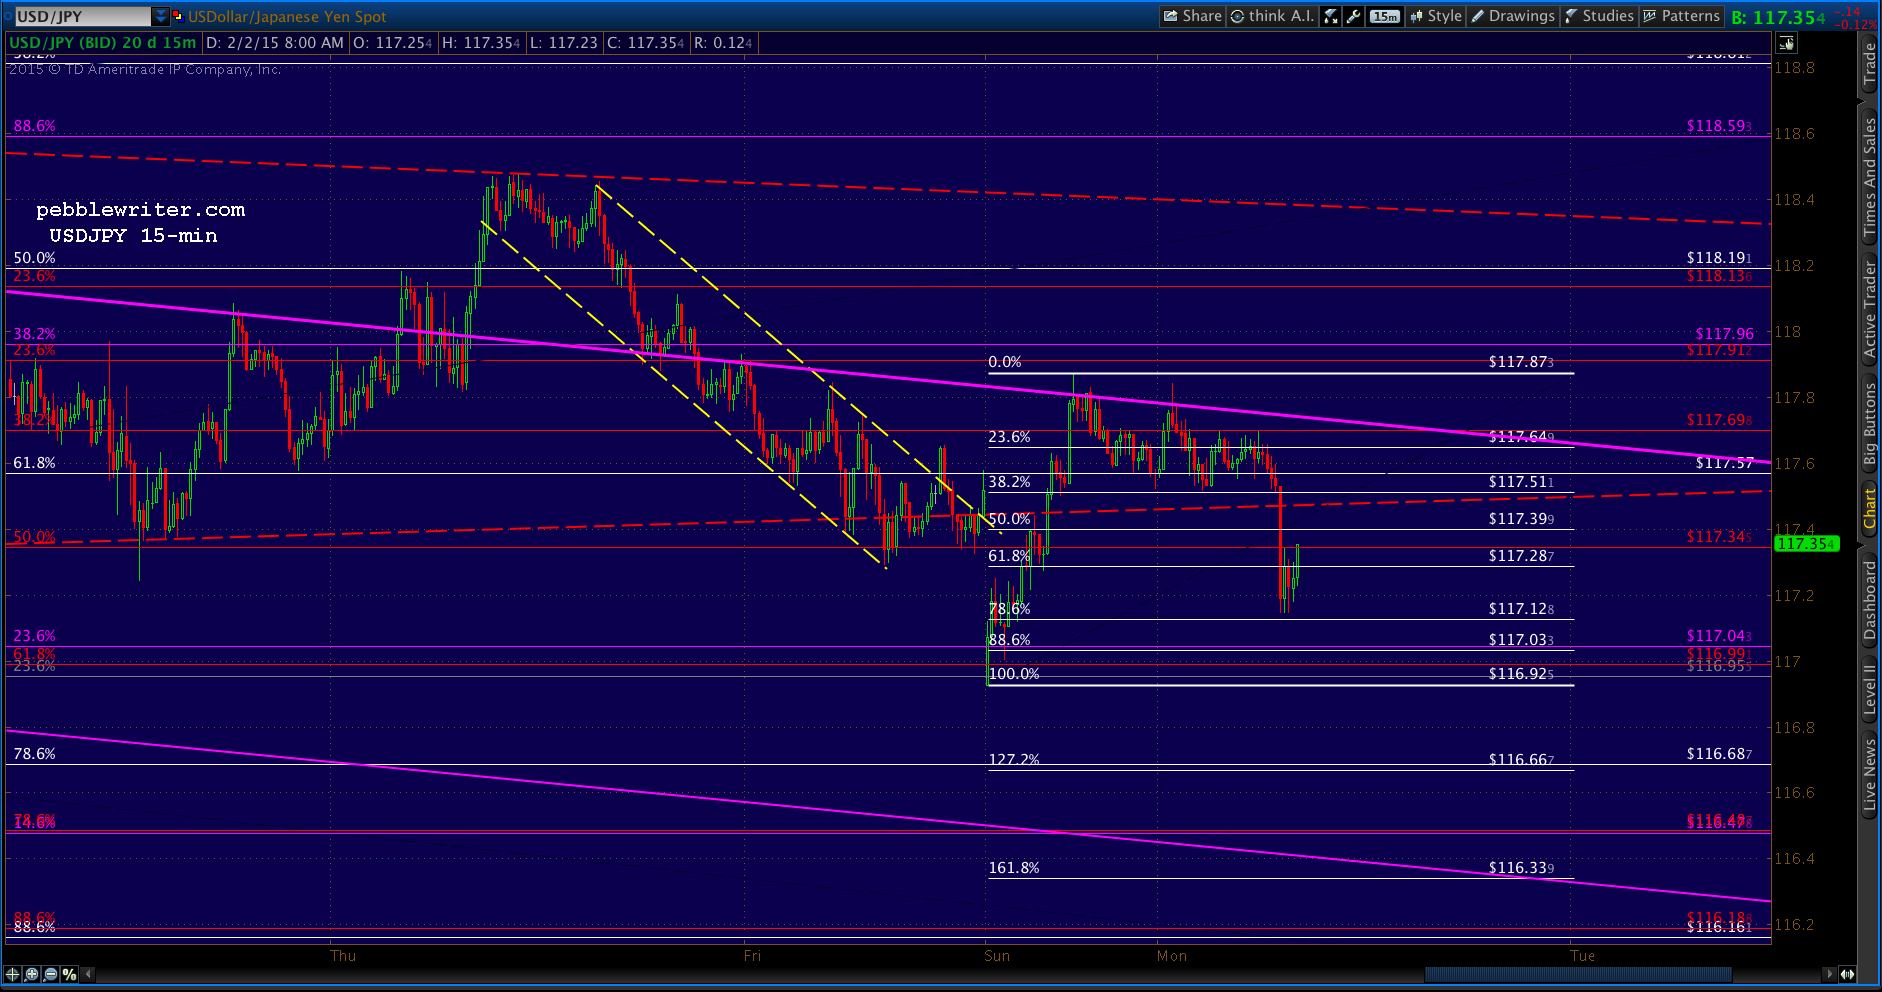
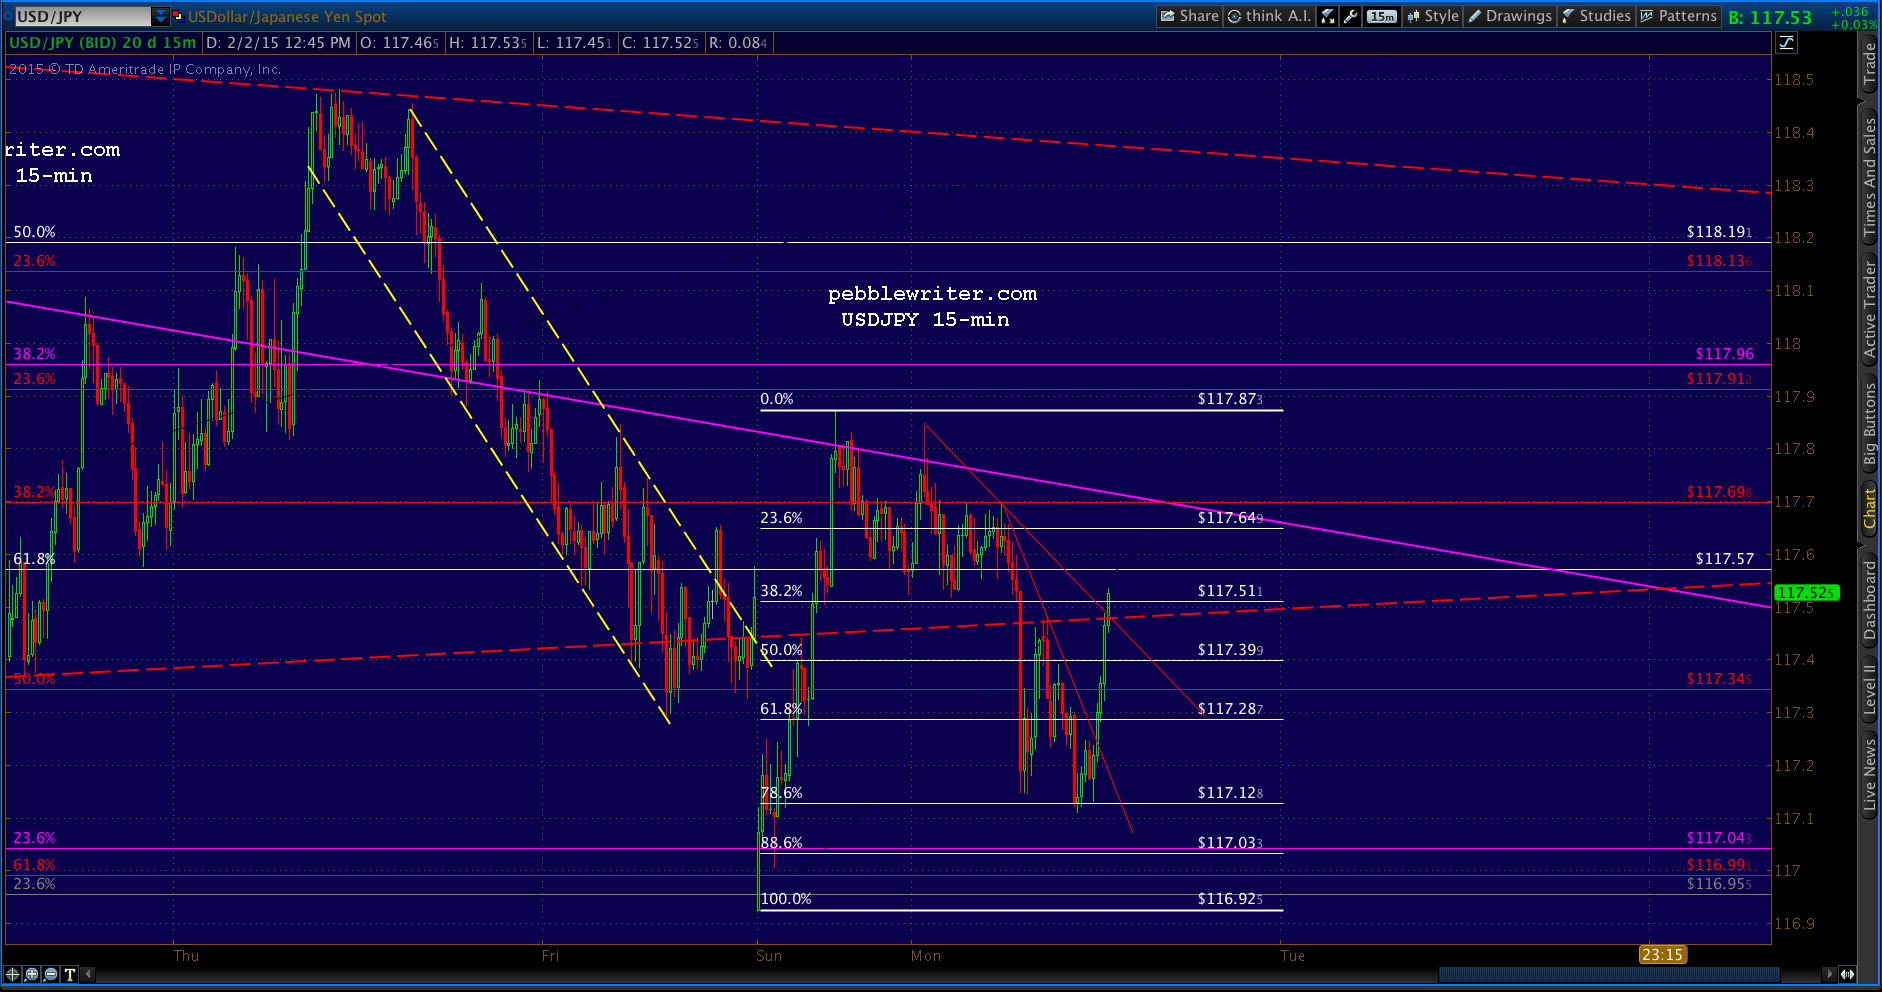
As we’ve been discussing for nearly two weeks, a triangle in USDJPY has been driving the volatile sideways action in SPX. Yesterday, while half the world was absorbed in football, the triangle finally broke down — just long enough to tag a meaningful retracement.
 By the time the game was over, USDJPY was safely back in the triangle, where it currently resides in the narrowing territory between the purple channel top and the triangle bottom.
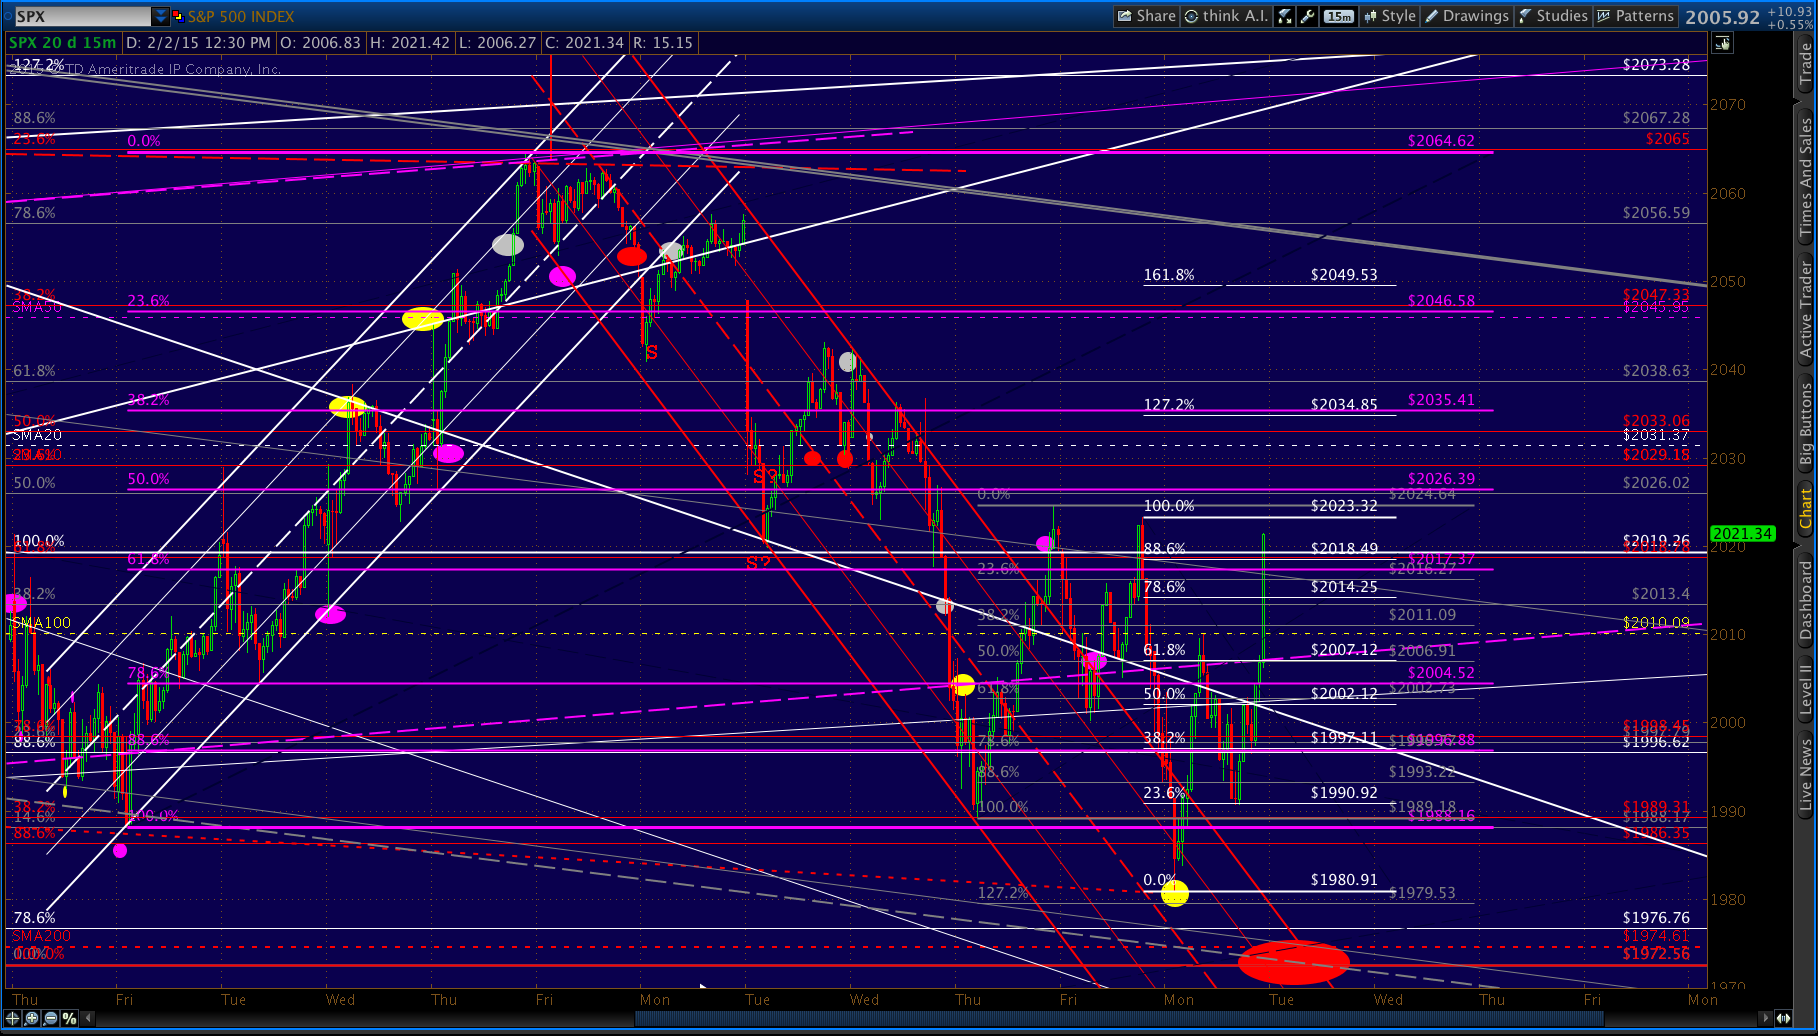
It’s a lot easier to manipulate futures prices over a low-volume weekend, and this one was no exception. Has USDJPY’s plunge taken place right about now, SPX would be testing the SMA200 down at 1974. But, that’s not the way the script reads…
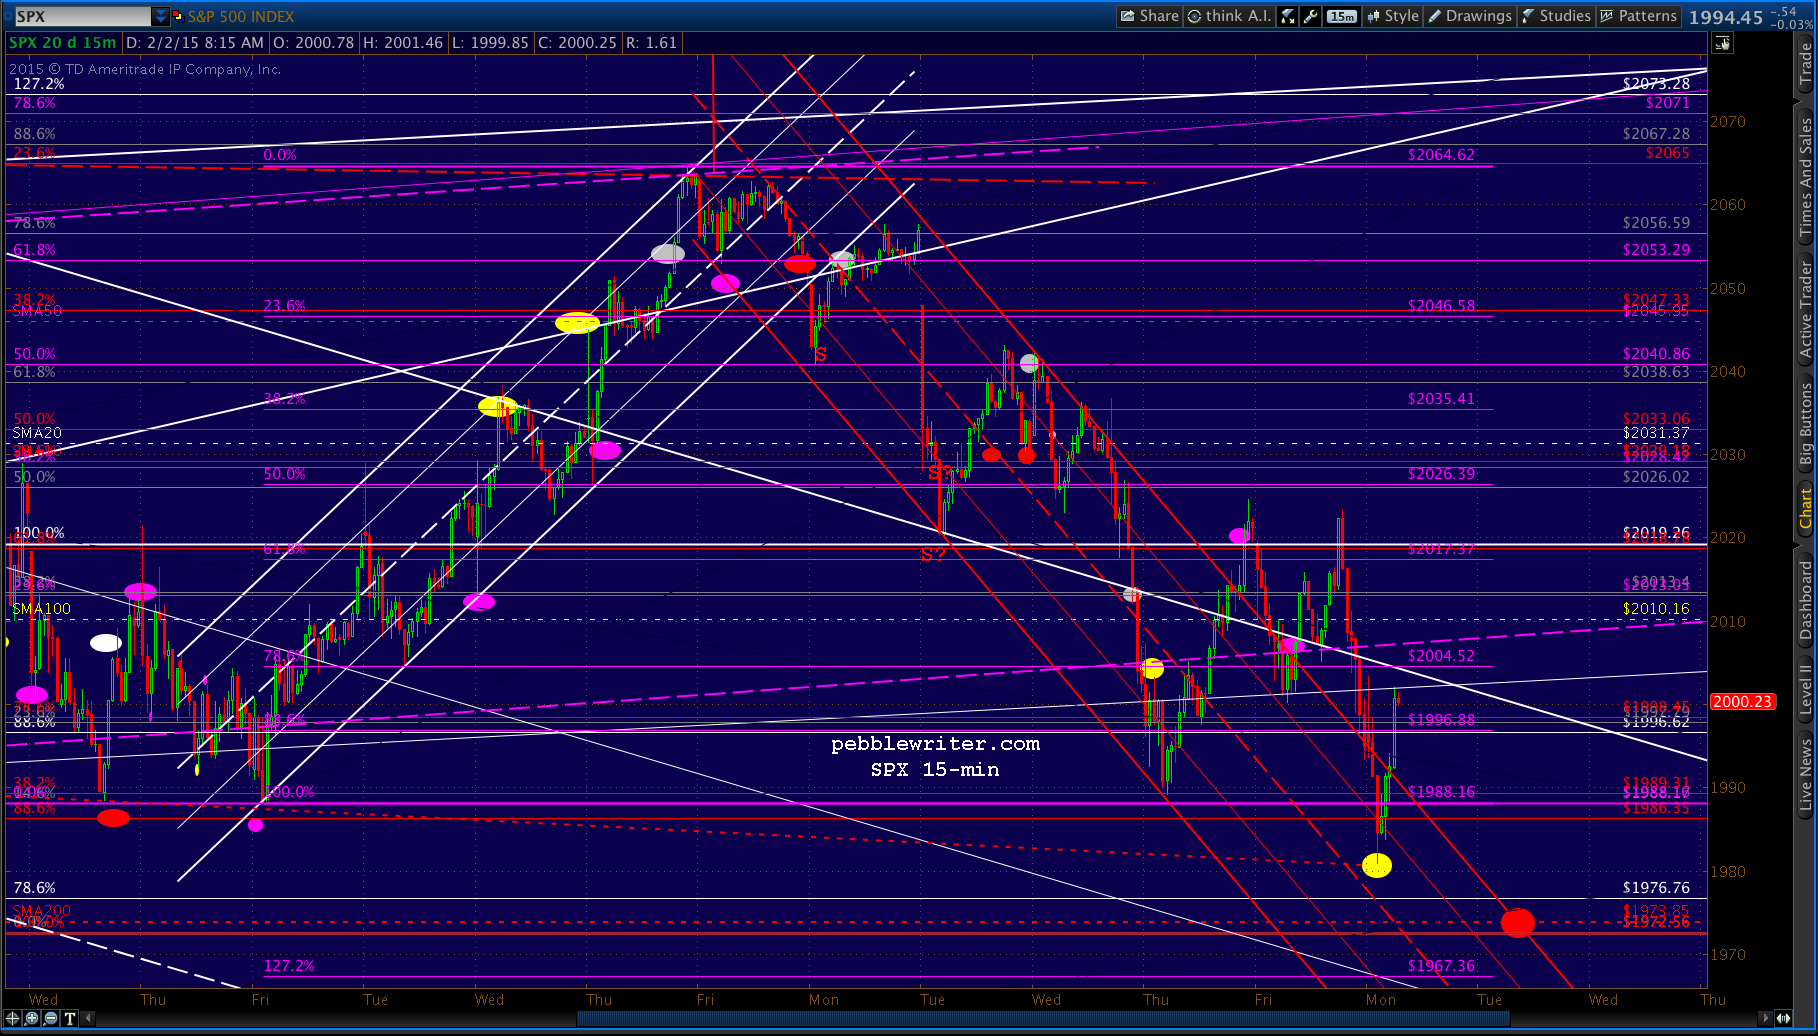
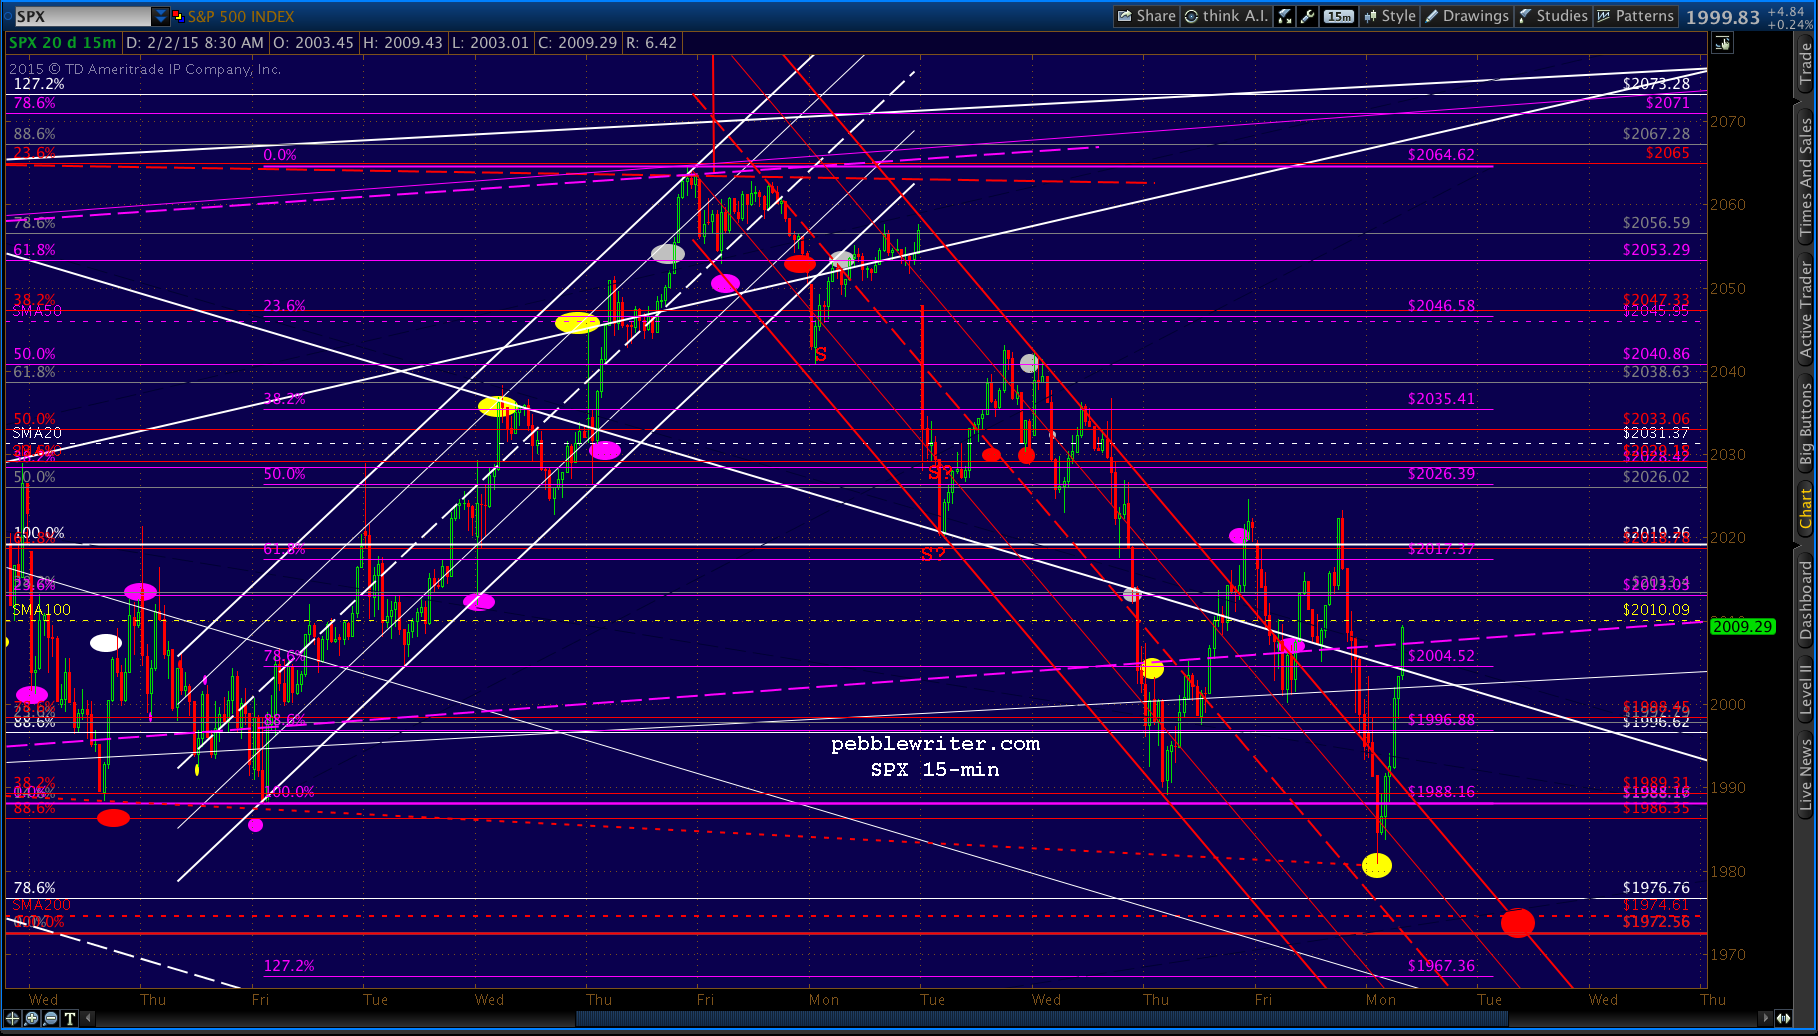
S&P futures fell 9-points with the initial plunge, but have since risen more than 13 off the bottom. They’re currently showing a gain of 7 points – meaning yet another test of the white channel top and/or purple channel midline.
 If the rally can be sustained beyond that, the SMA100 is currently around 2010. But, bulls might wish to keep an eye on the fading rally in oil. CL briefly tested 50 — almost at the .886, and has since hinted at a retracement.

UPDATE: 10:11 AM
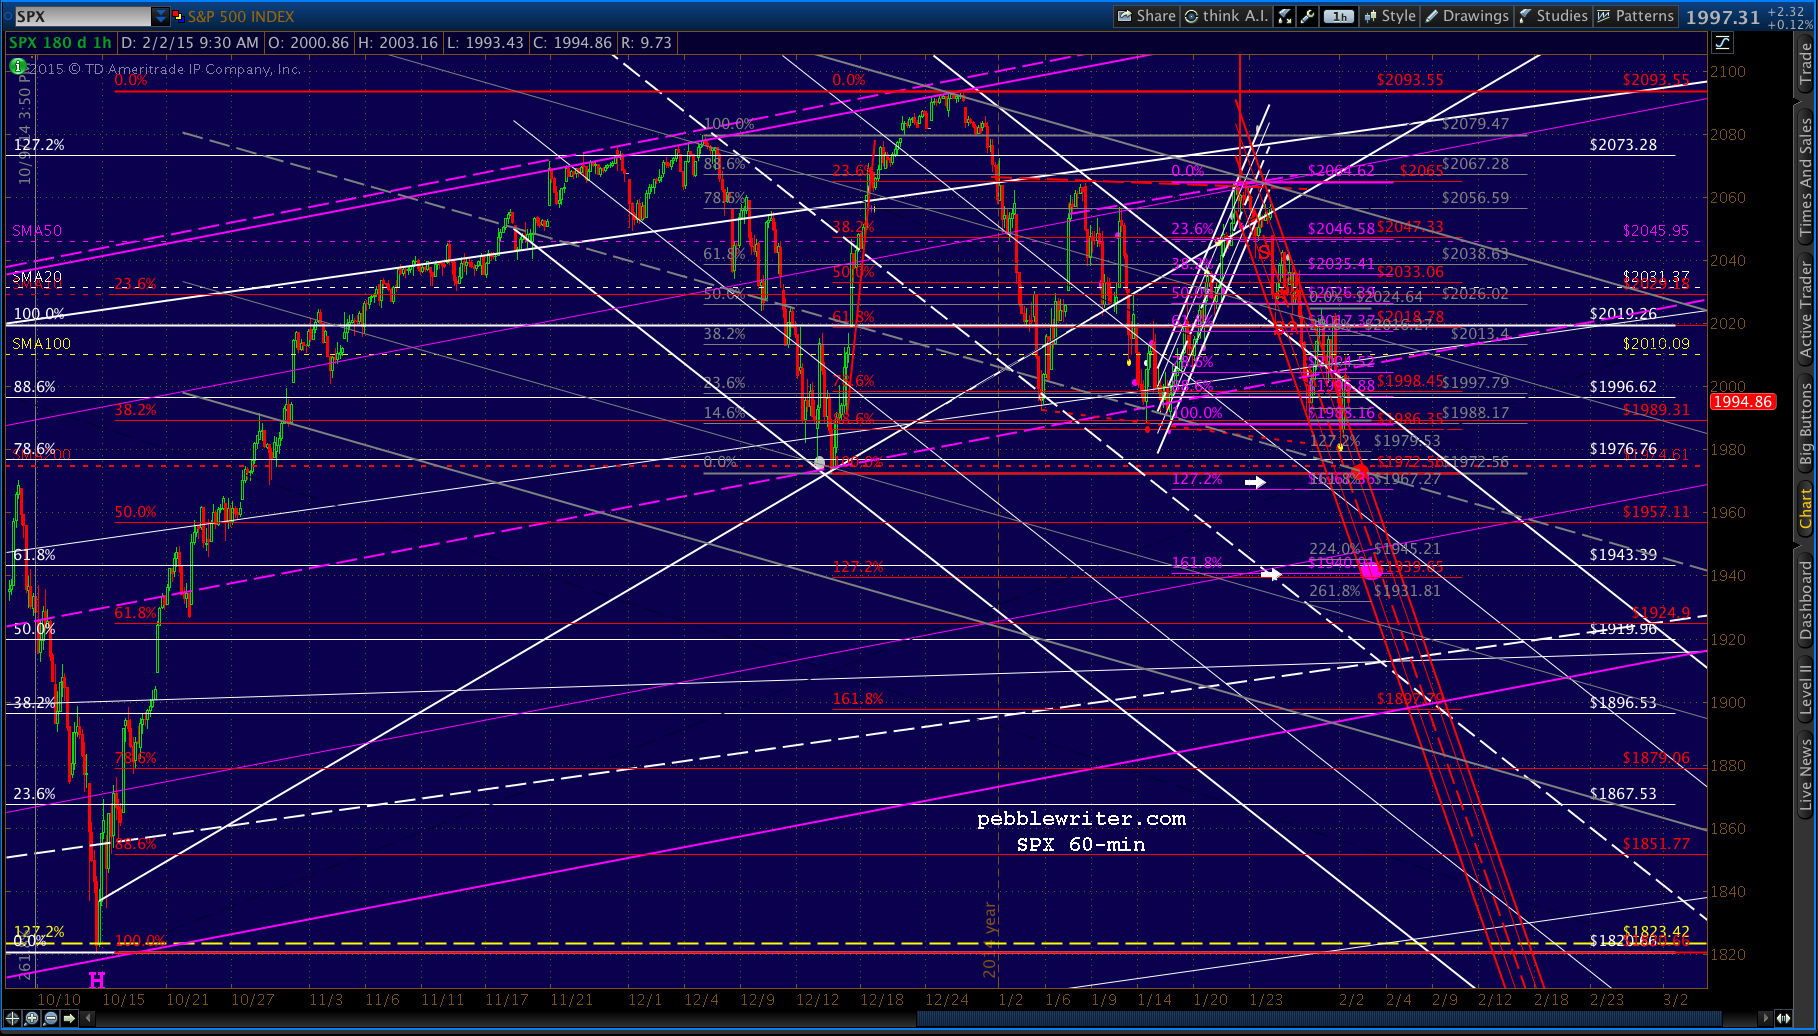
SPX just reached our next downside target at 1980. A reminder, this is a TL that connects the Jan 6, 14 and 16 lows that we detailed in the 3:55 update (members’ section) on Friday afternoon.
 Note that this move below 1988 completes a traditional H&S Pattern that would target 1912 if it were to hold. Needless to say, not many H&S Patterns have held in the past couple of years. They’ve effectively been banned by central bankers and algo-centric HFTs.
More importantly, though, it officially kills off the IH&S that TPTB were trying to sell us. From here, the SMA200 becomes a much more reachable target — though we wouldn’t be surprised to see a decent bounce at this TL.
Next moves coming up. continued for members…We originally drew the SMA200 at a significant delay to the TL tag because it looked better as a backtest to the red channel. But, the red channel lost its precision with Friday’s in-again, out-again action. And, it’s not clear anymore whether TPTB will bother casting it as a backtest.
USDJPY has dropped out of the triangle again, but hasn’t come close to yesterday’s lows. A slightly lower plunge could easily get SPX down to 1974. I suspect we’ll see a backtest of the triangle’s lower bound before that happens, though.
 UPDATE: 11:20 AM
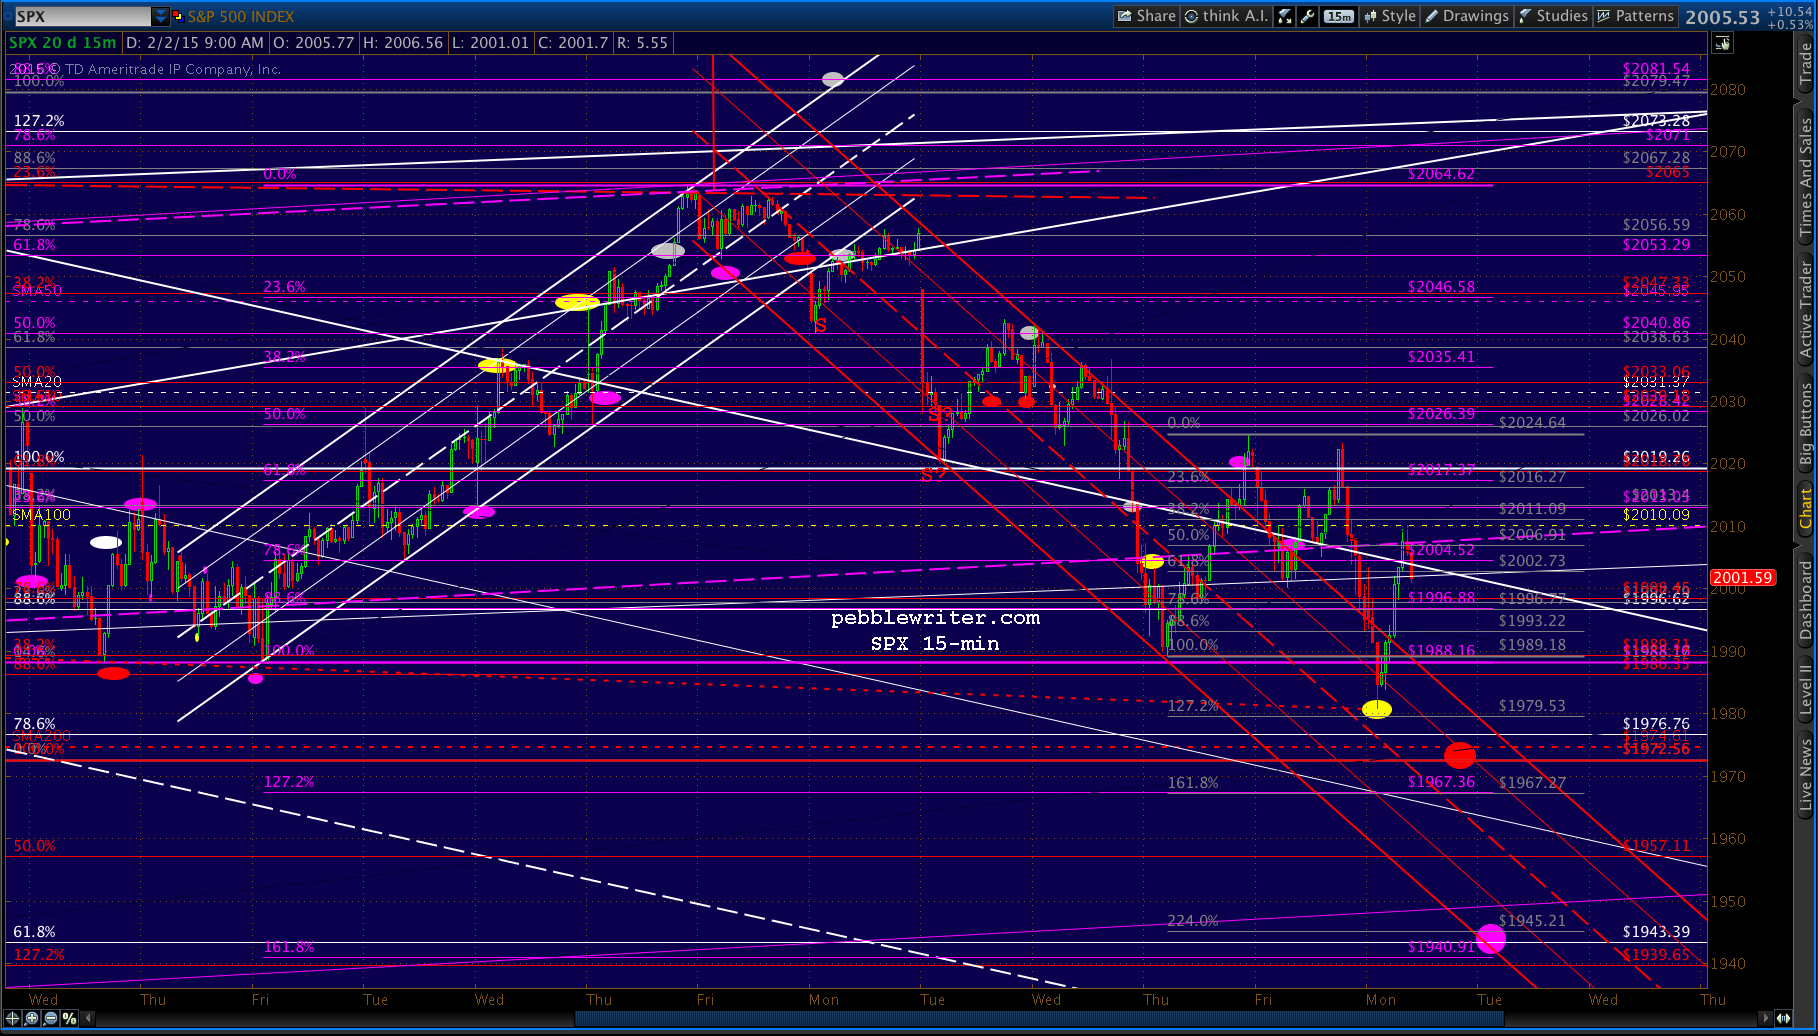
USDJPY could eek out a slightly higher backtest, but is essentially there. 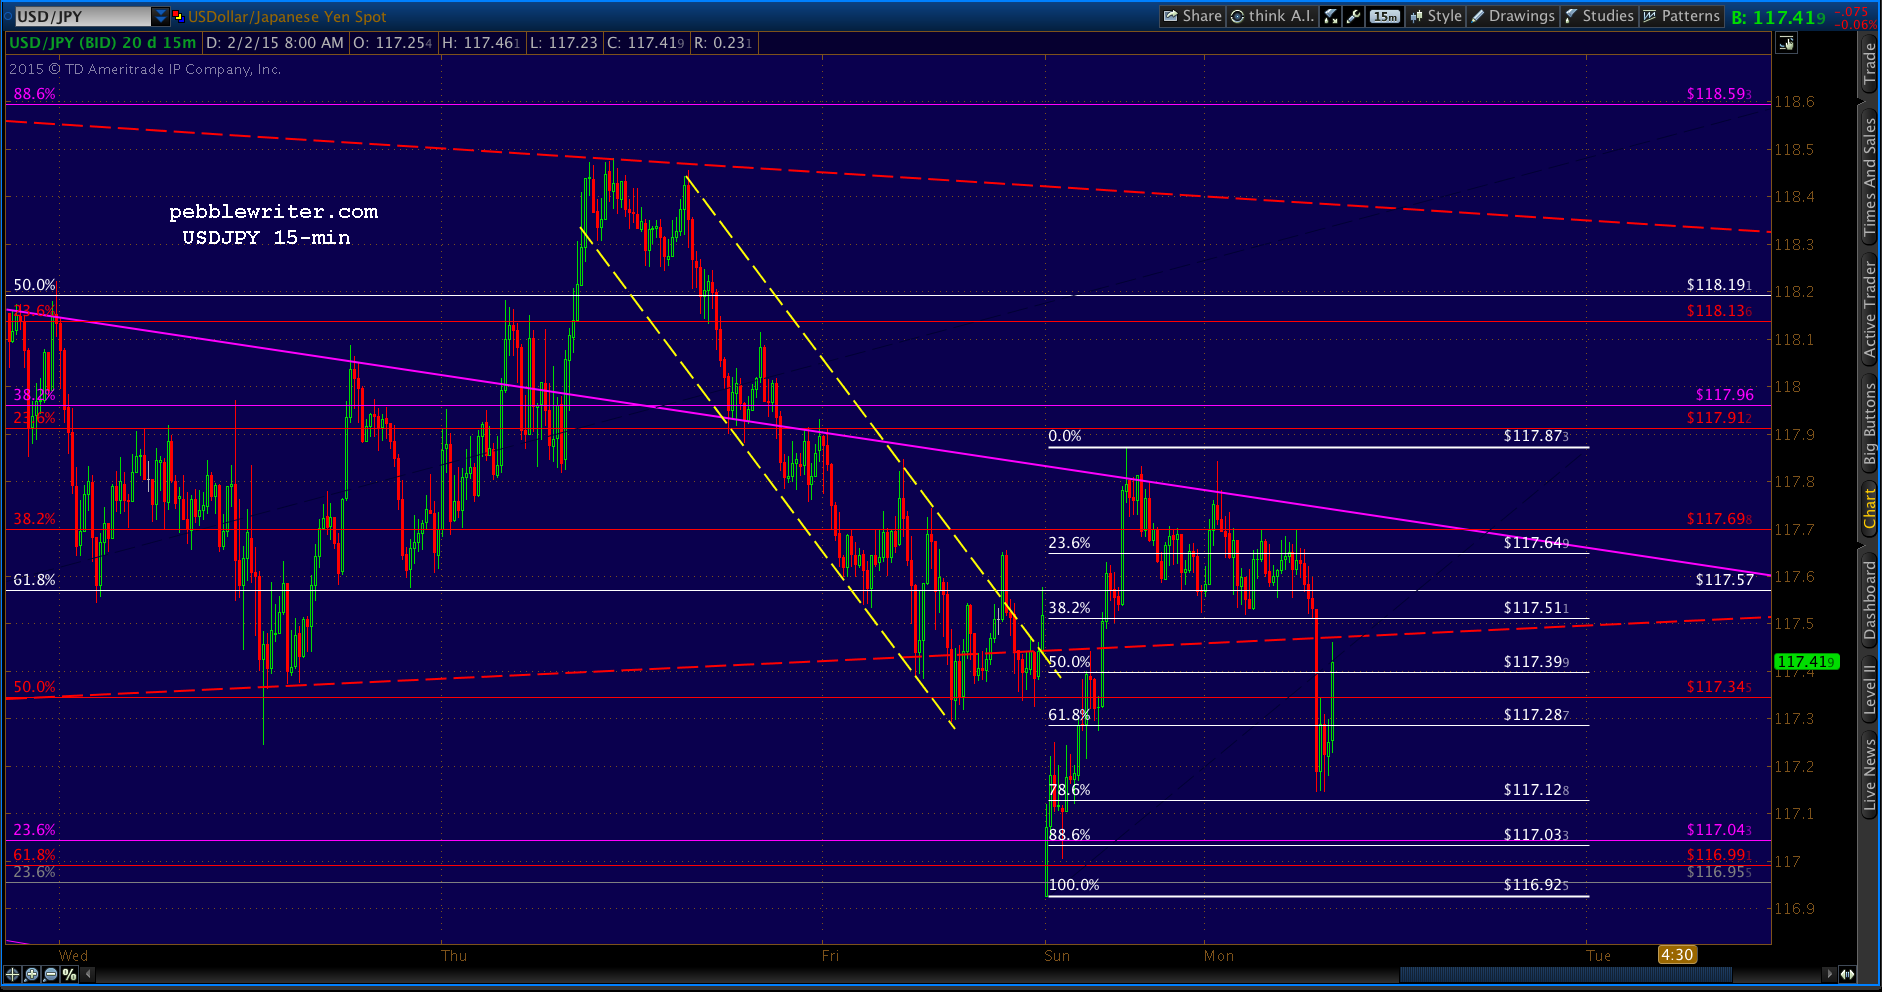 SPX has reached the underside of a rising white channel line — a 22-pt bounce from the yellow dot. This is technically enough, but a tag of the falling white channel or purple midline would be more convincing. From here, I’d say late in this session or early tomorrow morning for the SMA200.
 UPDATE: 11:39 AM
Much better! I’d be very comfortable shorting here with loose stops.
 UPDATE: 12:13 PM
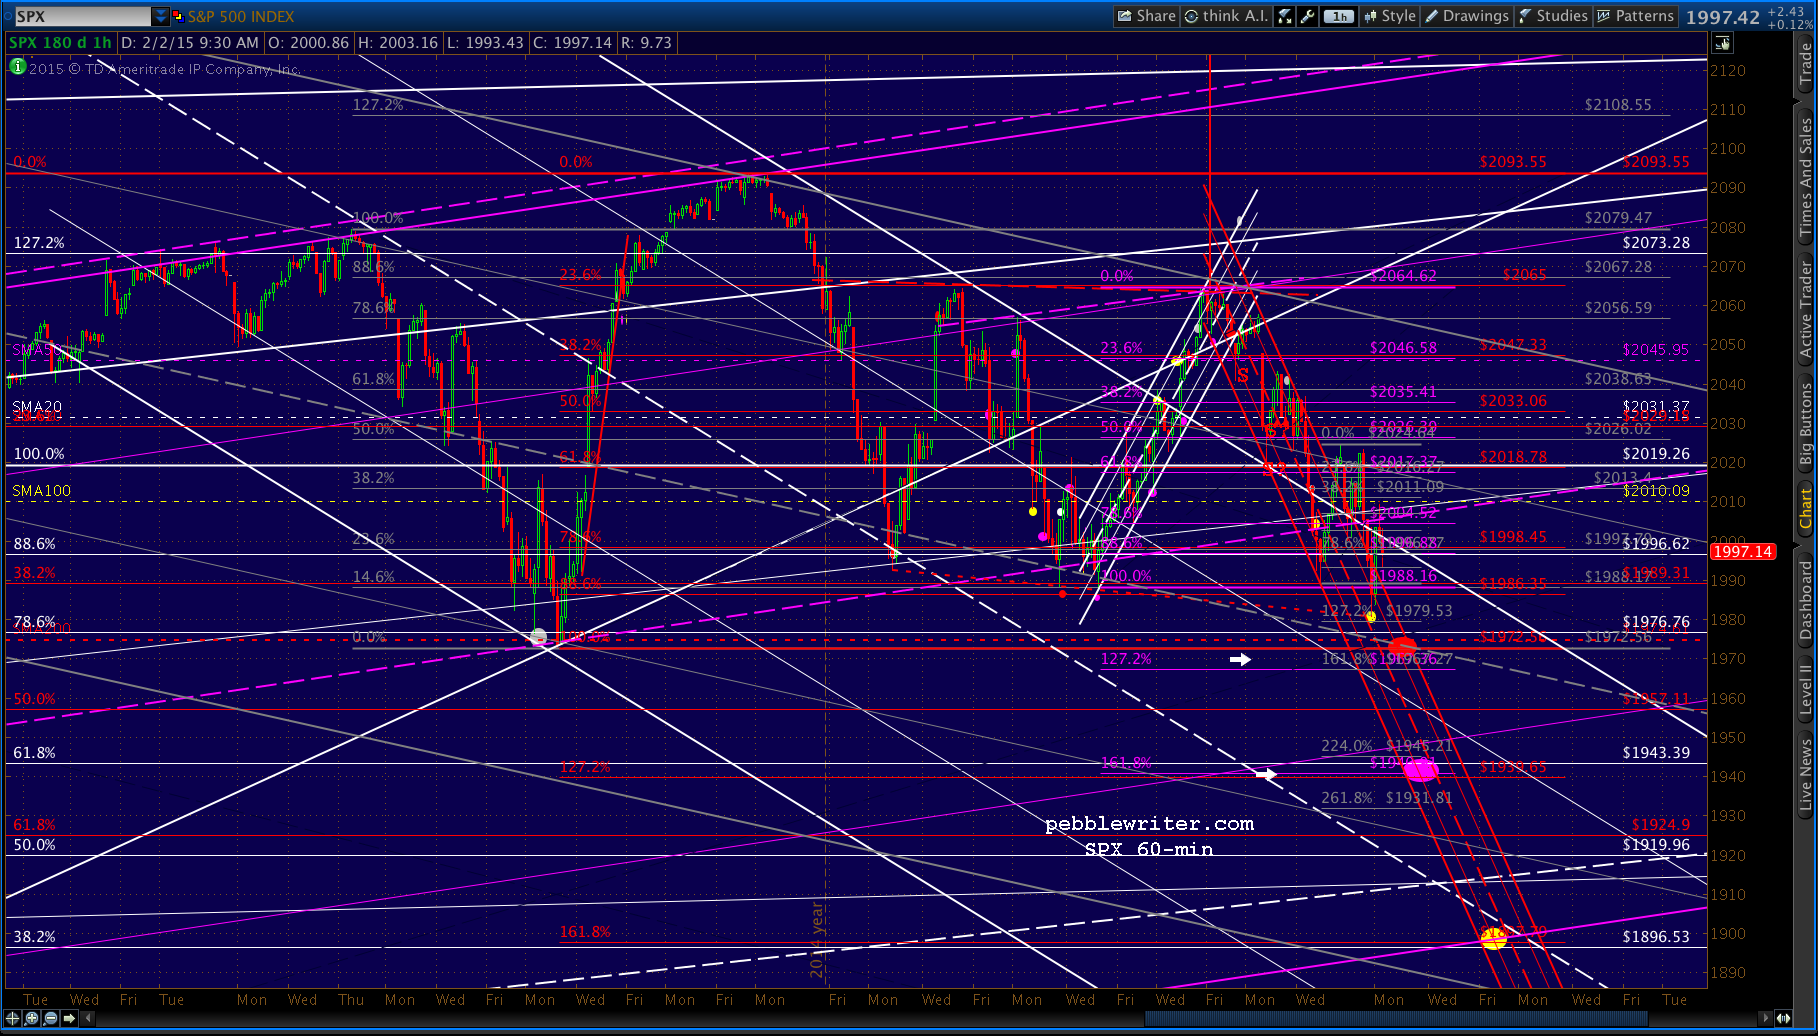
Expanding on the earlier thread… I’ve moved the red dot back within the falling red channel — more on a hunch than anything else. Note that if the SMA200 doesn’t catch the falling knife on the nose (which it rarely does), we have strong Fib support down around 1943 — the gray 2.24, white .618, purple 1.618 and red 1.272.
 UPDATE: 1:09 PM
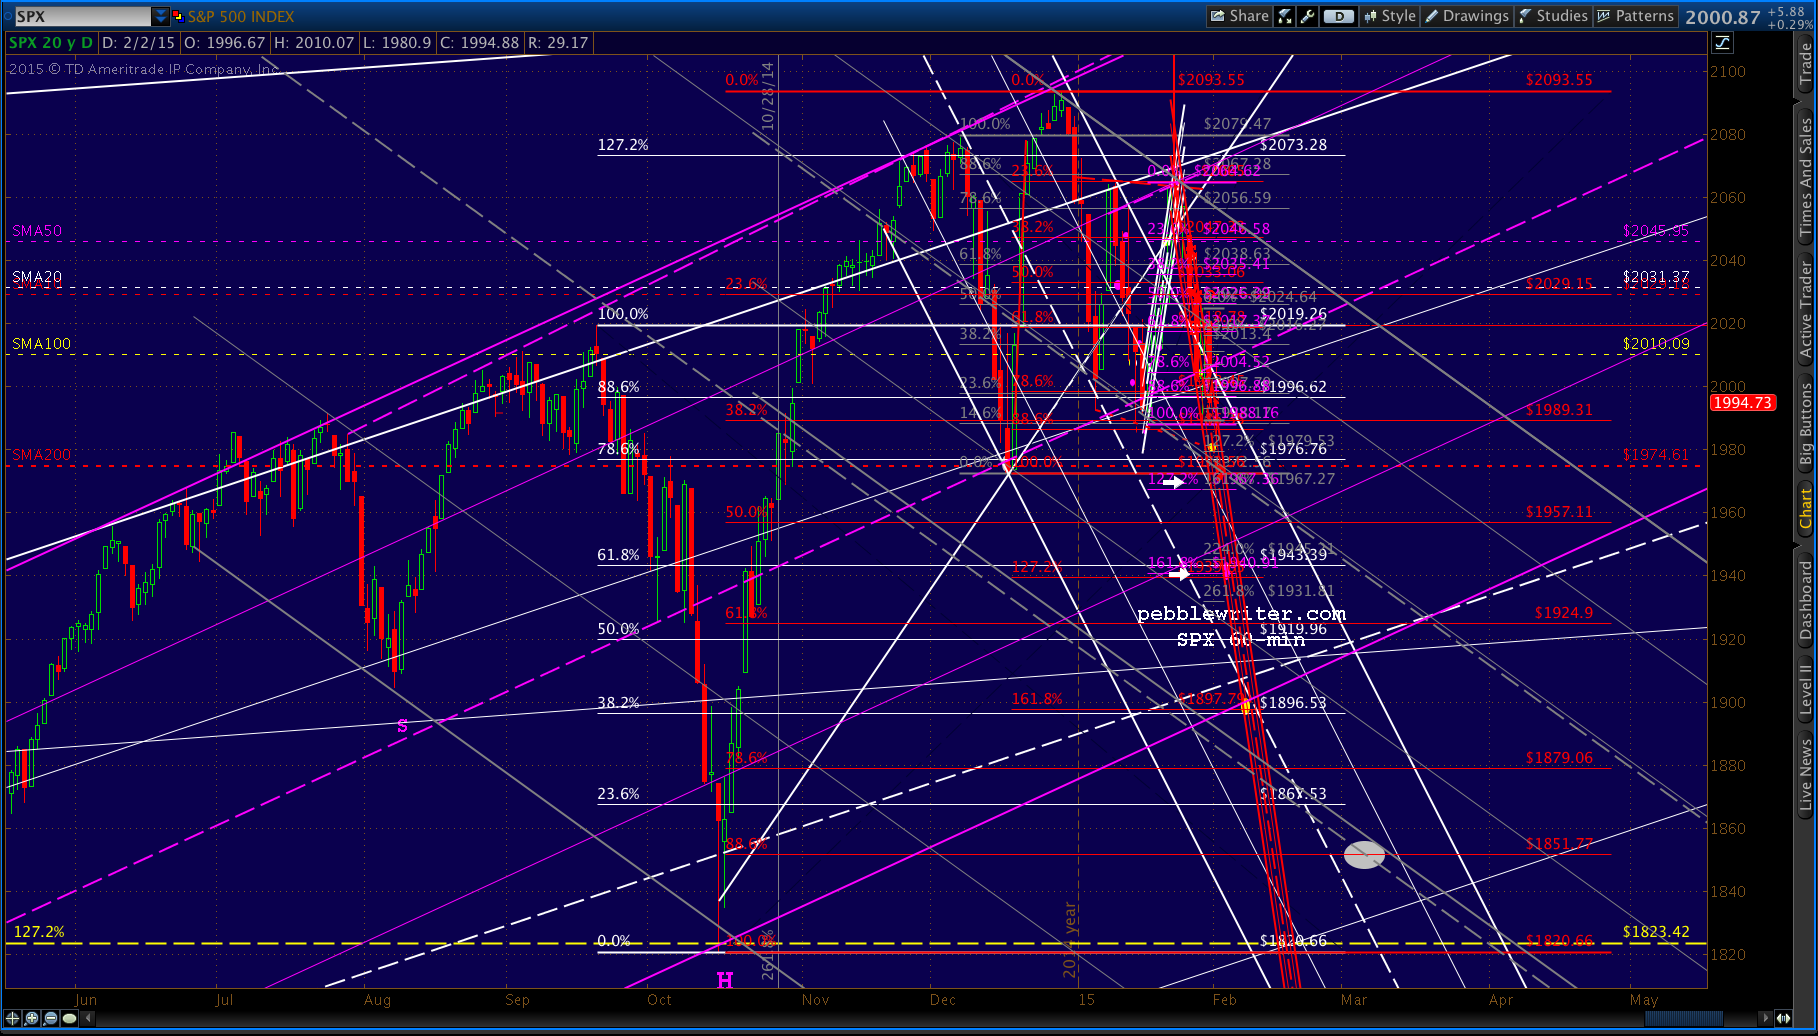
Following up on the chart above, here’s the bigger picture. We never even got a 50% retrace of the move from 1820 to 2093 — a ridiculous ramp job fueled by bullish comments by central bankers.
A drop to the SMA200 would find lateral support from the Dec 16 lows, and would be the most “bullish” downside target — particularly if it stopped north of 1972. This is the scenario we referred to on Jan 14 when we wrote:
…if it doesn’t hold, the SMA200 (yellow dot) is only slightly below at about 1965. In a week or so (say, ECB decision time on the 22nd) it could be above the Dec 16 lows and provide a rock solid bottom — if the ECB makes good on its QE threats to initiate massive sovereign bond purchases.
It’s not terribly satisfying from a Fib standpoint, but it would represent a tag on the midline of a potential falling gray channel — which is merely a theory at this point.
 If the SMA200 doesn’t hold, then the purple dot at the confluence of the red 1.272, purple 1.618, gray 2.24 and white .618 is the next most bullish downside target. At 1940ish, it’s a full 34 points below the SMA200. But, that’s not terribly unusual. And, it has the added support of a tag on the rising purple channel .236 line.
Another nice support level would be a drop to the yellow dot at the red 1.618 and purple channel bottom. It would work better at the larger red .786 at 1867. But, the purple channel bottom — which extends from late 2011 — would probably be an important line in the sand for bulls.
The most interesting scenario to me would be the full Monty — down to the red .886 at 1853ish. The purple channel (which is a subchannel of the much more legitimate white one) could be cast aside and support taken up at the white .236 line.
Though I haven’t drawn it in, 1853 is also the target of a large H&S that features the 2093 highs as the head and the horizontal line at 1973 as the neckline. Neat, huh?
Note that if we expand the width of the falling gray channel, we get a pretty nifty fit on the lower bottom. And, the midline of such channel would fit the white dot at that price level awfully well.
 I have a hard time imagining TPTB allowing this large a decline. But, who knows? Maybe things will get out of hand with Greece, Ukraine and other “problem” states seemingly increasing risk to the status quo on a daily basis.
More later.
UPDATE: 3:45 PM
USDJPY has pushed up through the triangle bottom again…
 …sending SPX up to a .886 retrace of Friday’s highs.
 It leaves a less than obvious picture of the immediate future — which, of course, is the whole idea. The message is bullish, but chase it at your own peril.