Year: 2015

  • Update on Bonds: Aug 3, 2015

    The 10-yr note yield tagged our downside target today.

    2015-08-03 TNX daily 0935Note the slight overshoot in the purple channel top’s backtest came very close to the .886 Fib (21.41 vs 21.37) while tagging the bottom of the rising white channel.  This is very important support for notes.

    A breakdown from these levels would be quite significant. Though, as we’ve noted many times in the past year, the Fed has successfully broken (or, at least, suspended) the link between lower interest rates and falling stock prices.

    2015-08-03 TNX wkly CU 0935As the long-term chart shows, it was a very well-established correlation.

    2015-08-03 TNX wkly 0935As well-established as are the upper and lower bounds of the white channel, the midline has been used and abused many times.  Escapades above it have frequently been used to lever stock prices higher.  The fundamental argument is that improved economic activity should be reflected by higher inflation and higher interest rates.

    In 2014, we saw this relationship break down in favor of a stronger correlation between lower rates and higher stock prices — thanks, in large part, to the Fed keeping interest rates artificially low.

    Since lower rates delivered higher stock prices, will higher rates help deflate stocks?  Not if the Fed can help it.

  • The Dollar Days of Summer

    GUARANTEED RETURNS!  One final reminder to existing and prospective members: our membership promotion is about to bid adieu.  If you’re currently paying $100 or $150/month, a Charter Annual Membership is the closest you’ll ever get to a sure thing. 

    At $850, it’s the equivalent of $70.83/month.  That’s a little over $2 per day for analysis that one long-time member and hedge fund manager wrote us this morning is “by far the best I’ve come across” (thanks, D.R.) 

    Best of all, your rate will never increase for the life of the site.  Not only will you save $350-950/year now, but your savings will multiply as subscription costs soar to unconscionable heights (after all, we are averaging over 13% per month.

    If you’re a current member, pass this offer along to a friend or colleague.  Referral bonuses are doubled to $200 for new during this promotion.  So, you can take him to a very nice lunch on top of doing him a solid.  New members, join as a duo and split the savings.

    Why am I doing this?  It’s my way of getting the word out to prospective new members as well as thanking those who have recently rejoined. And, the stronger our membership base, the more time and resources I can devote to the website.  CLICK HERE for more details and to sign up now.

    *  *  *  *  *

    Welcome to the dollar days of summer, where it’s all about currency… well, and the oil that’s washing up on the beach.

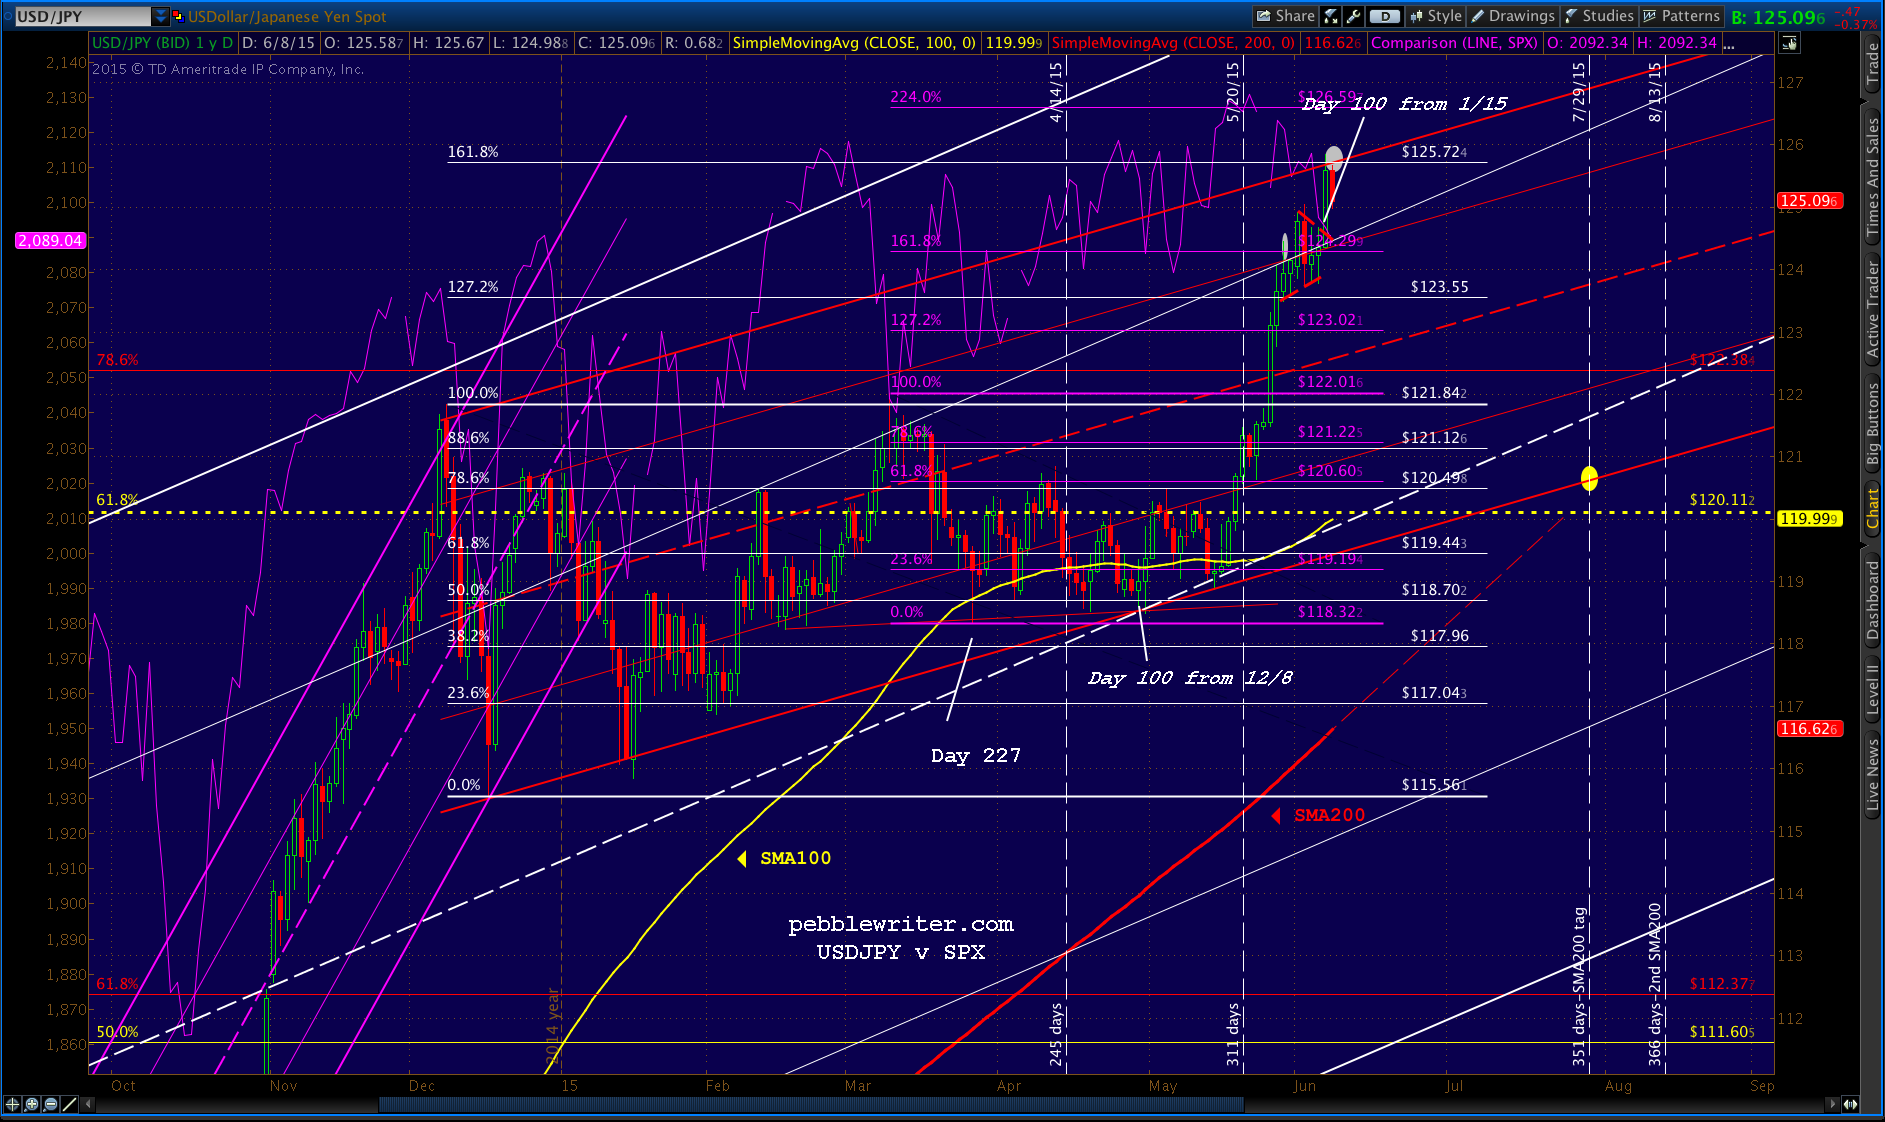
    The dollar put in a dramatic reversal last week, backtesting the channel midline again, but in a more dramatic fashion this time.  It certainly appears to be coiling for a move to complete the Gartley Pattern at 99.533.2015-08-01-DX daily 0615
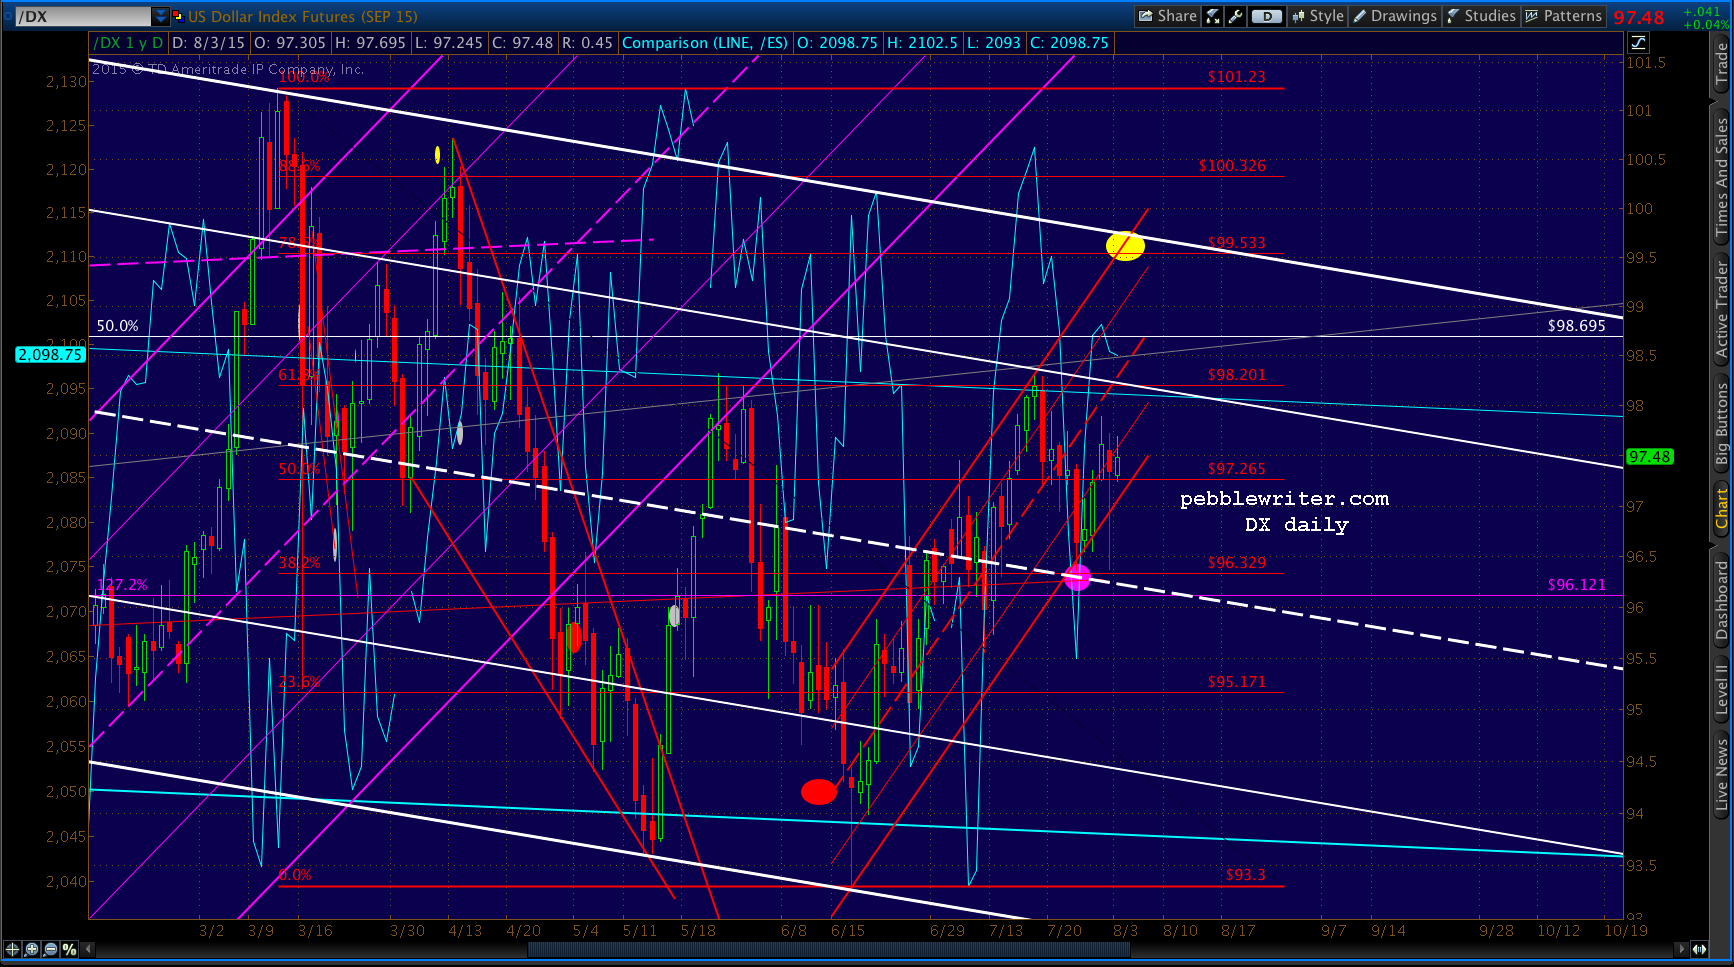
Could it have anything to do with the USDJPY, which TPTB are diligently trying to drive above the red channel midline?  In the absence (yet) of an official QQE expansion announcement or even hint, will it take?

    2015-08-01-USDJPY v ES 60 0615 
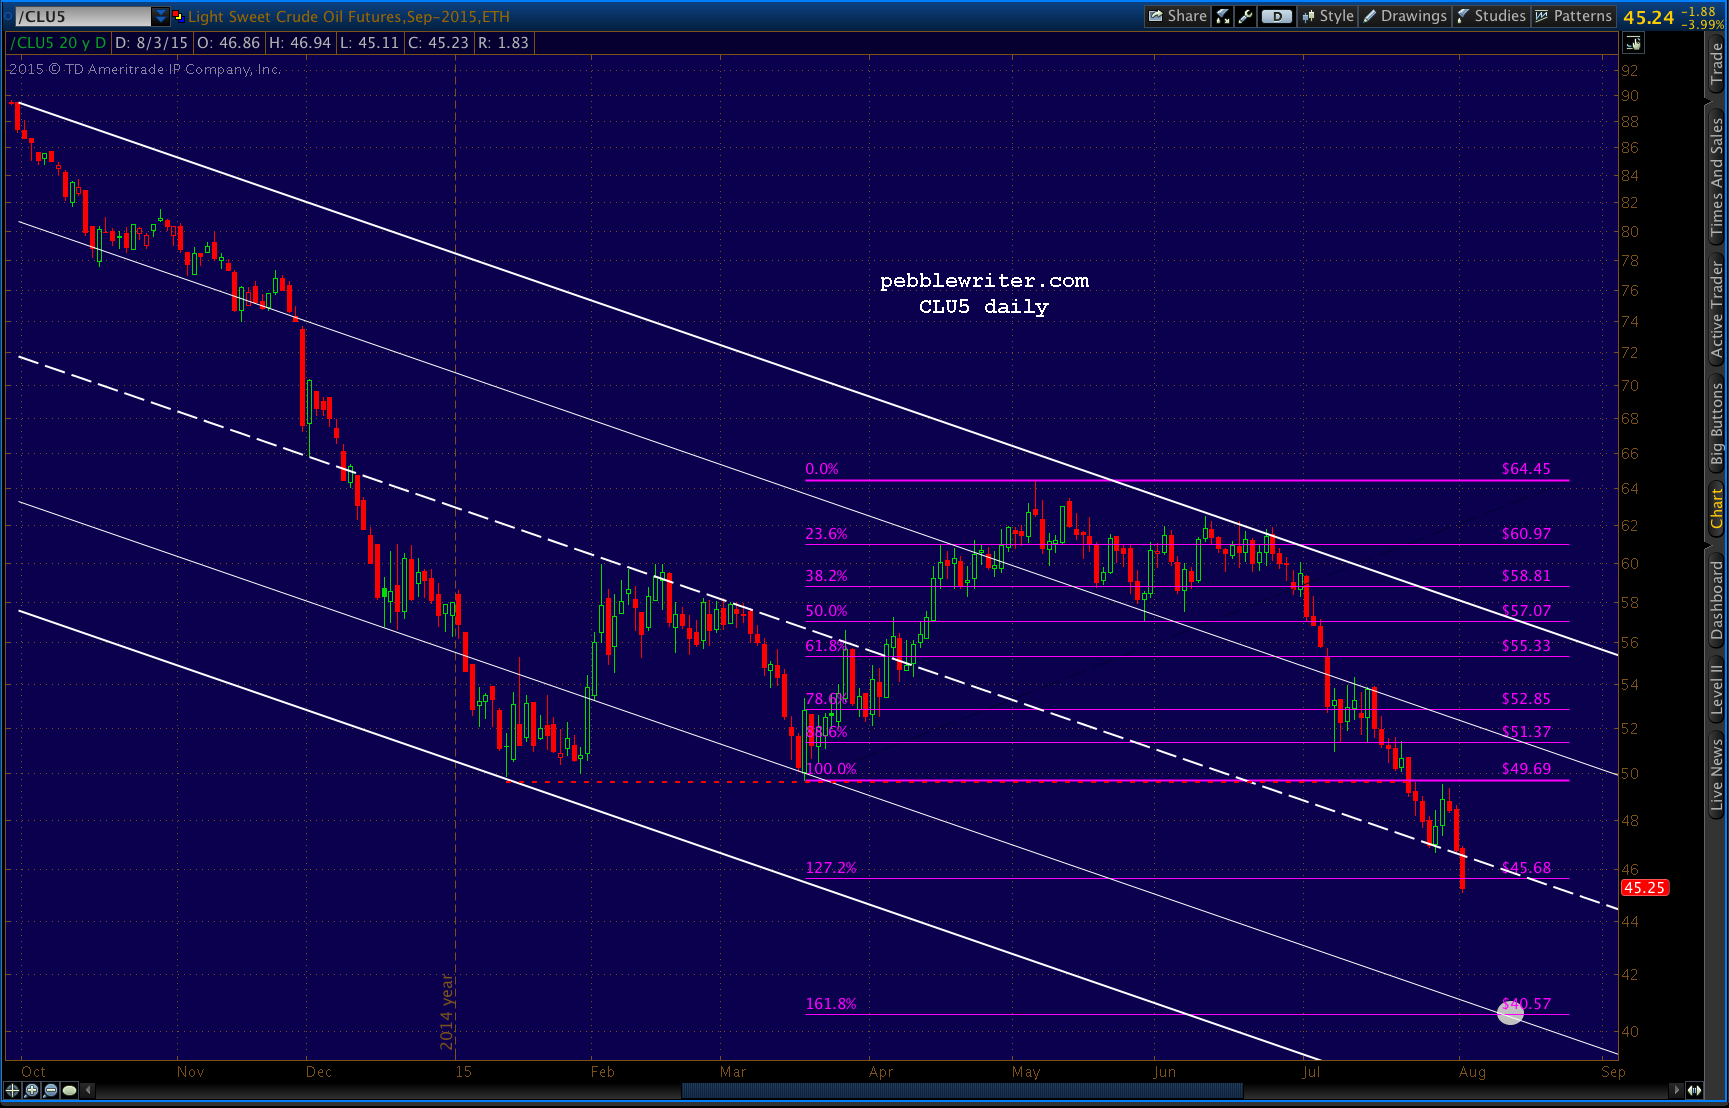
CL sure makes it look like they’re paving the way for the yen’s next leg down.  Remember, cheaper oil makes a cheaper yen tolerable to the BOJ, which has the global equities market on its arthritic shoulders via the yen carry trade.2015-08-01-CLU5 daily 0608
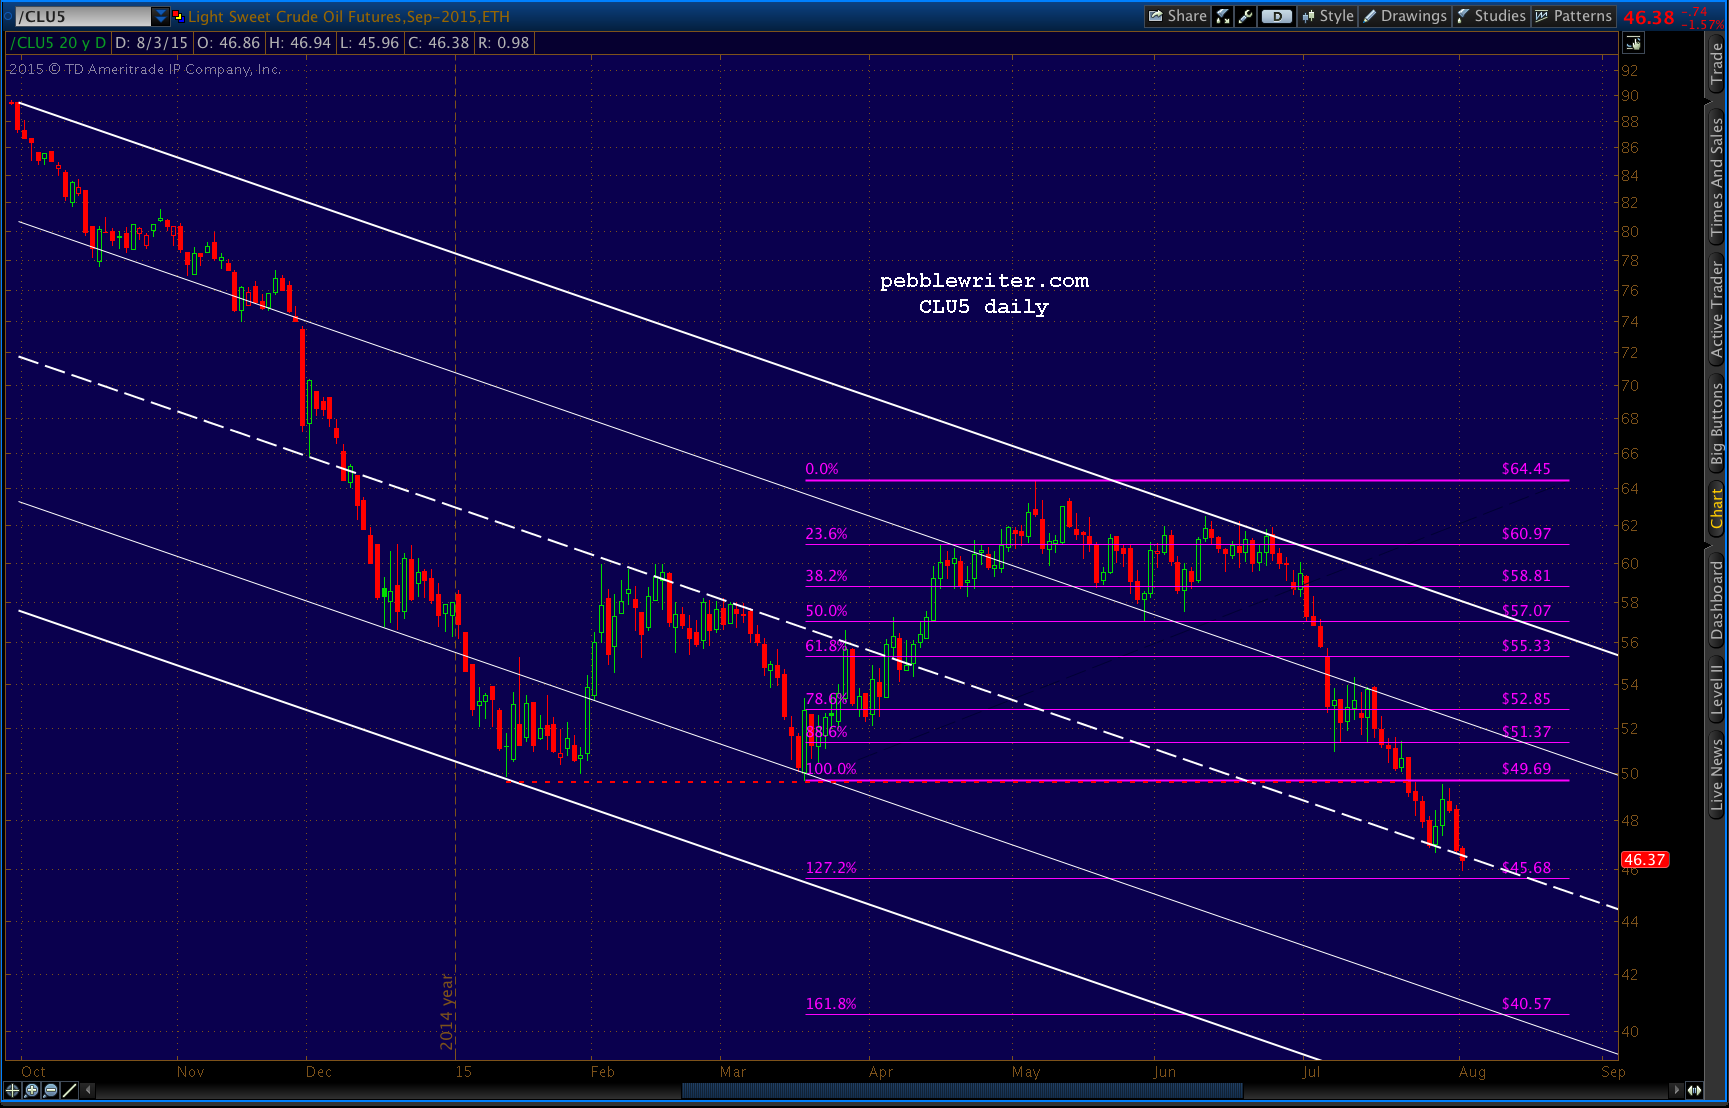
It all fits nicely with our analog, which suggests a turning point in about 10 days.  Our targets remain unchanged from last week.

    continued for members

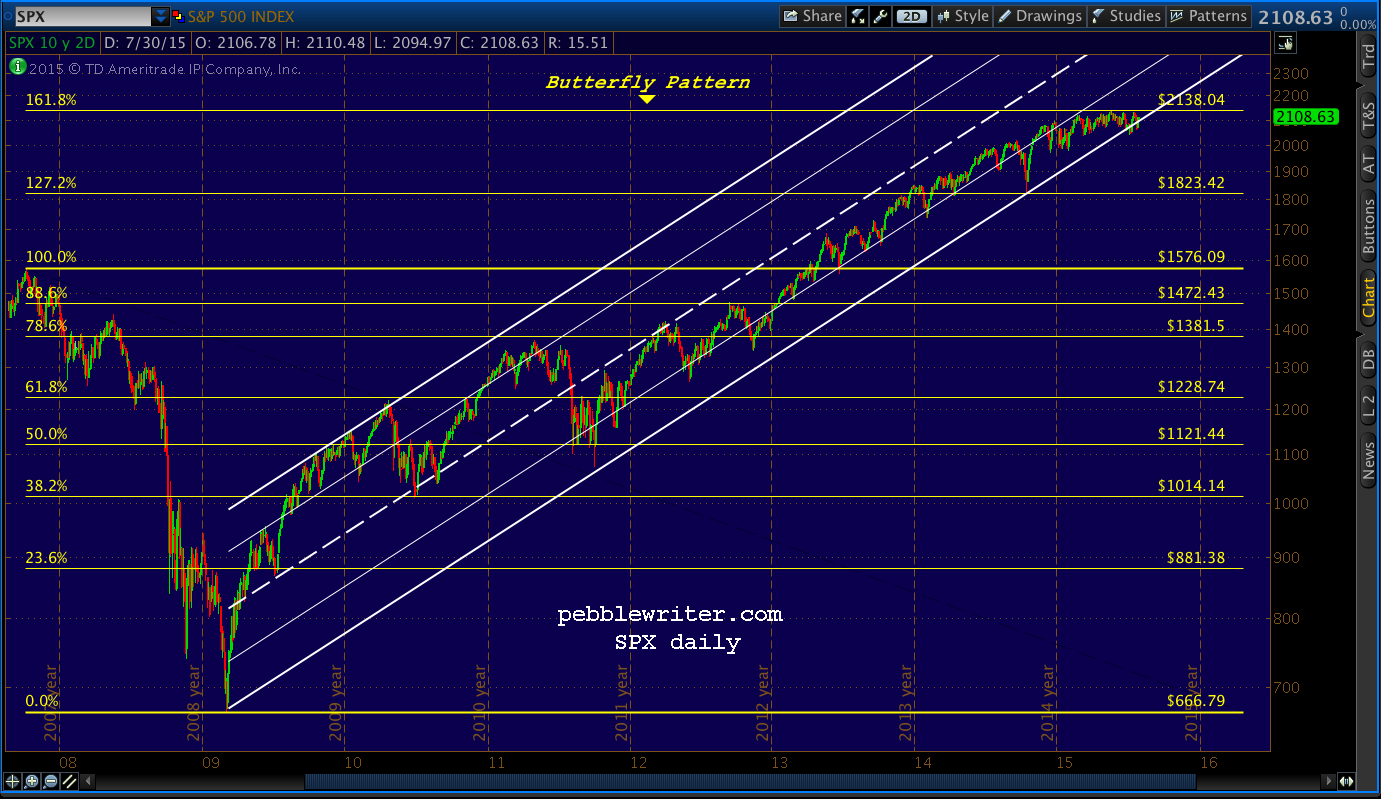
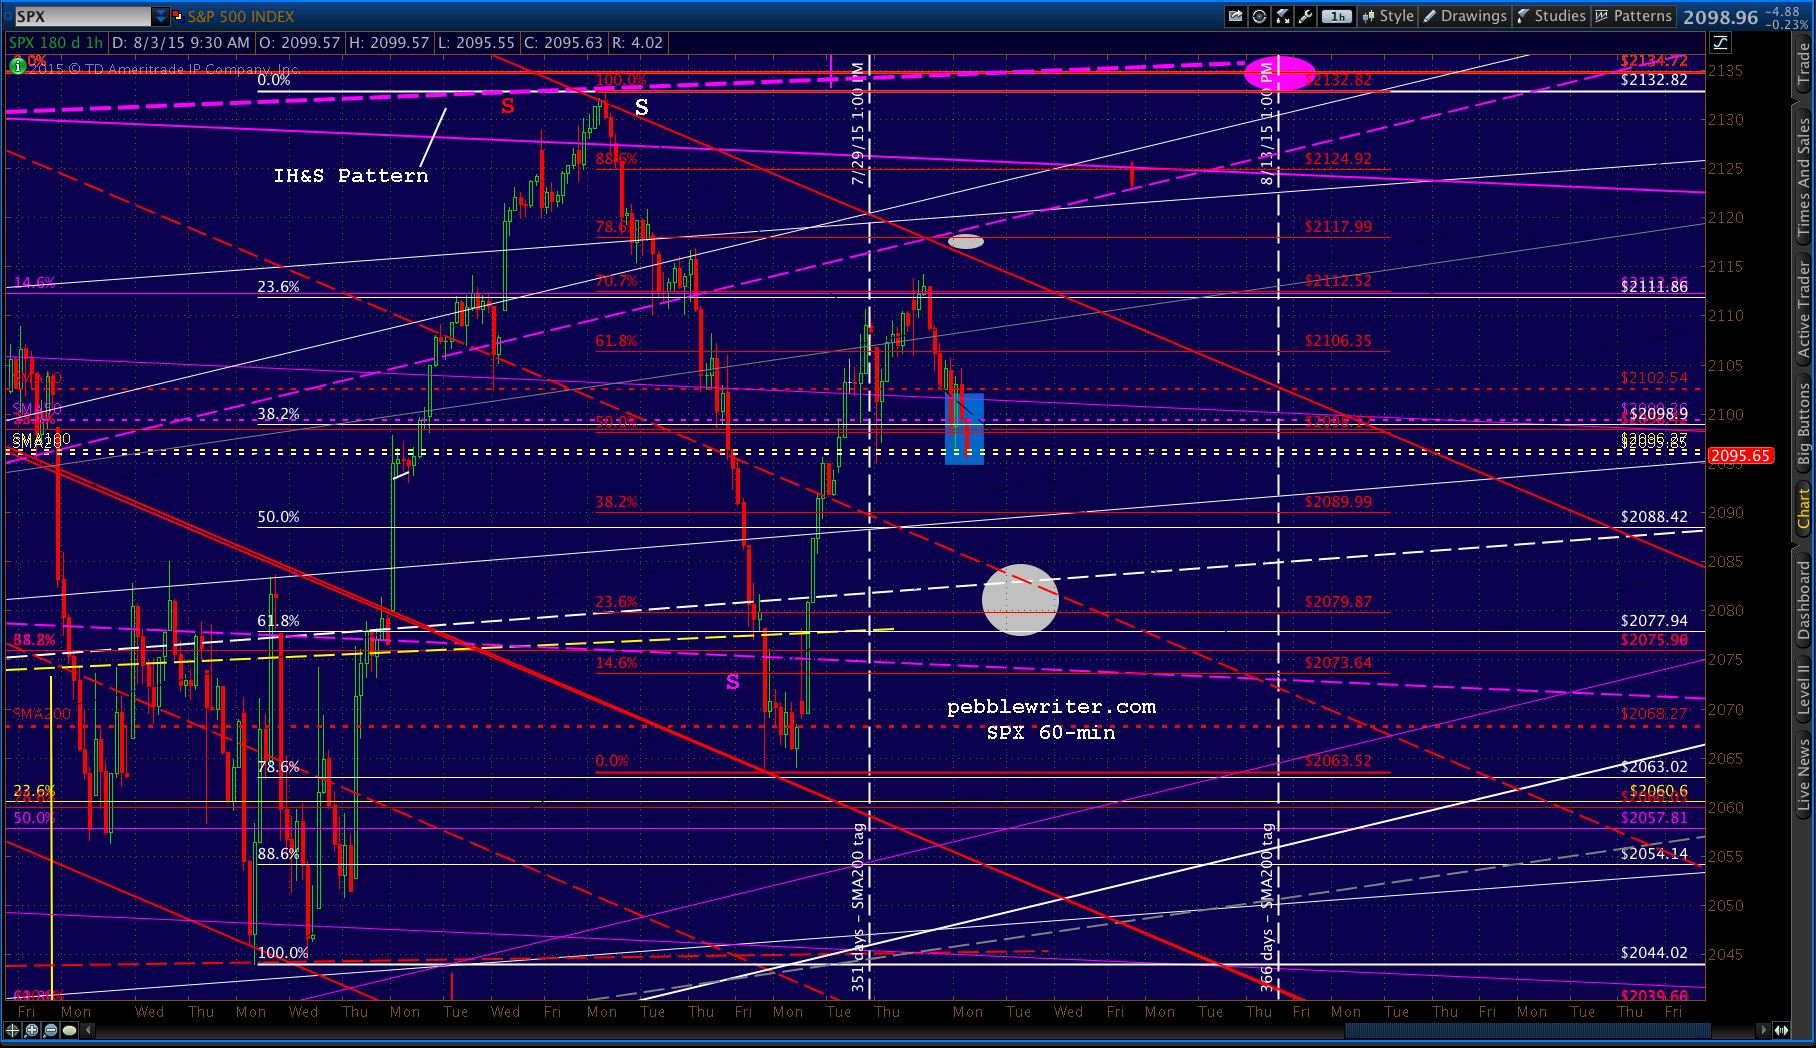
    Upside targets for SPX still include the .786 at 2112.52, the .886 at 2124.92 and the purple IH&S neckline at 2137-2140, which we expect to hit around Aug 13.

    2015-08-03 SPX daily 0615
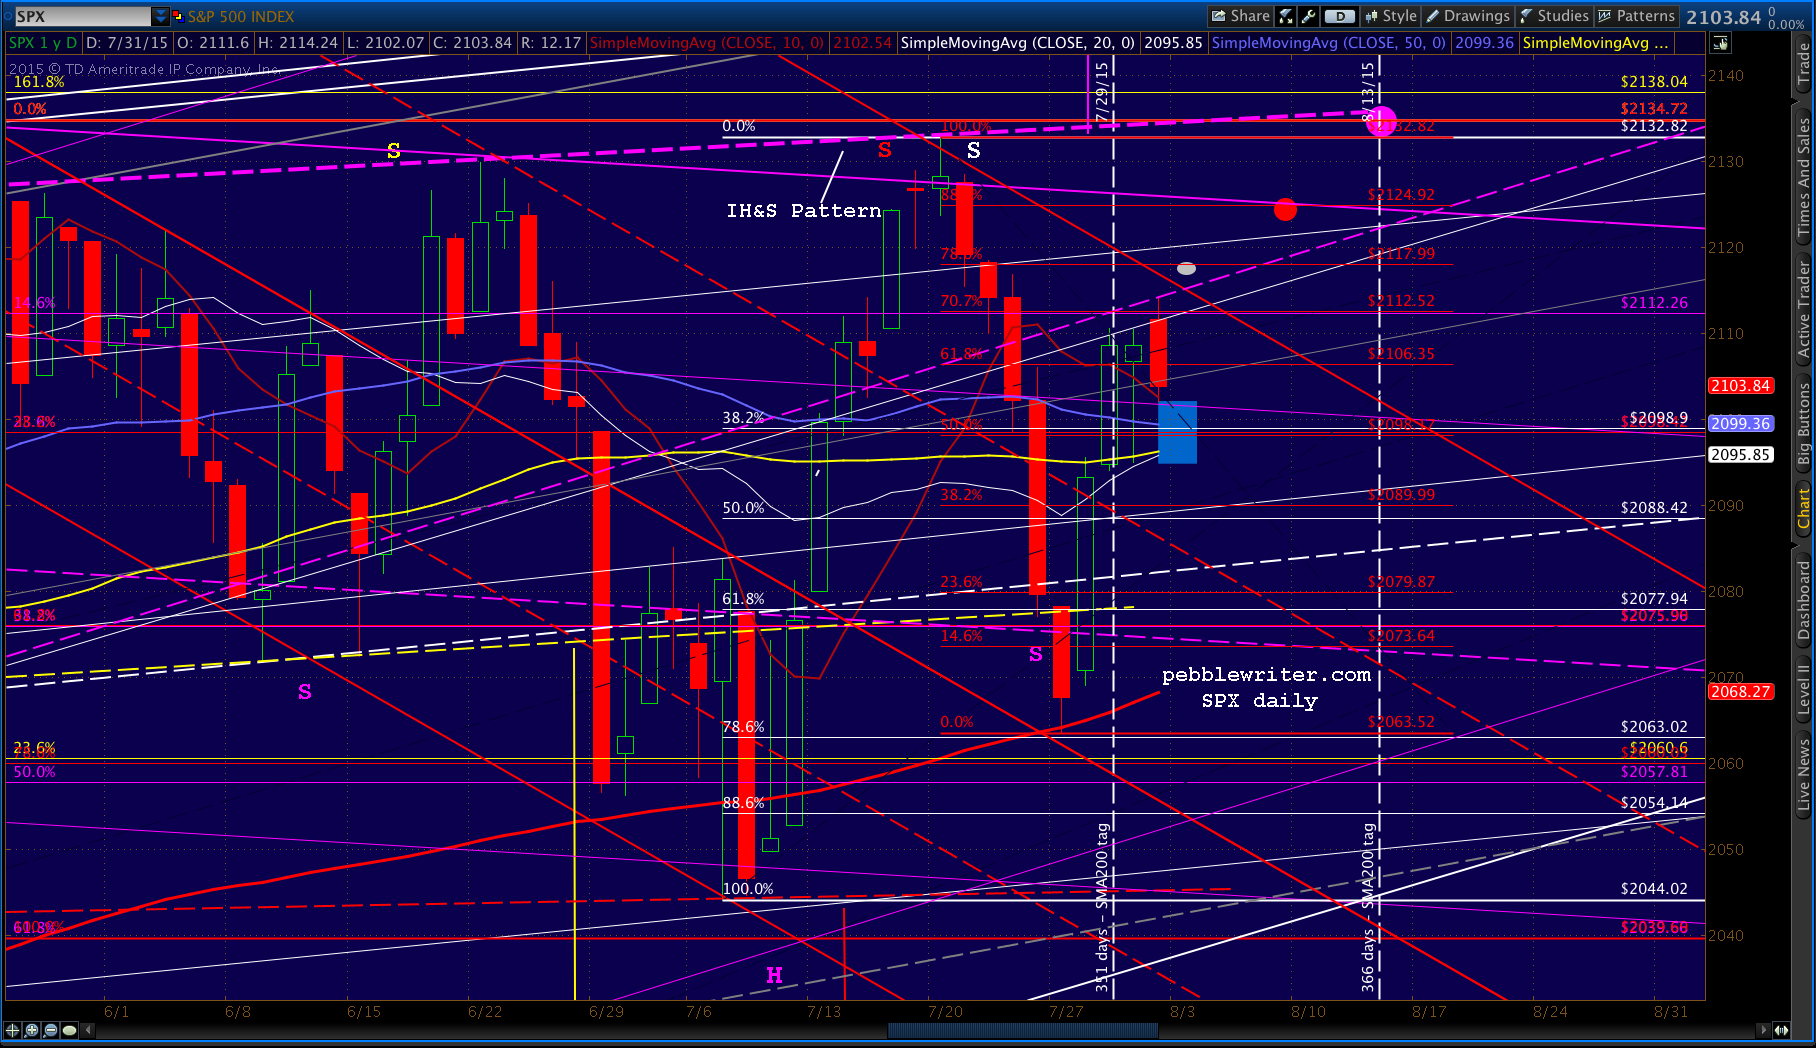
Downside support consists of the jumble of moving averages between 2096.91 and 2100.4, chief among them the SMA100 (yellow.)  The lot of them are highlighted by the purple rectangle.  A backtest is badly needed at this point, so we’ll probably see one this morning.

    SPX needs to kill some time between now and Aug 13.  So, if the SMAs don’t hold, look for support from the channel midlines gathered around 2080, and the SMA200, now at 2069.47.

    The bullish case remains a test of the IH&S neckline on Aug 13 followed by some retrenchment which eventually resolves to the upside when the BOJ takes action.

    The bearish case remains a completion of the Butterfly Pattern to the white 1.272 at 2019.87 — justified by the retreat from the purple channel midline and white channel .272 line at 2112.

    UPDATE:  9:48 AM

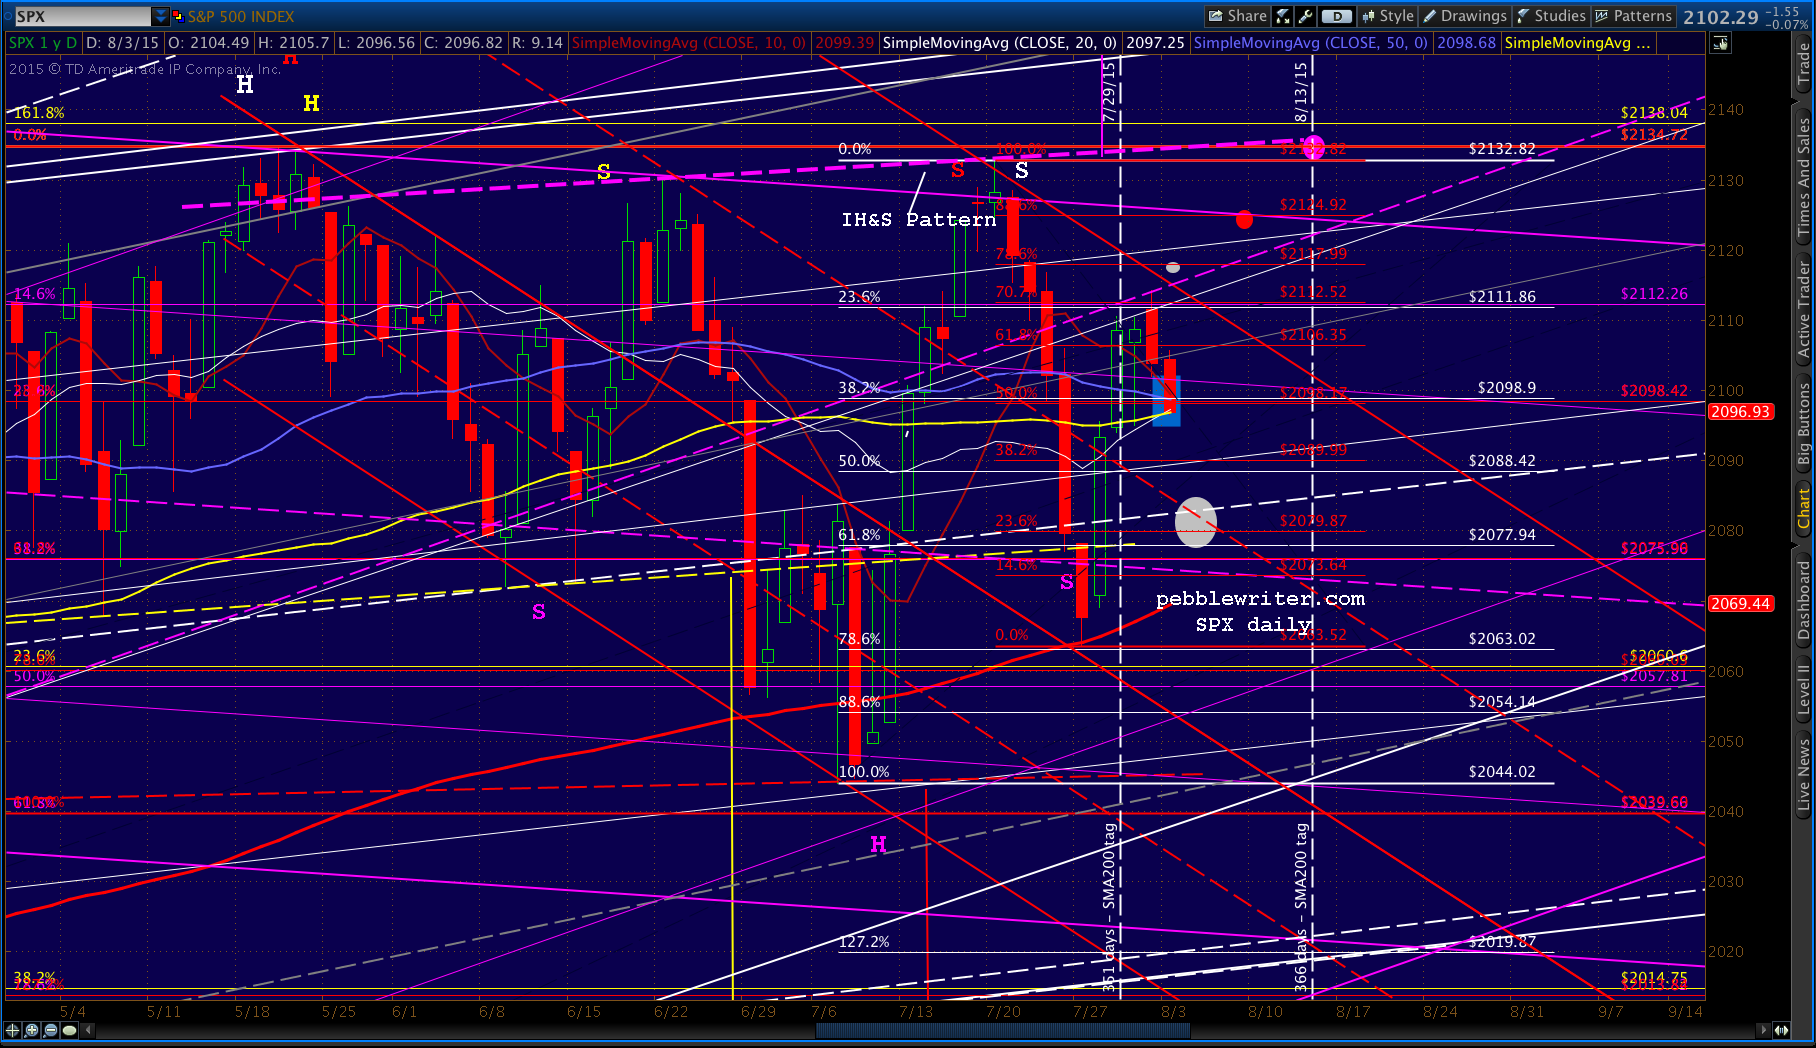
    Almost 20 minutes in, SPX has reached our target area, tagging the SMA10 and SMA20 but not yet the SMA100 (2096.86.)  It’s worth a shot at a long position here, but just be aware that there’s still exposure down to the SMA100.

    2015-08-03 SPX daily 0648UPDATE:  10:31 AM

    SPX just tagged the SMA100 itself.  It’s much better support, so the bounce is an even better bet here.  Best immediate target remains the .786 at 2117.99.

    2015-08-03 SPX daily 0732UPDATE:  12:35 PM

    SPX has dipped back to the SMA100 and is threatening to drop to the lower target.  Switching back to the short side here with tight stops (possible head fake) and initial downside targets at 2089.99, 2084ish and 2080.

    2015-08-03 SPX 60 0935The culprit is CL, which failed to hold the 1.272/midline combo.  There was no harmonic rationale for a bounce at the 1.272 (no .786 reversal along the way), but it was a likely interim stop.

    Unless it bounces back by the end of the day, CL appears headed for the 1.618 at 40.57.  Interestingly, the timetable seems consistent with our Aug 13 analog target.

    2015-08-03 CL daily 0935UPDATE:  3:44 PM

    SPX reached our next lower target at 2090 and bounced up to backtest the SMA100.

    2015-08-03 SPX 60 1244
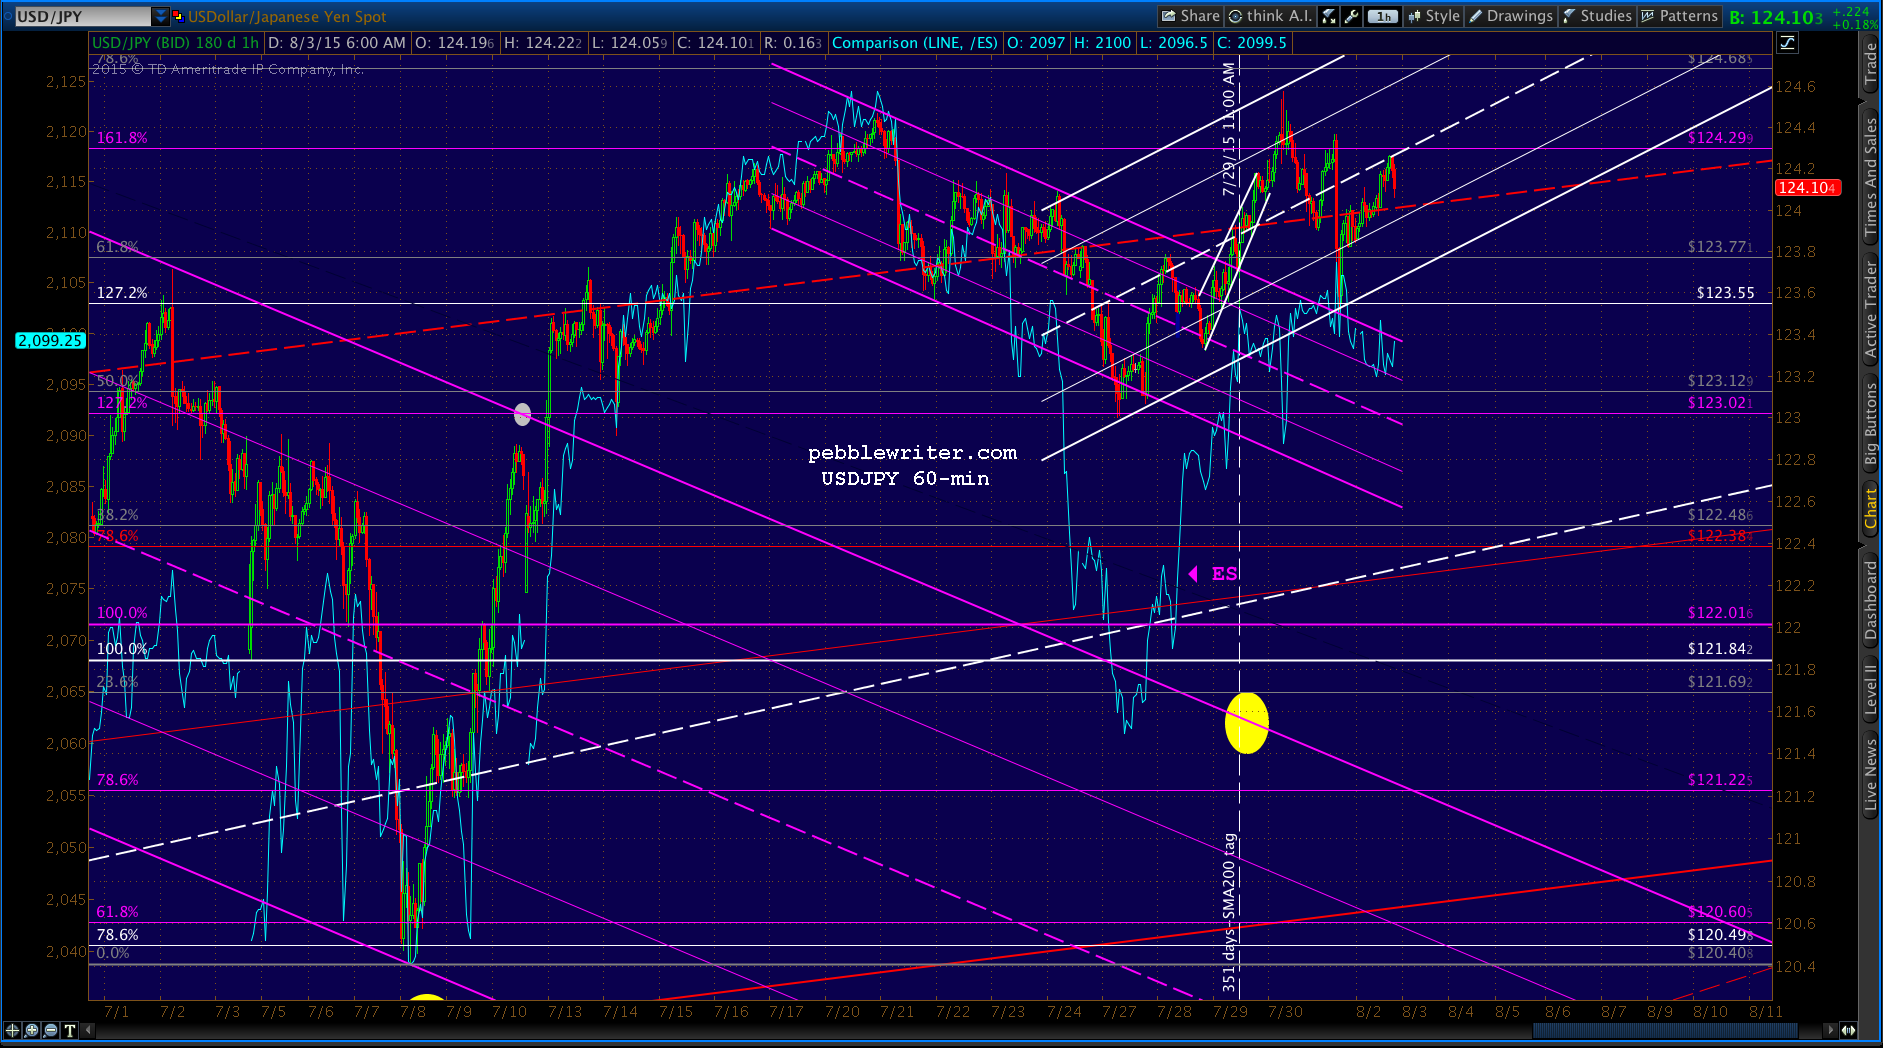
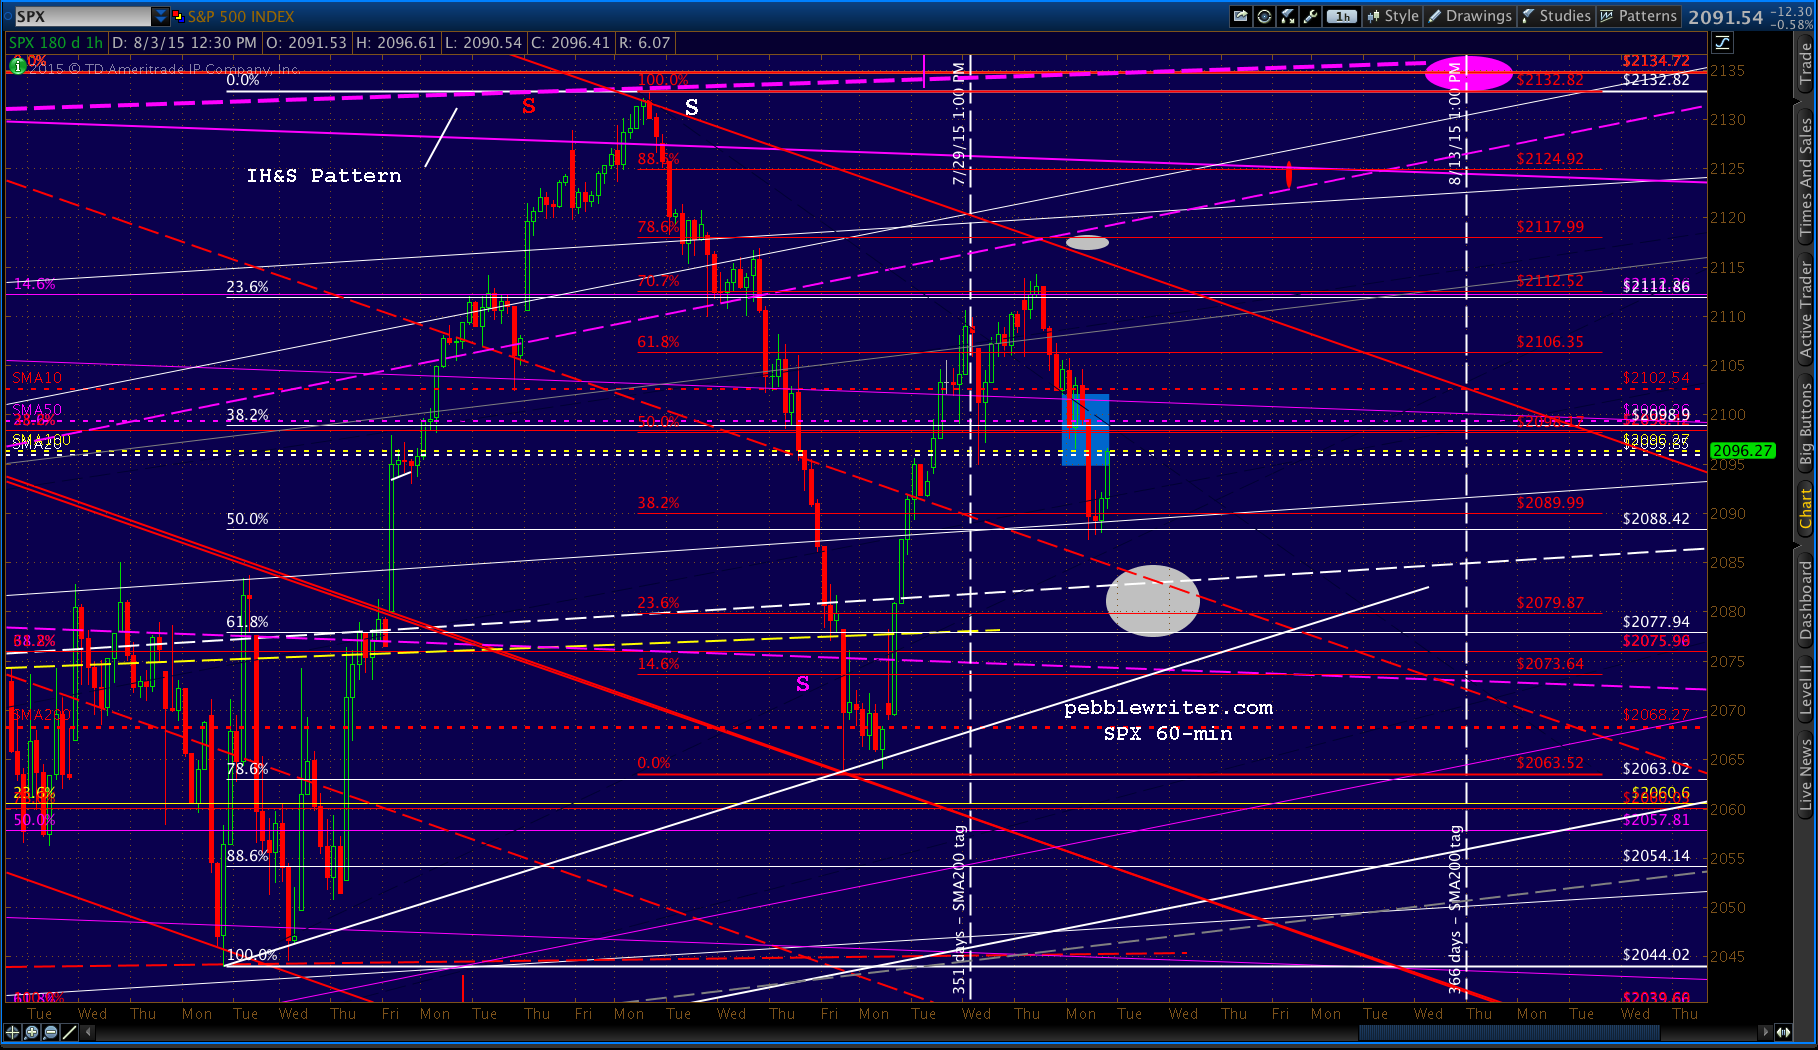
USDJPY is still below the red midline, and CL closed below the white midline and the 1.272.  Both are bearish signals, so odds are SPX has further to go on the downside.  The usual caveat applies: don’t hold short overnight unless you can hedge or at least keep abreast of developments.
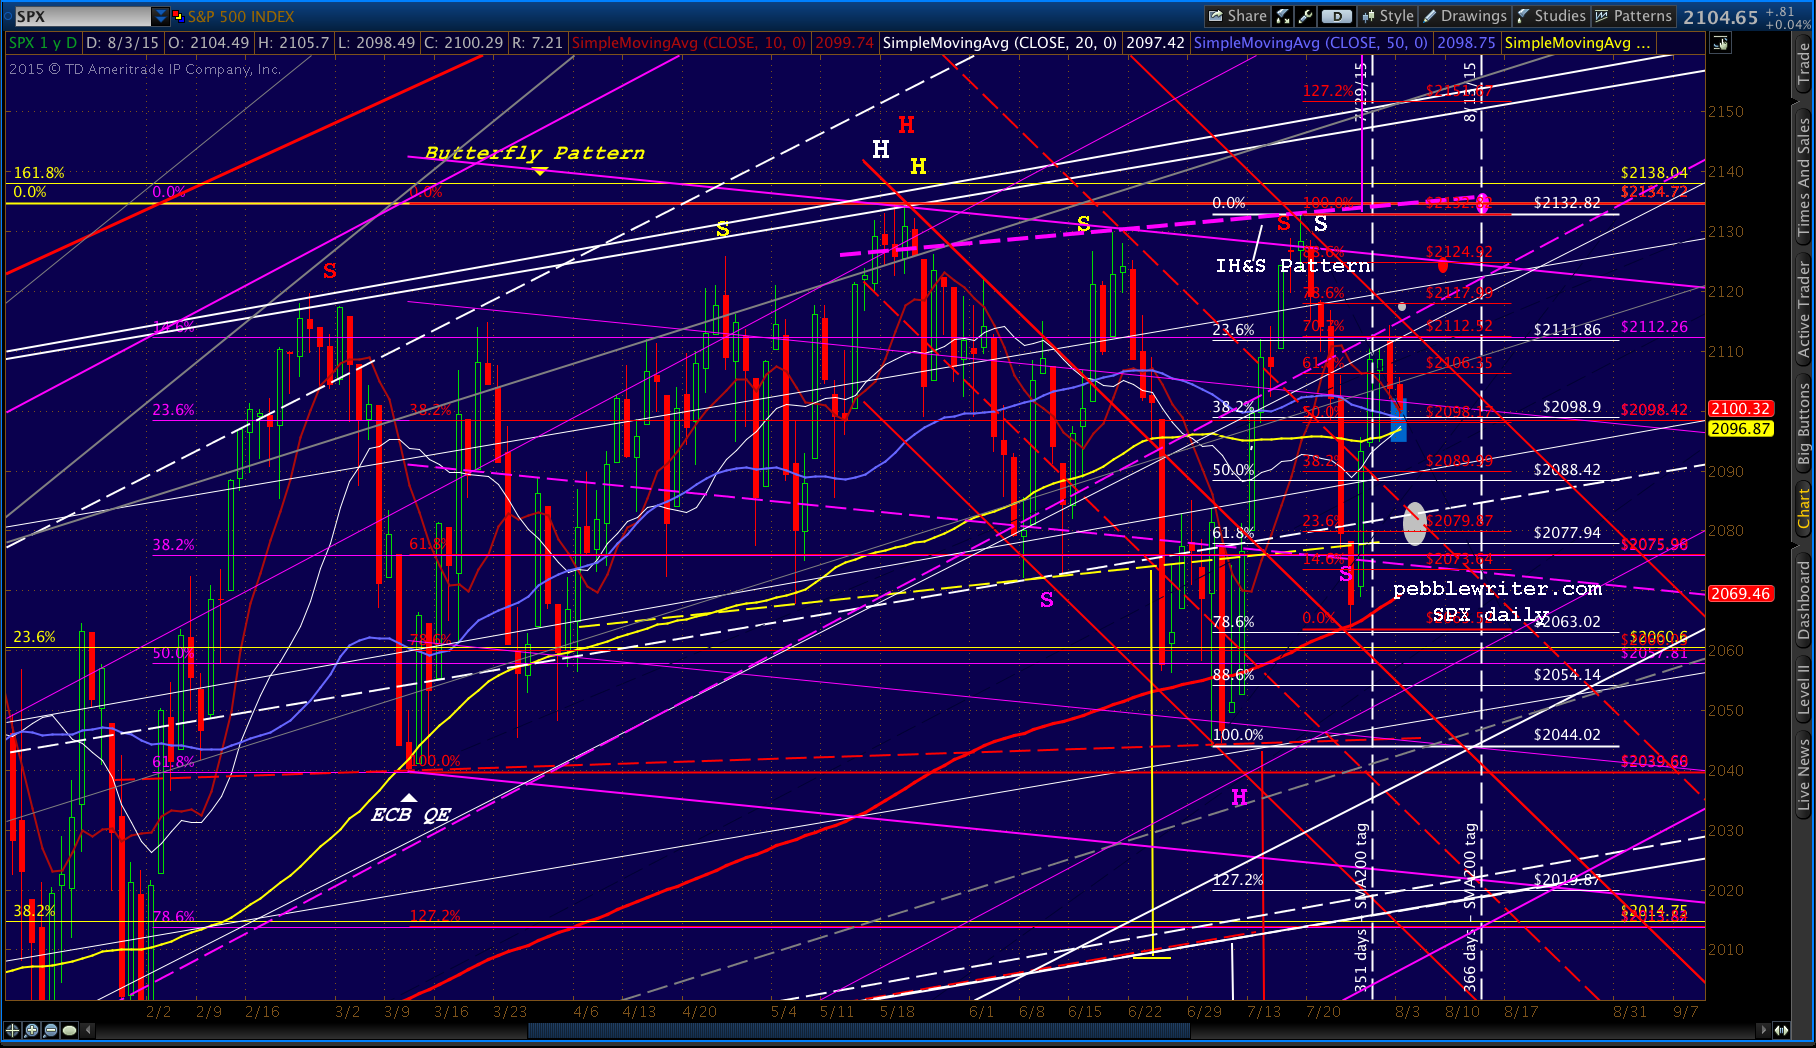


  • July 2015 Results

    At 15.79%, July was our second best month so far this year.  But, there were way too many head fakes and I was stopped out an embarrassing six times.  There were major ECB and FOMB releases, breakouts that didn’t break out, breakdowns that didn’t break down, and the constant reports of Greece being either fixed or blowing up.

    So, I suppose it could have been worse — especially given that it was our second best month this year.2015-08-01-SPX daily Jul 2015The S&P 500 index earned 1.97% for the month.  Our results, on the other hand, topped 15%.   Remember that these results reflect a theoretical portfolio of SPX that was either 100% long, 100% short, or in cash.  For full details on our calculations, please see the results tab.

    Below are the daily calls as detailed in the blue boxes sprinkled throughout the daily posts.  Clearly too many flip-flops, and way too many stops were triggered.  But, again, it was a very challenging month that, in my opinion, entailed more manipulation than usual.

    Screen Shot 2015-08-01 at 4.19.43 PMThe monthly results for 2015 so far are as follows, with an median of 13.76%.

    Screen Shot 2015-08-01 at 4.34.04 PM

  • The Big Picture: Jul 31, 2015

    There are still a handful of Charter Annual Memberships left.  At $850 — locked in for the life of the site — it’s a $350 savings over the normal annual price and a $950 savings versus a year of monthly payments.  To sign up CLICK HERE.

    If you are a monthly member at the $100 level, please note that the current monthly rate is $150.  An annual membership that locks in the equivalent of $70.83 per month for years to come is a very good deal.  Grab one now before your rate resets.

    * * * * *

    I’m still on the road today, so it seems like the perfect time to review the big picture for SPX.  It’s been over two months since we posted The Last Big Butterfly that reminded members of the last remaining large-scale harmonic pattern on the charts — also the biggest impediment to a continued rally.

    Here’s the same chart, updated for a couple of proposed rising channels that cover the 9 months since the October lows. Note that the index has gone essentially nowhere since that post.

    The index has, however, dipped below the bottom of the white channel twice in the past month, a clear violation of a 6-year trend.  This would normally be a very bearish development.2015-07-31-SPX daily bic pic 0600Yet, magically, SPX has popped back into the fold — seeming to ignore the bearish implications.  Fortunately, our analog alerted us to the fact that these past 4 months — and 3 more to come — would be full of chop.  Per the analog, it’s all part of a rather clever plan to force SPX over 2138.

    A peek at chart since 2007 shows the march from 666 has been unrelenting.  But, it hasn’t been without drama: notably the 17% correction in 2010 and the 21% correction in 2011 that were entirely predictable and highly profitable shorting opportunities.

    2015-07-31-SPX daily bic butt 0600Just as notably, 2013 and 2014 were without drama — unless we count the October 2014 meltdown that was instantly arrested by a timely Jim Bullard appearance on Bloomberg, suggesting that another round of QE might be in order.

    This stick save, by the way, is in good company.  Each and every time SPX was in danger of plunging through the channel bottom, there was a BOJ, FOMC, or ECB action that saved the day: either a QE event or a major currency move — usually involving the yen.  Over the past several months, the saves have involved CL as well.

    So, what are we to make of the dips below the long-term channel bottom?  Should they matter?  Will they derail the rally?

    Yes, they should matter.  And, no, they will not derail the rally.  The only thing that truly matters at this point is whether or not the yen carry trade (or the other, lesser means of manipulation) remain in force.  And, that, my friends, will depend on the Japanese.

    Can they stomach another increase in QQE and an accompanying lower yen?  We’ll find out in two weeks, when USDJPY’s SMA200 finally catches up with it as predicted by our March 27 analog.

    Harmonic Patterns have clearly worked in the past.  The reversals at the .618, .786 and .886 Fibs are solid evidence.  The 1.272 was largely ignored through the coordinated actions of central bankers at YE2013.  At least they acknowledged it after the fact, with a backtest (last October’s dip.)

    Will they successfully slice through 2138 – the last big harmonic pattern on the chart.  TPTB have done a pretty good job so far.  Dozens of busted chart patterns are a testament to their efforts.  But, the biggest test comes on August 13, and again in mid-October.

    Stay tuned.

    * * * * *

    Our daily forecast remains the same from earlier in the week.

    continued for members(more…)

  • Fed Still in Protection Mode

    Short version of the Fed statement: “Everything is simply fabulous; but, we’re going to hold off for at least a few months on raising rates because you just never know…”

    Apparently, after 7 years of lower or zero interest rates, we’ll never know.  There was some word tweaking that I’ll leave to the linguistically-focused.  The only thing that matters is that central banks and their lackeys everywhere swung into action as soon as the “market” reached our second support level.

    With the futures off a few points a half hour before the cash open, USDJPY and CL are working overtime to prevent all that fabulousness from spilling over into an ugly response to the FOMC.

    USDJPY broke out of the small falling purple channel and above the big red channel midline.  Who would’ve thunk it?2015-07-30-USDJPY 15 0600…and, CL broke out of the falling red channel and is busy chasing skyward to flesh out the new, wider white channel I’ve proposed.  Watch out for the backtest.

    2015-07-30-CL 15 0600Just a reminder, I’ll be on the road today and tomorrow. I should get a few chances to post updates here and there, but all of yesterday’s targets and analysis (members’ section) are still appropriate.  There is some pretty useful stuff updating our analog and its implications for the next few weeks.

    * * * * *

    Members: I’ve finished updating the performance figures for the first six months of 2015.  So far, so good, as we’ve averaged over 13% per month.  The full results are available HERE.

    Also, for those not on the mailing list, we announced a significant promotion on annual memberships late last night.  A snippet from that announcement:

    NOTE: To celebrate the relaunch of pebblewriter.com, we are offering Charter Annual Memberships for only $850 to the next 12 members who subscribe. This locks in your annual membership cost for the life of the site. 

    It’s a pretty sweet deal, as members who are still paying $500/year from 2012 (versus the standard $1,200) will attest.  Get a full year of great research and analysis for the price of less than six months at the monthly rate of $150.  And, your rate is guaranteed to never go up.

    The full details may be found HERE.  If the post is still up, there is still availability (or, I haven’t had a chance to get to my laptop.)

    Good luck to all!


  • Pebblewriter Results Update: Jan – Jun 2015

    Beginning in January 2015, I resumed identifying potential turning points in SPX based on my harmonic, chart pattern, analog and technical analysis.  The data shown below are the results of that research.

    Up until July 2013, I had tallied monthly performance figures based on specific intra-day long/short calls for SPX.  I then took an 18-month break from daily posting to actively manage a hedge fund.

    In January 2015, I resumed daily posting that identified anticipated turning points.  This gradually evolved into specific long/short alerts, culminating in late June with the availability of memberships and the return of the much-beloved blue boxes.

    How well any individual member fares with our forecasts will depend on the type and effectiveness of trading they do.  I, for instance, am a much better forecaster than trader.

    Regardless, it’s my opinion that, whether you’re an active trader or a buy-and-hold investor, knowing potential turning points, periods of elevated danger, etc. is much better than crossing your fingers and hoping for the best.

    [see membership information HERE.]

    Note:  These results are by no means intended to indicate the results that current or future subscribers might achieve.  See full disclosures at the site’s Results Page.

    Screen Shot 2015-07-29 at 1.52.35 PMA Quick Summary

    January was an outstanding month as the “market” was allowed to settle after a flurry of algo-inspired moves designed to generate a positive year-end in 2014.

    February was in equal parts dismal. It took me most of the month to figure out the CL algo nonsense that was sharing duty with USDJPY in driving prices higher.

    March made more sense once I understood the CL algos better; though, the latter part of the month was consumed with big picture work on the current analog.

    April was even more consumed with the analog and a confusing series of higher highs that kept busting harmonic patterns, one after the other.

    May was significantly easier, as the day-to-day intentions of USDJPY and CL was much more apparent.

    And, June was terrific. As the analog played out, I was able to focus more on swing moves rather than very short-term trades.  I began offering memberships again, and started using the “blue boxes” to alert members to changes in my stance.

    July is shaping up even better, with interim results of around 11% at mid-month.

    Note: I recently altered the format of the daily “trading” log (available on the site’s RESULTS page) to include multiple upside and downside targets that are often in play.  It’s faster and easier to maintain, which allows me to track the effectiveness of any particular strategy.

    And, now that we’re caught up through the first half of the year, I’ll post each month’s results within a week or so of the following month. Please feel free to offer any suggestions that will make the site more useful.

    GLTA!

  • Incredulity

    When I first discovered the current analog back in March, it fascinated me that such an obvious pattern even existed.  I had pretty much resigned myself to never finding another one as spectacular as the 2011 as 2007 analog.

    It has obviously helped our daily forecasts tremendously.  But, best of all, it has made it possible to believe the impossible.  Chartists like me are looking to make sense of the many patterns in the market.

    It would have been impossible to accept the twists and turns we’ve seen over the past year were it not for understanding the grand scheme underlying — and, unifying — the whole stinking pile.

    yellen upWhich reminds me — the FOMC statement is due out at 2pm today.  Fed days are always difficult to trade.  With expectations so high on both sides of the “will they or won’t they raise rates” debate, best wait for the dust to settle.  We’ve had an excellent month so far; why tempt fate?

    Having said that, I do have some thoughts about what to expect.

    continued for members(more…)

  • CL Pulls One Out, Again

    Screen Shot 2015-07-28 at 2.19.57 PMWhen a rally fizzles because USDJPY is faltering, CL can usually be counted on to come to the rescue. Such was the case with this morning’s pop and drop  (the drop just plain looked bad, coming as it did during the FOMC brain trust’s powwow.)

    What’s an HFT-wielding central banker to do?  Simple: CL, which tagged the 78.6% retracement of its sharp rally from its March lows overnight, suddenly popped a full 3.8% in under 8 hours.

    There wasn’t any news.  There wasn’t any change in the fundamental supply-demand picture.  Just the need for an immediate reversal before last night’s emini ramp job turned negative.  Some folks would call this manipulation.  To me, it’s just another day in our centrally planned “markets.”

    HOW DO THEY DO THAT?

    Here, in all its algo-ramping glory: TL tags the .786 Fib, then breaks out and backtests the white falling wedge before making a bee line to the falling red channel top.  Naturally, it was ready to reset after the close.

    Here’s the 5-min chart: 2015-07-28 CL 5 1159The 60-min chart, however, shows it never broke out of the falling red channel.  In other words, the downward trend represented by the channel is still intact.

    2015-07-28 CL 60-min 1136It could do it all over again, tomorrow, of course.  Such is the nature of today’s “markets.”

    2015-07-28 SPX 5 1159Pebblereaders know that USDJPY drives most of stocks’ gains.  It has since the 2011 lows.  But, when it needs to reset — as it is now in observance of our analog — then CL is usually able to keep things on the rise.

    It’s why DX has ceased to act as a valid indicator of “market” direction. And, for bulls, it’s a classic manifestation of “heads we win, tails you lose.”

    HOW IT WORKS

    A rising USDJPY drives stocks higher, and entails a falling yen and rising US Dollar — the classic yen carry trade [explained here.]

    A rising CL, on the other hand, drives stocks higher but entails a falling dollar. The yen might rise at the same time.  But, more often than not, it stays put and the euro rises to offset the USD’s drop.  It’s more fuel to the fire, as a strengthening euro is viewed as a sign of confidence in the failing union.

    TODAY’S EXAMPLE

    The relationship can be clearly seen on today’s charts.  The 5-min USDJPY is seen in the chart below, with ES shown as the thin purple line. When it bumped up against the falling purple channel line and started falling again, ES normally would have followed along.2015-07-28 USDJPY v ES 5 1221But, at that exact same moment, CL had broken out of white falling wedge, backtested it, and was one its way to new highs (breaking through the small trend line shown in red.)  2015-07-28 CL v ES 5 1427Once CL reached the top of the falling red channel and could go no further without really making headlines, USDJPY magically reversed and was ready to take over the algo activity.

    If you don’t watch this stuff every day like I do, then it’s hard to notice.  That’s because the Fed, BOJ and ECB are more subtle about it than the PBOC.  To the casual observer, it seems like the market just  always goes up, no matter what the news, economic data, etc.  Now, at least, you’ll know why!


  • Backtest, or More?

    Following the 5th sell off in a row, the S&P 500 futures reached the SMA200 again yesterday.  It started with a sell off in USDJPY (yen strength, dollar weakness.)

    So, it’s only natural that when the panic button was pushed, it activated an overnight ramp job in USDJPY…2015-07-28 USDJPY 60 0620…and, thus, ES.  Look carefully, though, and you’ll see that ES merely backtested the broken white TL off the 2009 lows and is drifting lower. It correlates with USDJPY’s backtest of the red channel midline.

    In other words, this rescue will likely be something less than an actual reversal.  Pop and drop, anyone?2015-07-28 ES 60 0620continued for members(more…)

  • At Last

    The long-awaited final movement of the analog we’ve been watching for four months is here.  Originally floated on Mar 27, it has done a bang up job of signally the USDJPY’s moves which, in turn, have helped tremendously in our daily forecasting.

    Though I’ve vacillated on the target price over the past couple of months, the timing looks to be rock solid.  From our June 8 post:

    2015-06-08 USDJPY daily 0630

    The next key date as originally forecast several months ago is this Wednesday, July 29.  USDJPY is already tumbling… 2015-07-27-USDJPY daily 0605…and, as we discussed last week, NKD is tumbling right alongside it — getting closer to that dreaded H&S Pattern we’ve anticipated.2015-07-27-NKD daily 0605SPX reached our next downside target on Friday a few days ahead of schedule — which means that target was probably too conservative.

    While there will no doubt be bounces along the way, the key is to remain short until we reach our next downside targets posted last week.  It will probably be scary, but it should be a very profitable week.

    continued for members(more…)