 Note: yesterday’s targets remain intact.
We have quite a few new and renewing members from our membership promotion these past few days. One renewing member who admits a short bias asked, “if the market is growing exponentially, isn’t the smart bet to have more short exposure than normal? Why assume TPTB gods are in control? It goes against all the natural algo/patterns/fractals/harmonics you base your studies on.”
“Why do you think “man” (TPTB) are stronger than God’s fractal nature? Your bias is that TPTB will overcome the butterfly harmonic with an analog justification. To me, it’s binary. Either markets and all of nature are fractal/harmonic or they’re not. And, if the latter is the case then they are just pretending to be intelligently designed.”
These are thought-provoking questions that I thought deserved their own post. So, I’m dedicating today’s post to answering them, as best I can. What exactly is happening in the stock “markets” these days? Can TPTB defy “God’s fractal nature?” Is there an intelligent design to the way markets operate (or don’t)?
Those With Loaded Guns
I’m reminded of a scene in the movie: The Good, The Bad and The Ugly. In these old spaghetti westerns, things were pretty simple. As Blondie explains to Tuco:
You see, in this world there’s two kinds of people, my friend. Those with loaded guns, and those who dig. You dig.
In today’s “markets” it’s pretty much the same. The central bankers, big hedge funds, high frequency traders and too-big-to-fail banks have loaded guns. The rest of us dig.
 It’s probably always been this way. TPTB (The Powers That Be: the afore-mentioned central bankers, most HFT’s, some hedge funds and TBTF banks) just have bigger, better, faster tools with which to manipulate markets than in the past.
I have a fairly traditional Wall Street educational background. My undergraduate majors were in math and economics, and I earned an MBA from a top-10 business school. I became a CFA charterholder a few years later. I was taught that earnings and economics drive markets, and — like most on Wall Street — never questioned these principles.
In early 2011, I was becoming more interested in chart patterns and technical analysis. I came across a blog post that mentioned Gartley Patterns. For whatever reason, a light bulb went off. It certainly seemed like Harmonics had worked reasonably well in the past.
I began studying Harmonics, developing models that tracked and forecast time and price-based patterns. After a few months, I came to believe the market was nearing an important top. The crash hadn’t been that long ago, and another leg down seemed like a distinct possibility. So, I started a blog and wrote my first post: Charts for May 2, 2011.
 I think it had about 3 readers, so I followed up later that day with a somewhat more alarming title: Collision Looming? I needn’t have bothered. It had already loomed and the top was already in — about an hour before that post.
It was slightly early, as the Gartley indicated 1381.50 instead of the 1370.58 which ended up being the top. But, it was a good call.
I topped it a couple of months later with the discovery of an analog that suggested SPX was repeating a pattern last seen at the 2007 top. It wasn’t just similar looking. It was a beat-for-beat, point-by-point replay. If it played out, there would be another leg down that could take SPX below 666 to as low as 350 — a 78% crash as opposed to the 57% one we’d already sustained.
 The analog played out perfectly — to a point. It correctly identified to exact day and exact price that SPX would top out before plunging sharply.
On July 21 [see: Pulling the Trigger] I wrote “1347 might be the last best chance at an excellent short.”
Someone who bought $10,000 in at-the-money SPY puts that day would have made $125,000 in less than two weeks. For 10-pts out-of-the-money puts, the profit would have been more like $600,000.
I struggled to come up with a reason why analogs should work — why this one had worked.And, more importantly, if it worked so well through October 2011, why did it stop working after that? The Path to 350 laid out the natural consequences of SPX continuing to follow the 2007-2009 script. What could derail it?
 I’ve always wondered if someone patrolling the blogosphere came across my charts or someone else’s. The site was up to about 2,000 hits/day at the time.
In either case, it’s safe to say that they realized where the market was headed unless something happened to divert it. The alarm was sounded.
On October 6, 2011, the Bank of England expanded its QE by £75bn. Also on October 6, the ECB greatly expanded its LTRO at a time when the cost of Italian and French CDS was soaring. And, on October 11, future Fed chair Janet Yellen suggested a third round of QE was warranted.
Together, these three events were enough to bust a falling channel (below, in red) that had guided prices lower during the 21% plunge between May and October, and more importantly, was set to drive prices much lower.
SPX quite naturally found its way to the .618 Fib level at 1257.58 by Oct 24. With this move, it established a well-formed falling channel (in purple) that fit with every single peak and valley from the last 5 1/2 months.
This fit perfectly with the analog, which suggested that the next leg down had arrived. SPX retraced 35 points over the next two sessions, looking for all the world like it was ready to plunge.
Then, on October 27, the BOJ announced a ¥5 trillion increase in its QQE program. The S&P 500 shot up 50 points — capping a 20% move off the Oct 4 bottom.
 As we’ve discussed many times, it wasn’t so much the actual easing that did the trick, but the effects it had on the Japanese yen. The yen’s demise has driven stocks higher over the past six years through a mechanism termed the “yen carry trade.” For those unfamiliar, a explanation can be found HERE.
SPX’s huge 4% rise on October 27 was nearly as dramatic as USDJPY’s enormous 5.3% spike. In short, the analog, and all the downside it implied, was finished.
 Those Who Dig
I believe in Harmonics. After thousands of hours thinking about and charting Harmonic Patterns, I’m still not sure why it works. It could very well be the result of intelligent design, as the member suggests. Given its ubiquity in nature, that doesn’t seem much of a stretch. Or, it might be a self-reinforcing mechanism that works simply because investors believe it does.
 I’m not sure it really matters all that much. I’m also not so sure that one’s faith or lack thereof should determine whether to accept or ignore recurring patterns. The fact is that they exist. And, to ignore them is to court disaster.
I have dedicated the past four years of my professional life to finding these patterns. The Galileo quote at the top of each page on this website isn’t there just because it’s catchy. From a professional standpoint, it’s my passion and my purpose.
“All truths are easy to understand once they are discovered; the point is to discover them.”
It took me hundreds of hours to discover and develop the 2011 as 2007 analog, and it hopefully made a lot of people a lot of money. But, I fully recognize the possibility that the analog, like applying Harmonics to investing, might well be a human contrivance.
Some clever Wharton summer intern might well have sat down with his hedge fund boss and explained how cool it would be if they recreated the 2007-2009 crash (after taking a massive short position, of course.) When the whole world panicked, they could use their profits to scoop up a highly-leveraged long position and wait for central banks to save the day.
Some day the truth will out; but, I suspect it’ll be many years from now and will initially be derided as tin foil hat paranoia (God knows how many concerned looks I got from some very smart people when warning them of the impending 2011 correction!) In the meantime, we’re following another analog, waiting for it to play out — or not.
As such, I think the burning question isn’t so much whether analogs work — nor why — but what should one do with the knowledge?
 Suppose you enjoy horse racing. You are fairly knowledgeable, and have become quite adept at handicapping and betting on winners and losers. Then, one day, you find out from an unimpeachable source that a favorite is going to throw a big race.
Obviously, you’d be leery of making a big bet to win. But, would you bet big on a loss? What if the jockey changes his mind? What if he can’t hold back his steed? What if the intended winner suffers an injury? There are so many possible outcomes that a huge bet based on the information would be unwise. But, wouldn’t you rather know than not know?
As investors armed with shovels rather than loaded guns, such is our lot. Knowing what the patterns indicate, we can use that information to protect ourselves. The more aggressive can even try to capitalize on them. There is no approach that’s right for everyone, because everyone has different objectives, risk tolerance and time frames. And, IMO, there is no wrong approach — with the exception of sticking your head in the sand and hoping for the best.
Digging
To answer the member’s question, I don’t assume TPTB are stronger than God’s fractal nature. Knowing how and when TPTB plan to overcome the Butterfly Pattern resistance at 2138 doesn’t tell us whether they’ll be able to pull it off.
 But, I’ve seen it happen time and time again: in 2011 as described above, at the end of 2013 when SPX reached the 1.272 at 1823, and the many, many times that the market was saved from a melt-down by a spike in USDJPY, an expansion in QE or a well-timed Fed president quip. And, that’s just the central banks.
I found out the hard way that there are some very big, very skilled HFTs which study harmonic and chart patterns in order to prey on those who trade them. As an important Fib level approaches, they’ll frequently spoof the futures right on up through resistance, only to turn around seconds later and spoof in the opposite direction — trapping human traders who can’t react as quickly.
This activity has decimated the ranks of active traders and is the bane of everyone whose palms aren’t greased by the HFT money machine. It’s tolerated by the Fed and other regulators because the perpetrators have learned to only drive prices higher, not lower. Those who drive prices lower are driven out of business or thrown in jail.
So, it’s a distinct possibility that TPTB will — as our analog suggests — pull off the breakout that gets SPX past 2138. After six years of very effective market manipulation, I’d go so far as to say it’s a probability. We should get our next signal that the current analog is on track within the next week.
If they can’t pull it off? The big Butterfly Pattern promises a significant sell off of at least 15%. If they can, get ready for more exponential growth in prices — still unjustified by the underlying earnings and fundamental economic data. Whether or not investors see shades of China in so-called developed markets will be beside the point.
Good, Bad and Ugly
It’s fair to say that avoiding or even postponing another market crash has been “good” in many respects. The “bad” is a matter of opinion. But, to me, it’s that trillions of dollars have been poured into the balance sheets of many of the organizations which caused the financial crisis in the first place — rewarding, rather than punishing, bad actors.
Surely, there must have been other, better opportunities for the money to produce real growth and recovery. No doubt these opportunities weren’t represented by well-funded lobbyists.
 In terms of “ugly,” it’s hard to know where to start. We could talk about the $1.5 quadrillion in unpriced, unregulated derivatives (20X global GDP) still out there, or the 94 million Americans who have dropped or been forced out of the labor force, or the comatose Baltic Dry Index.
But, the ugliest “ugly” in my book is the fact that after 7 years of zero interest rate policy and trillions in market manipulation quantitative easing, nothing is fixed. Prices have been reinflated, for sure. But, no surprise that we haven’t solved the problem of too much debt by issuing more debt.
At some point, you would think our “leaders” would throw up their hands and admit they screwed the pooch. Yet, Japan issues the bulk of its new debt simply to pay the interest (to themselves, as the biggest holders) on their ever-increasing pile of debt. And, no one says a word.
There’s not one peep about the idiocy and the deceit from the mainstream media, the politicians, or our so-called business leaders. They know full well that when the music stops, there won’t be enough chairs for the “haves,” let alone the “have-nots.”
A few days ago, former President Jimmy Carter said what’s been on the minds of many. In response to a question on the Supreme Court’s Citizens United decision and the impact money has on politics, Carter answered:
Now it’s just an oligarchy, with unlimited political bribery being the essence of getting the nominations for president or to elect the president… So now we’ve just seen a complete subversion of our political system as a payoff to major contributors, who want and expect and sometimes get favors for themselves after the election’s over. …
With Wall Street campaign contributions topping $1.2 billion in the most recent election cycle, don’t look for changes any time soon. Algorithmic trading, whether on behalf of big hedge funds, HFTs and TBTF banks, will continue to flourish. When on behalf of central bankers, it will likely continue to prevail over chart patterns, Harmonics and analogs.
 It will eventually fail, of course — perhaps even with respect to the current analog. And, if the past is any guide, the crash will be much worse than if TPTB hadn’t strangled true price discovery in the first place. As the noose around our collective necks grows ever tighter, we would do well to remember Tuco’s prophetic words:
You never had a rope around your neck. Well, I’m going to tell you something. When that rope starts to pull tight, you can feel the Devil bite your ass.


 Back in 2008, it obviously occurred in the early days of the crash.
  But, the previous instance in 2004 came at the tail end of an 11-month consolidation that eventually broke out, yielding three more years of the bull market.
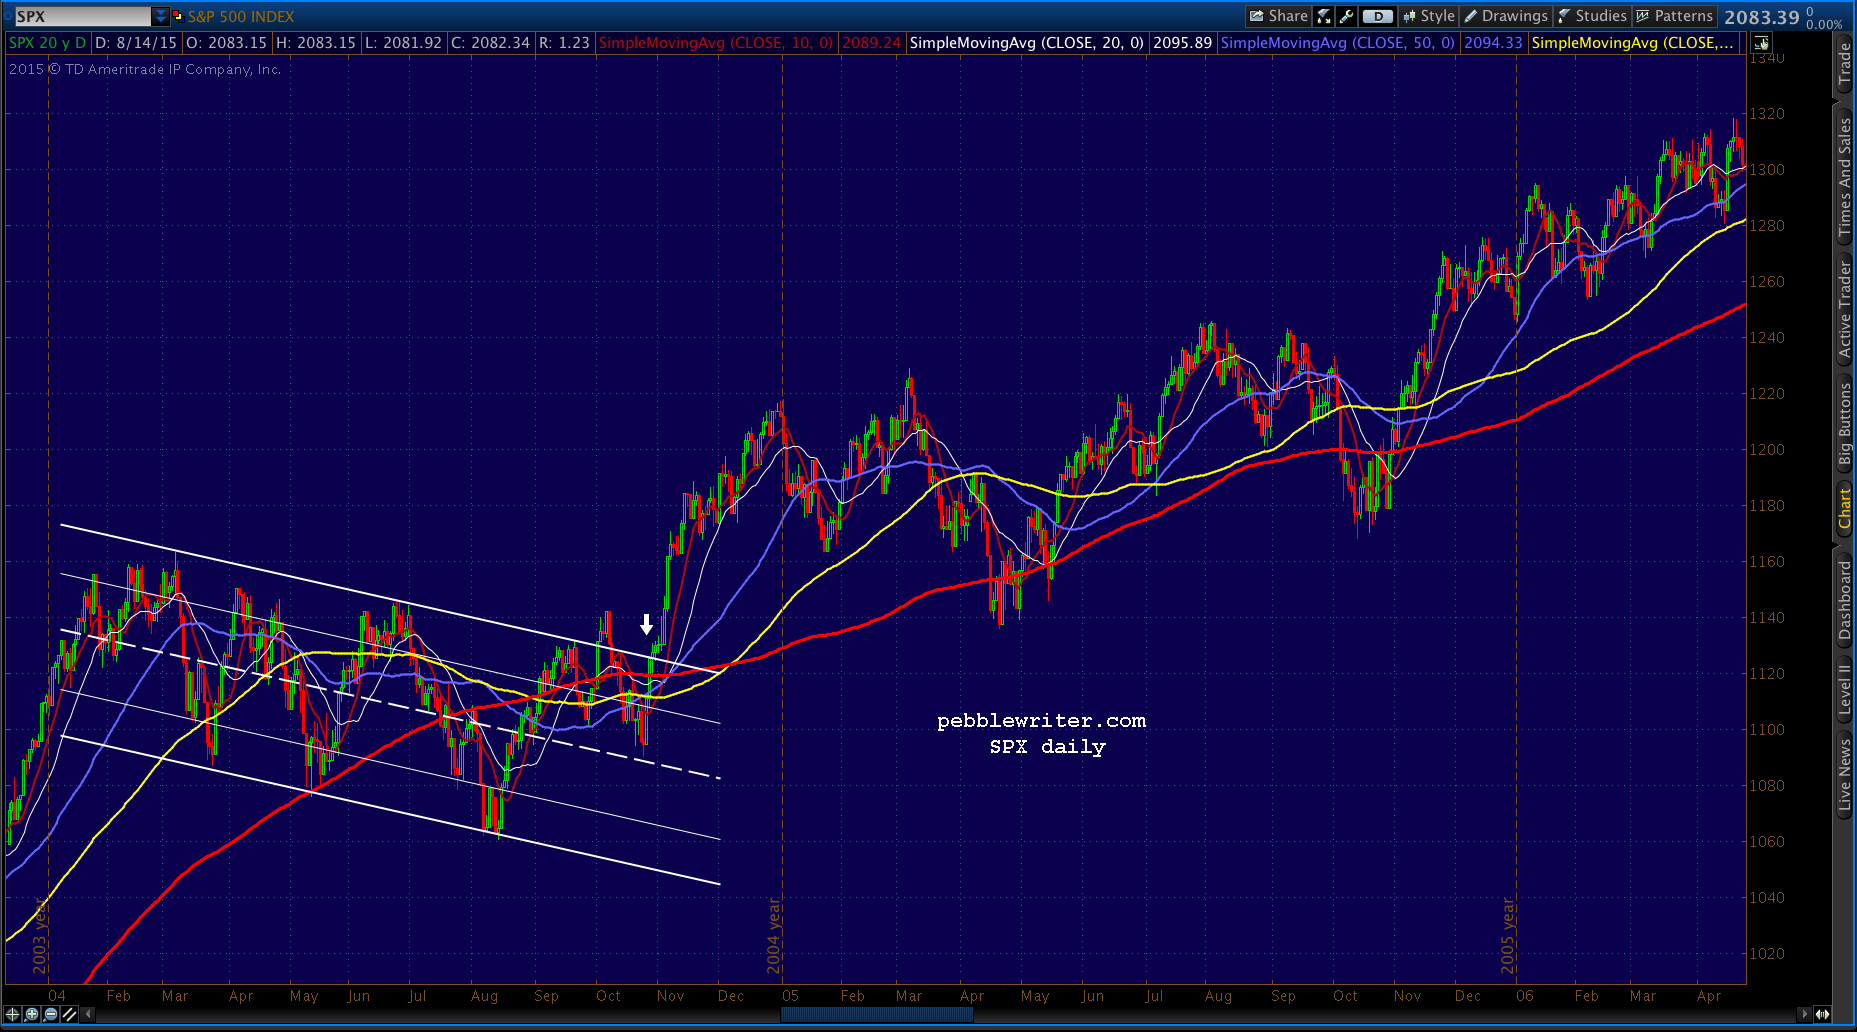 Coiling doesn’t tell us which way the market will go when it breaks out/down, just that the consolidation’s days are numbered.
 Our targets remain unchanged from yesterday.


