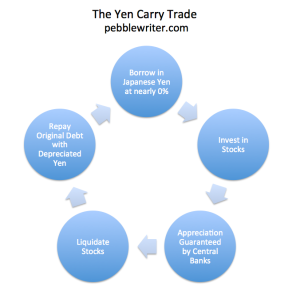
 Who runs the stock market? What determines where prices go over time, on a daily basis, or even moment-to-moment? Is it the economy, interest rates, earnings, capital flows?
Today was a not-too-subtle reminder that the yen carry trade is still very much in charge of the market, whether day-to-day or moment-to-moment.
For more on the yen carry trade, CLICK HERE.
The S&P 500 has essentially doubled since the BoJ declared war on the yen in late 2011. But, it ran out of steam once USDJPY had recouped 61.8% of its losses since its 1998 highs.
In the world of Fibonacci patterns, the .618 retracement is the most important level of all. [You needn’t believe in Fibonacci patterns; but, it’s important to know that many investors do…and, trade accordingly.]
For more on Fibonacci levels, CLICK HERE.
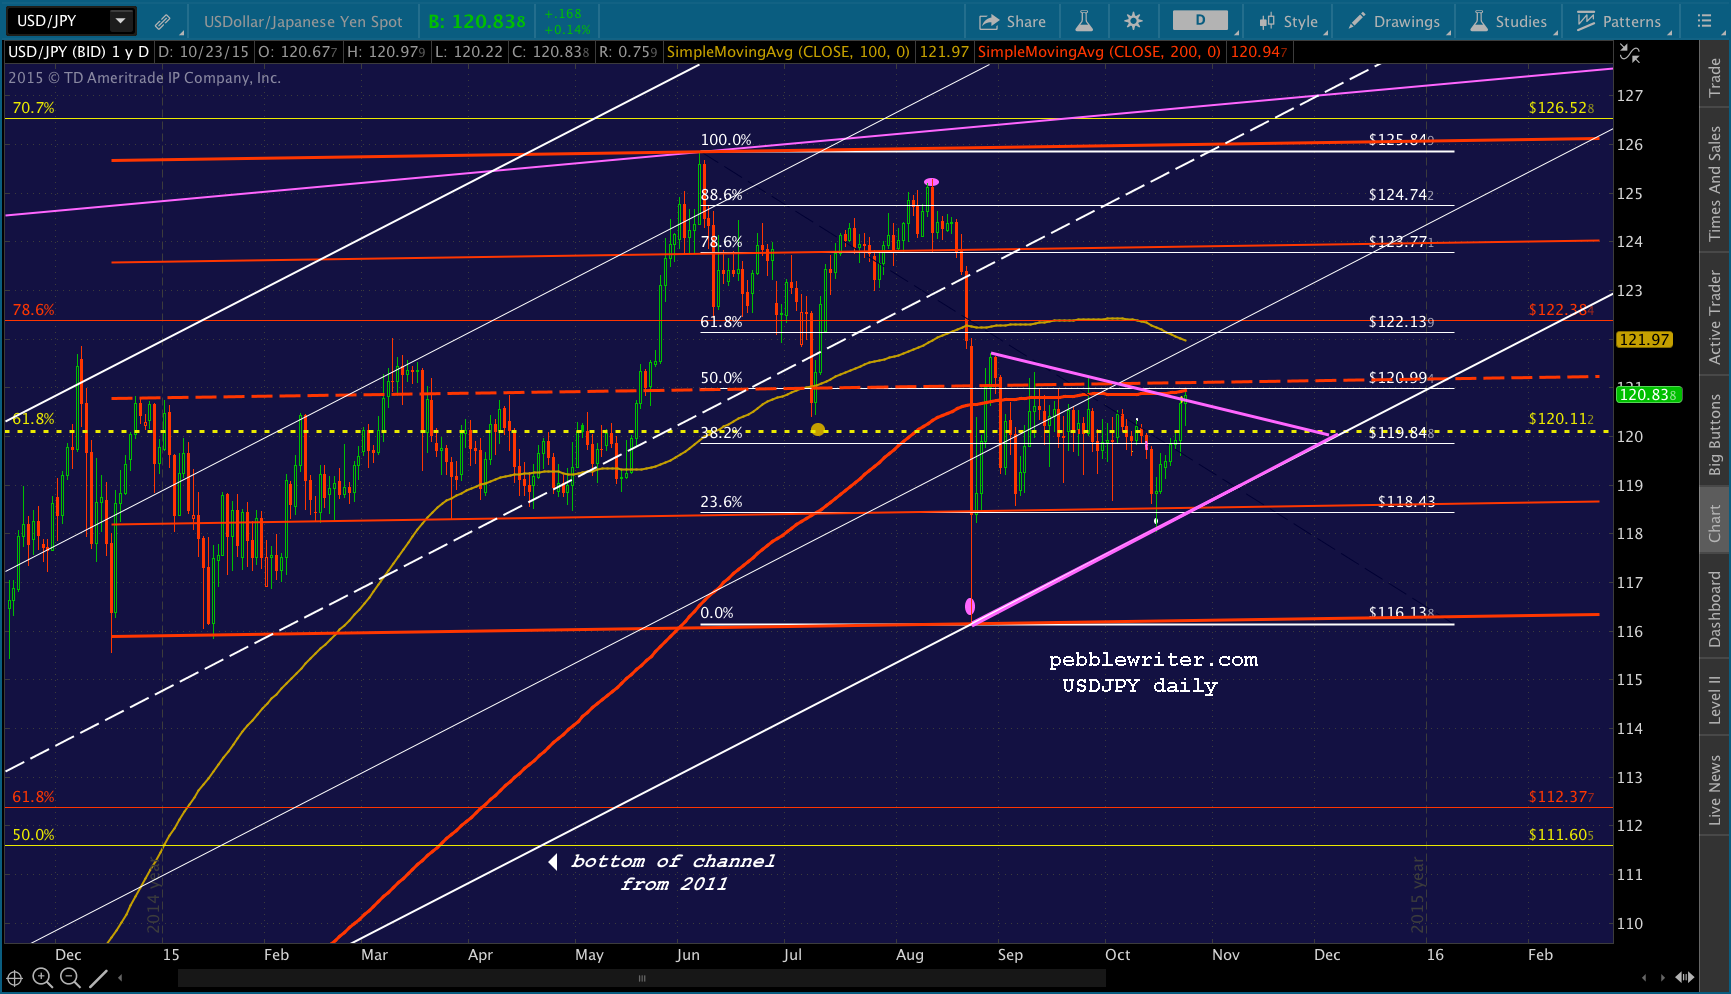
According to the principles of Fibonacci, financial instruments nearly always reverse upon reaching the .618 retracement — generally to at least the .500 and frequently to the .382 or .236 levels. A drop of that magnitude would have been a huge blow to the trillions of dollars tied to the price of the yen.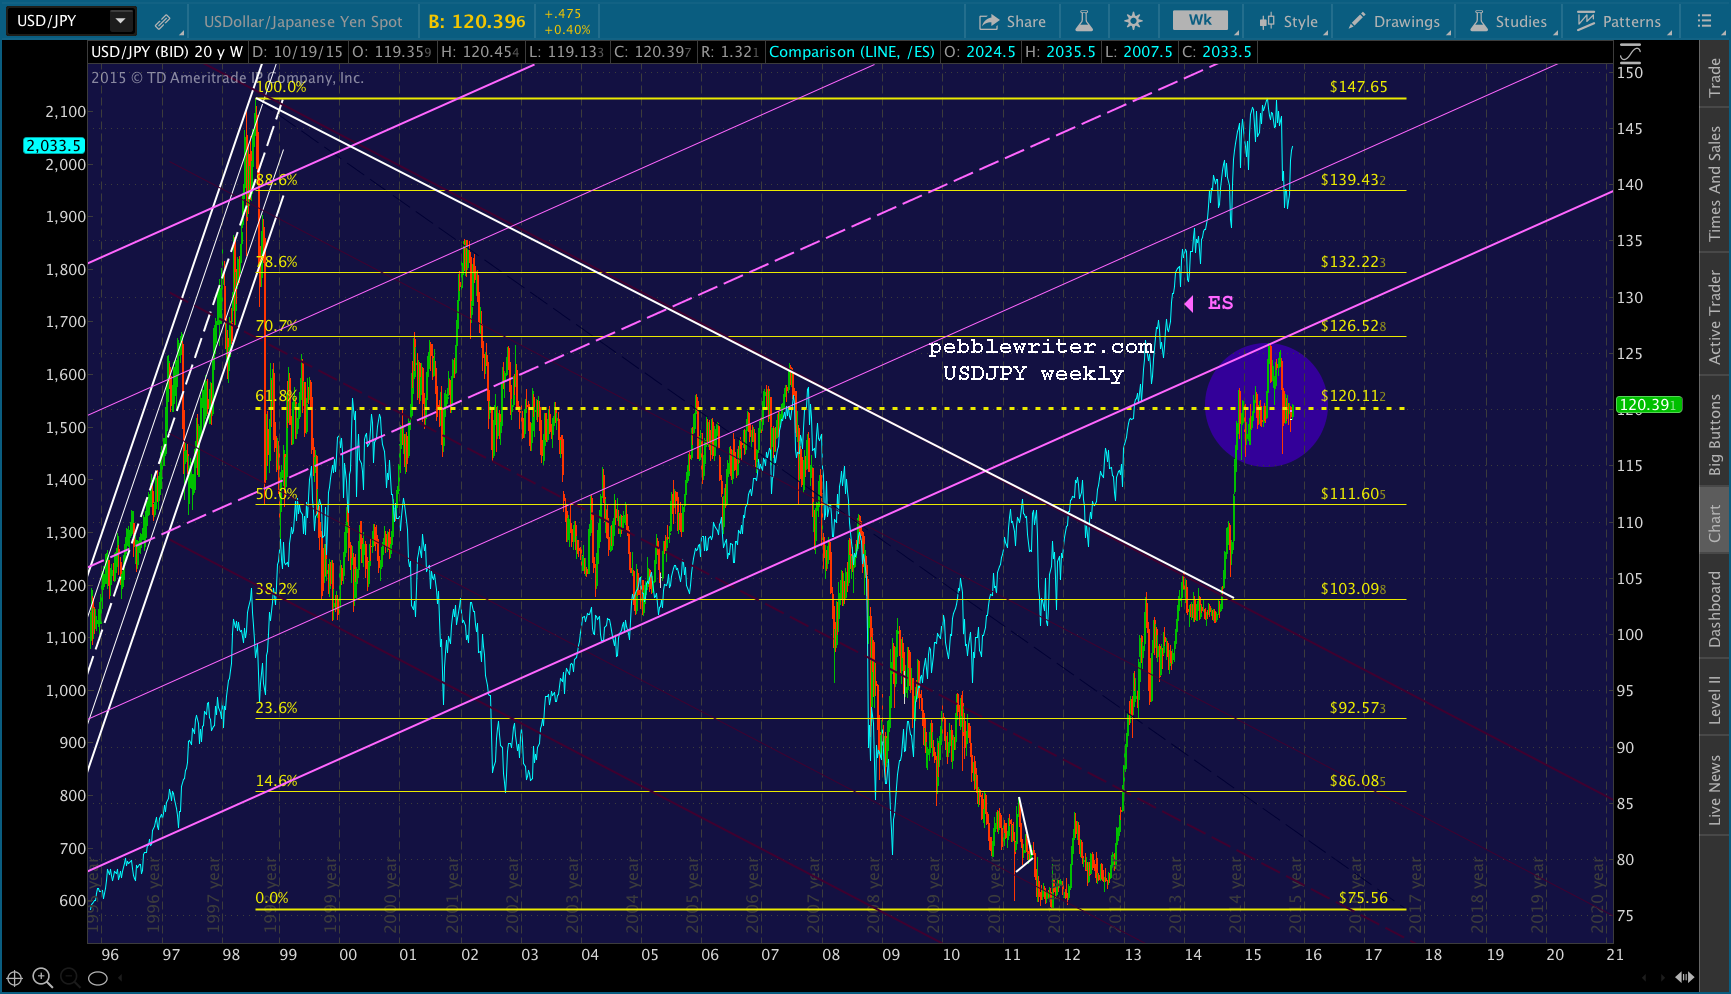 So, reaching the .618 at 120.11 was an important warning sign for investors. They began to pay a great deal of attention whenever USDJPY neared 120.11, reasoning that it was an important clue as to whether or not the yen would continue to weaken (USDJPY and stocks would rise) or strengthen (USDJPY and stocks would decline.)
USDJPY deserved all that attention. It tagged or crossed 120.11 a full 33% of the sessions between early December and mid-May. But, it managed to remain on an upward trajectory as shown by the red channel below. Stocks followed along, dipping when USDJPY tumbled toward or below 120.11 and rising when it rose above (or, even threatened to.) Everything went well until early June, when USDJPY finally backtested the huge rising purple channel (the white dot in the above chart.)
USDJPY shed 7.5% over the next two months, while SPX plunged over 12.5% — its biggest correction since the summer of 2011. It didn’t help that SPX, itself, had completed a huge Butterfly Pattern, reversing at its 1.618 extension; see: The Last Big Butterfly.]
The coincident corrections intensified interest in the yen carry trade. Even mainstream financial media began discussing the importance of 120 in the USDJPY. But, for those of us who’ve studied the yen carry trade, the events of August 2015 confirmed what we already knew:
- Want stocks to go up? Push USDJPY higher, preferably above 120.11.
- Want to allow stocks to decline? Stop propping up USDJPY.
It’s a simple set of rules with remarkably few caveats. It nearly always works. The trick, of course, is anticipating which way USDJPY is going and, when it’s about to reverse.
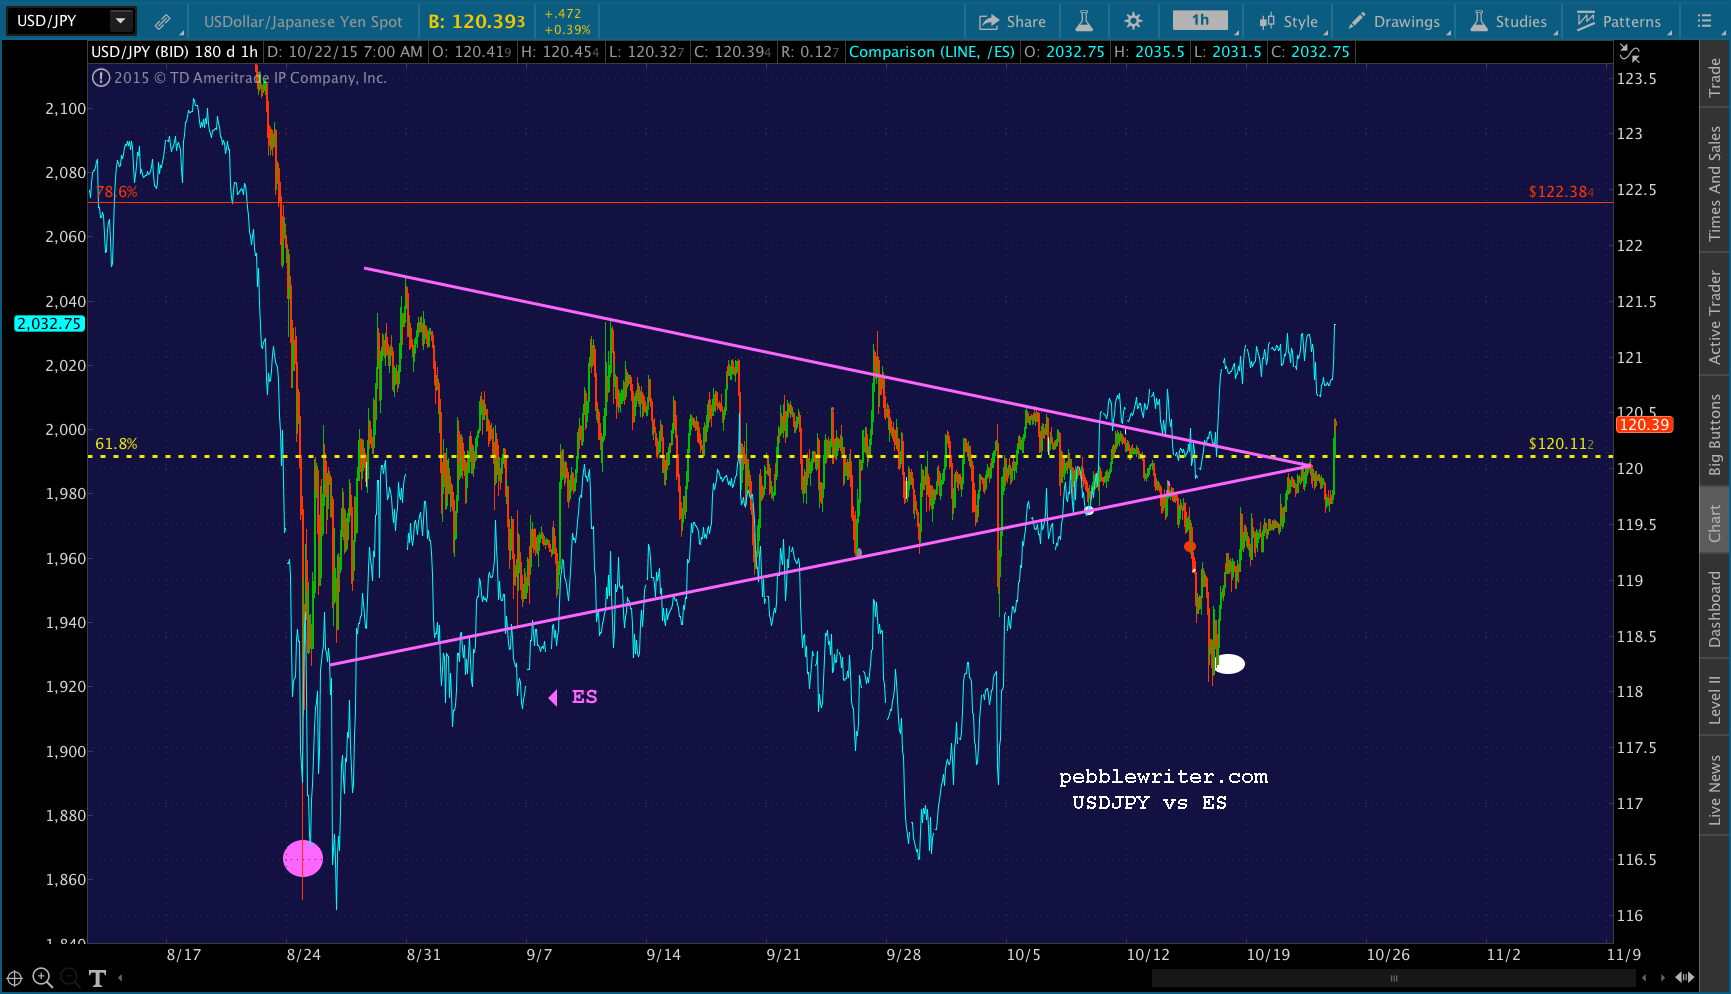
 Following the Aug 24 plunge, for instance, USDJPY bounced around quite a bit. It took a few days, but it soon became apparent that it was developing a narrowing triangle — a consolidation pattern. This made it possible to time long and short positions in the market fairly accurately.
The hourly chart below shows that ES reversed whenever USDJPY tagged the top or bottom of the pattern. The one notable exception was between Oct 13-20, when oil — following an 11% plunge — rallied almost 6% while USDJPY floundered.
 This brings up one of the most important caveats: the yen carry trade isn’t always in charge (just most of the time.) Crude light oil futures (CL) are frequently used to goose stocks higher. In fact, today was one of those days.
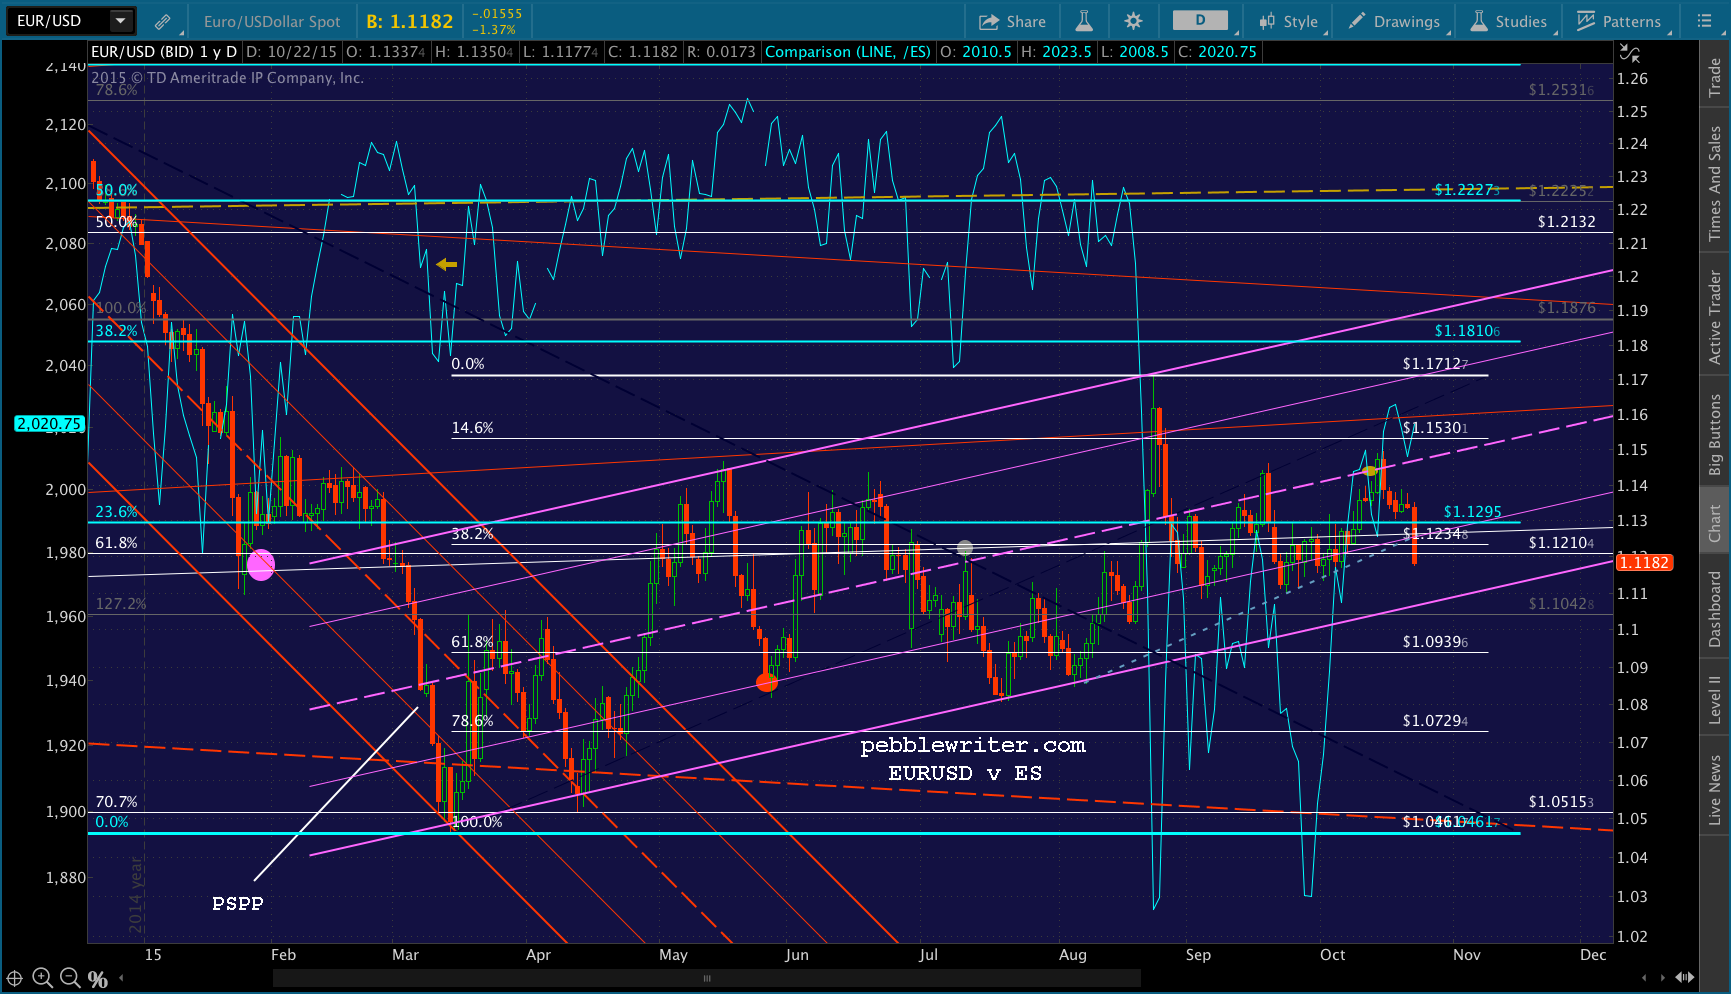
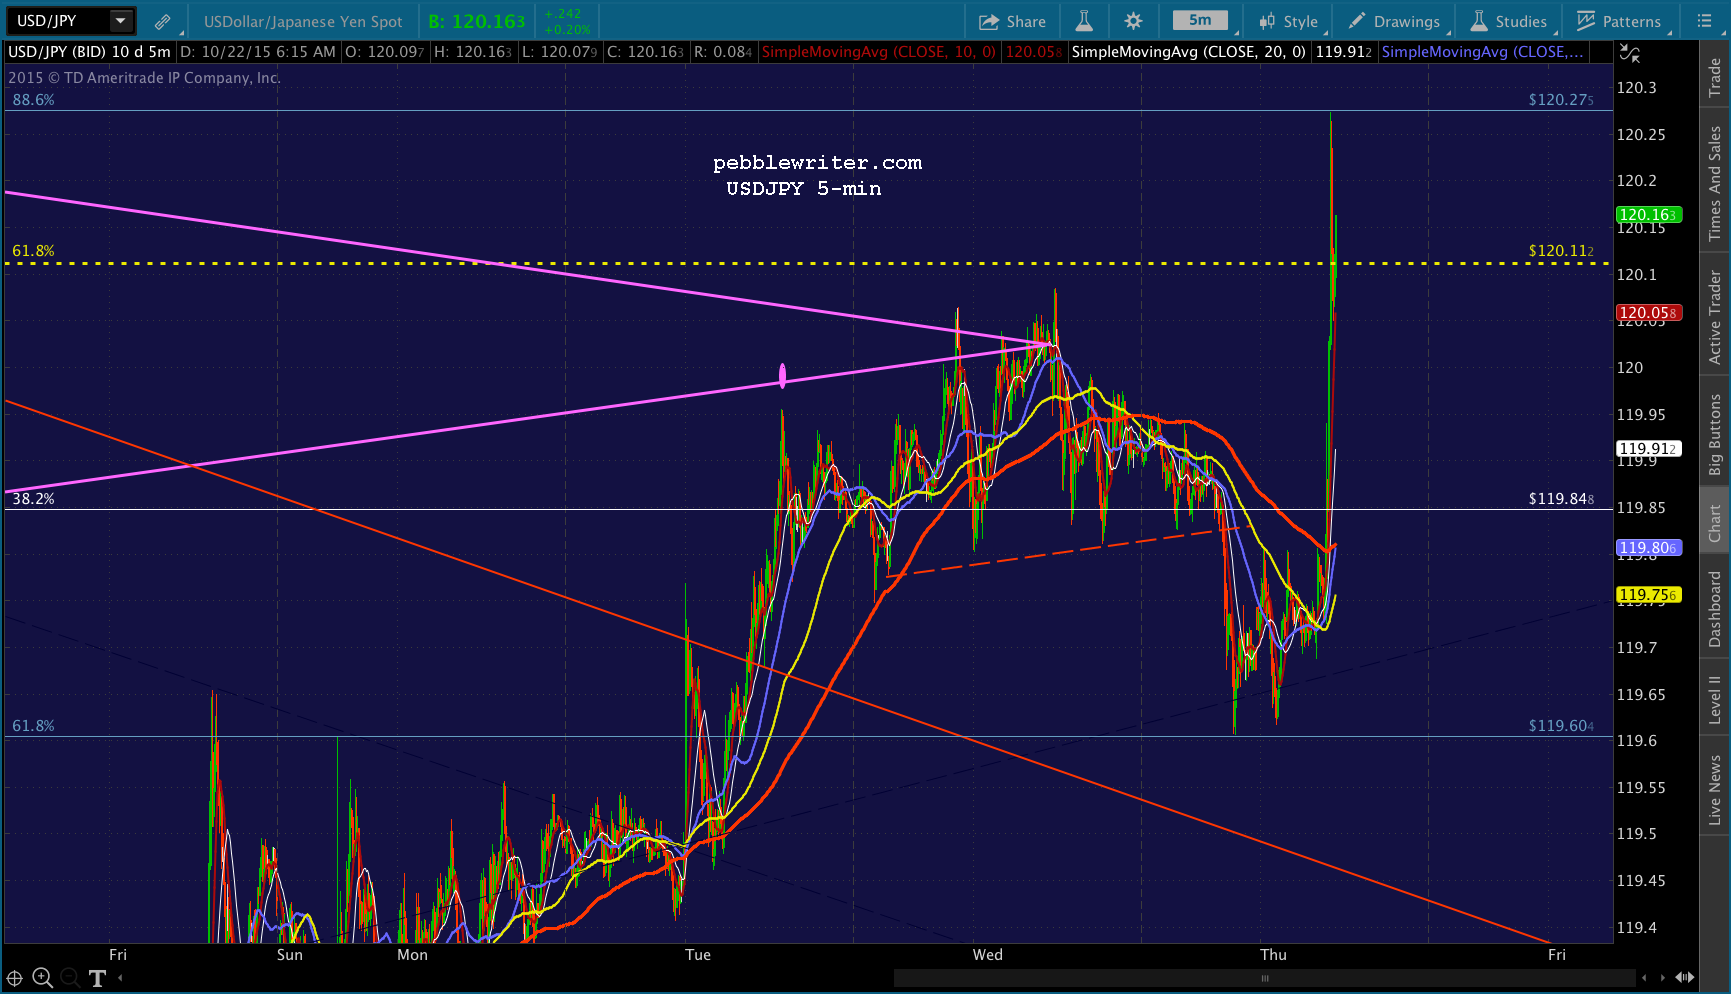
The chart below shows today’s action in USDJPY and ES minute-by-minute. Mario Draghi was announcing a continuation of PSPP (the ECB’s version of QE.) He had nothing new to say, but it was important that the “market” react positively in order to reaffirm the wisdom of the ECB’s actions.
USDJPY spiked the minute Draghi’s press conference started, rising from its overnight low of 119.61 to 120.33 by the time the cash markets opened. A 0.6% increase in one hour is a big move for currency pairs. But, the really bullish aspect of the move was that the pair sailed right through 120.11, backtested it, and continued soaring.
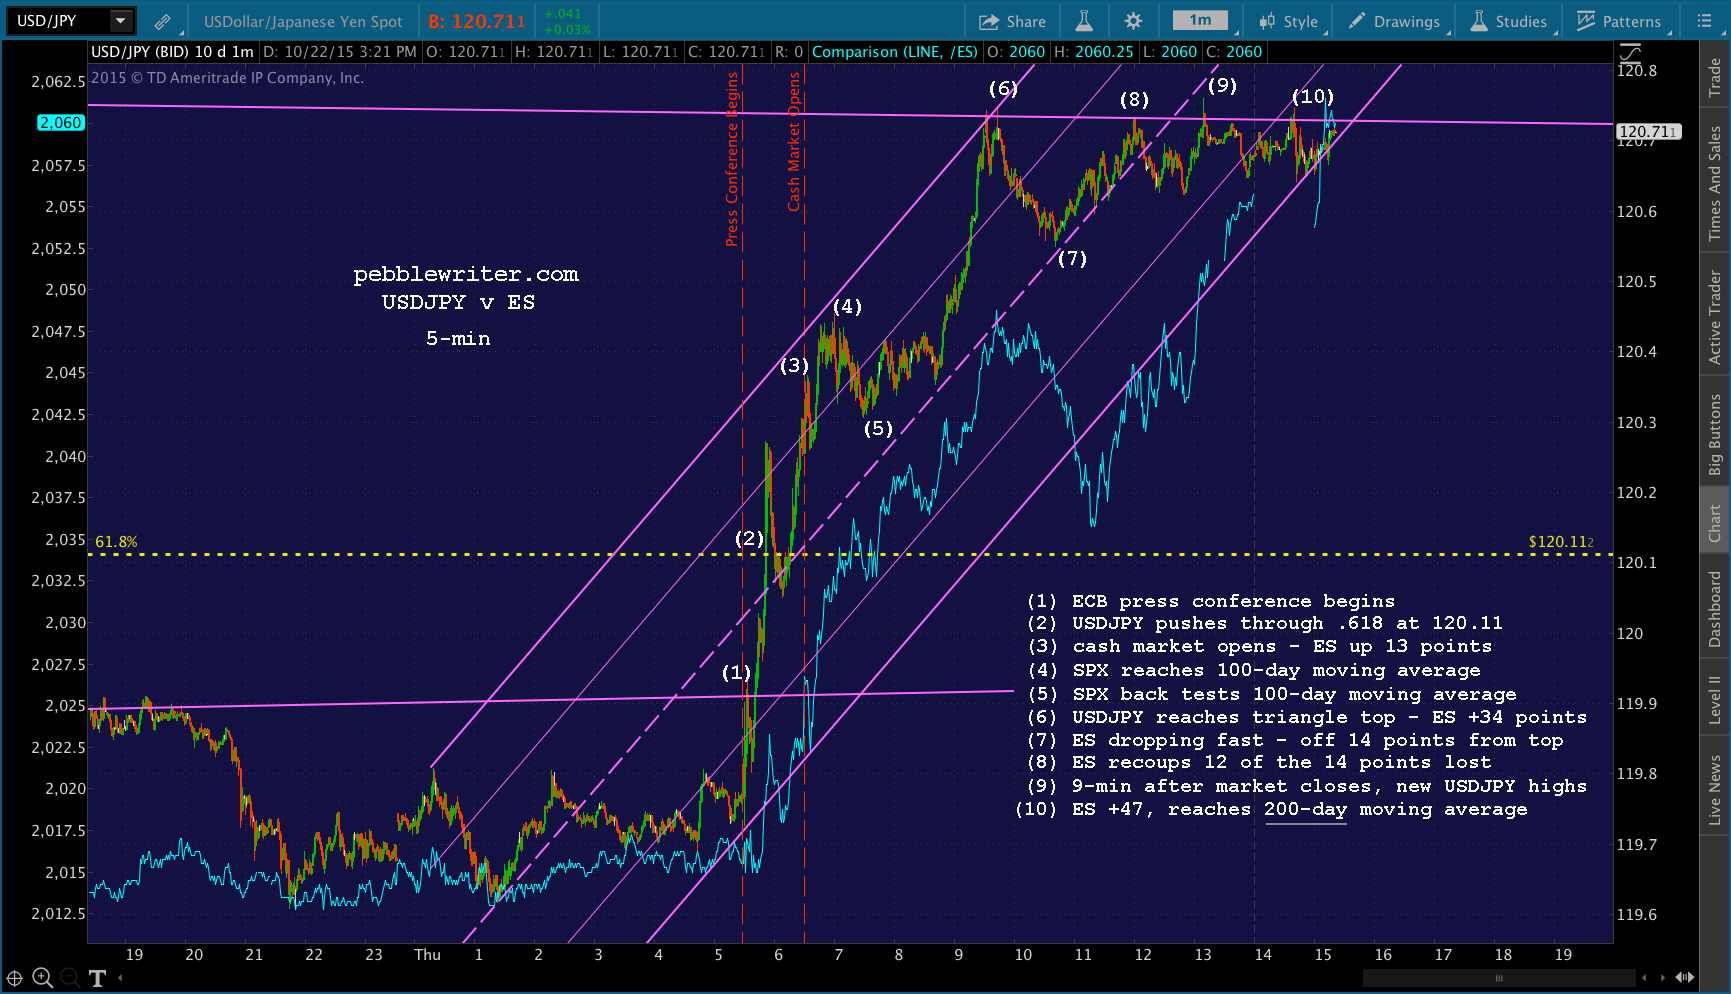 The S&P 500 futures were up 13 points from their overnight lows by the time the cash markets opened. Once SPX was open, it quickly surmounted its 100-day moving average. It didn’t stop until USDJPY ran into some important resistance — the top of its new, expanded triangle.
At that point, SPX and ES began falling rather precipitously. Having risen 34 points, ES quickly shed 14 of them before CL — which had plunged 2.6% since the market opened — suddenly sprung back to life. The algos loved this, and quickly forgave USDJPY’s decline.
 Of course, by then USDJPY had already started rebounding. Together, USDJPY and CL drove stocks higher through the close. SPX regained 12 of the 14 points it had lost and closed with a 33-pt gain (1.66%.) ES continued even higher after hours, tagging its 200-day moving average for good measure.
If you’ve read this far, I commend you. You now understand what drives markets better than 99% of all investors. If you already knew most of this, consider this article a friendly reminder of the degree to which a very small number of people control the so-called markets. And, they’re not about to give up.
The BoJ and GPIF’s equity holdings are equal to 15% of Japan’s GDP. Given that every 1% decline in the Nikkei costs them $6.7 billion, they are hopelessly trapped in an failed experiment of their own making.
For more, see: Japan’s Equity Trap


 I went on to vent about how the Dow is one of the least reliable indices to forecast using patterns and Fibs. It’s just too easily/heavily manipulated.