A reminder: our membership promotion is officially under way. Save over 50% on an annual membership that protects you against future price increases. It works out to about $3/day, not a bad price for some pretty terrific results. To sign up, CLICK HERE.
For those contemplating joining and wondering what a trading session is like, I’m going to open up today’s session to the public. Follow along and we’ll see how it turns out. So far, it’s looking like a better-than-average day.
* * * TODAY ONLY, OPEN ACCESS FOR NON-MEMBERS * * *
* * * * *
I spent much of yesterday afternoon bemoaning the constant nudges higher in USDJPY that prevented SPX from even tagging the most basic of all support levels — the 200-period moving average (SMA200) on the 5-min chart.
SPX was a given, but USDJPY just wouldn’t allow it — spurting back up into a rising channel every time SPX started to falter. I finally gave up on the backtest and suggested:
And, the 1900 mark would still be an option for tomorrow morning. That feels like more of a long shot, given how hard TPTB worked to get the averages back to green.
USDJPY has obviously been responsible, and is offering no clues to its next moves. But, a dip overnight would certainly make sense. If you can hedge overnight, a short position seems not too crazy.
Guess what? Given the wretched unemployment numbers just released, the rest of the world now realizes what we’ve maintained all along: there will be no rate increase in October — or any other month in 2015.
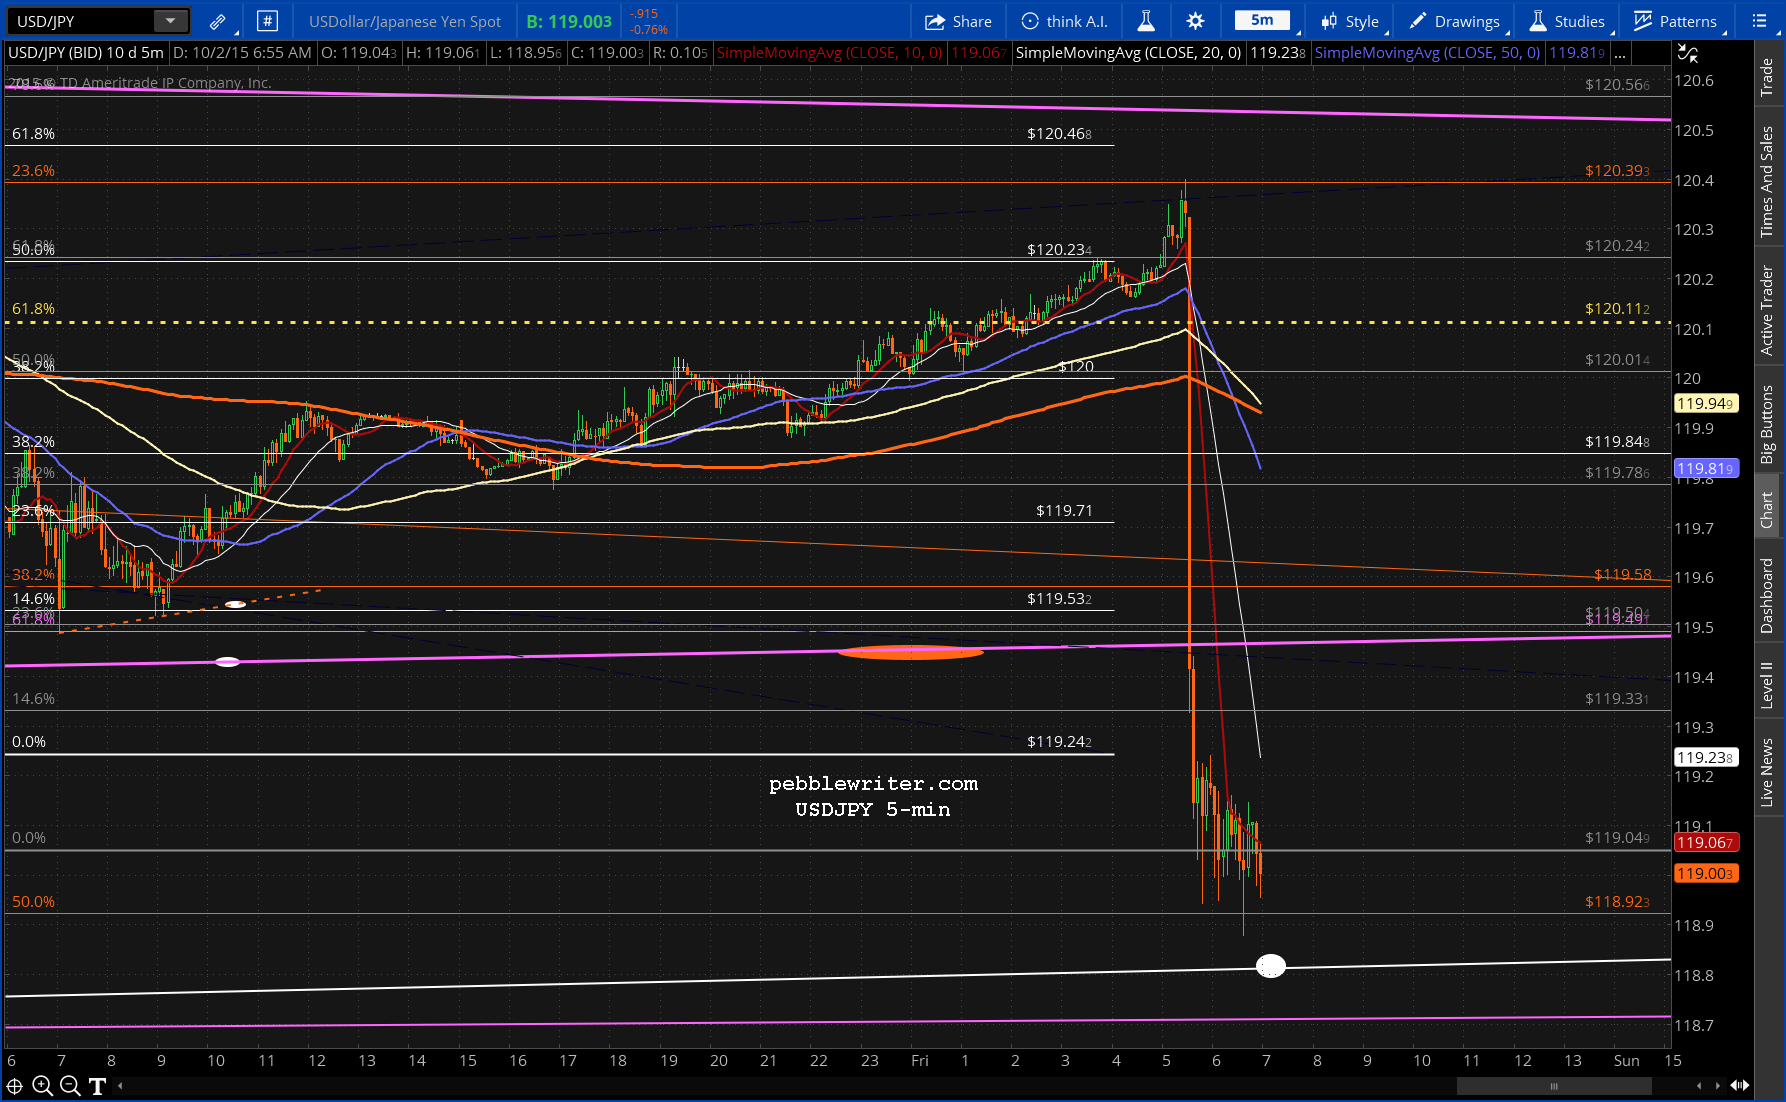
Needless to say, this was not positive for the dollar, which is cratering against the euro and the yen. I anticipated a drop to test the bottom of the Pennant Pattern (the red dot.) But, what we got was much, much more.
 Since the stock “market” lives and dies per the USDJPY’s direction, futures are currently off 29 points. It looks like we’ll get that SPX2000 tag after all!
Given that the USDJPY just suffered its biggest single decline since August 24, might we expect more?
continued for members...
Note that while the pennant is broken — at least for the moment — USDJPY is nearing channel support (the white line.)  It can be better seen on the daily chart — as can the purple channel bottom also in the vicinity. Though, I’ll readily admit that on a channel that’s so long (from 2011, in the case of the white channel) it’s hard to say exactly where the bottom is.
 Bottom line, look for USDJPY to grab onto these lifelines and prevent an even worse decline in stocks.
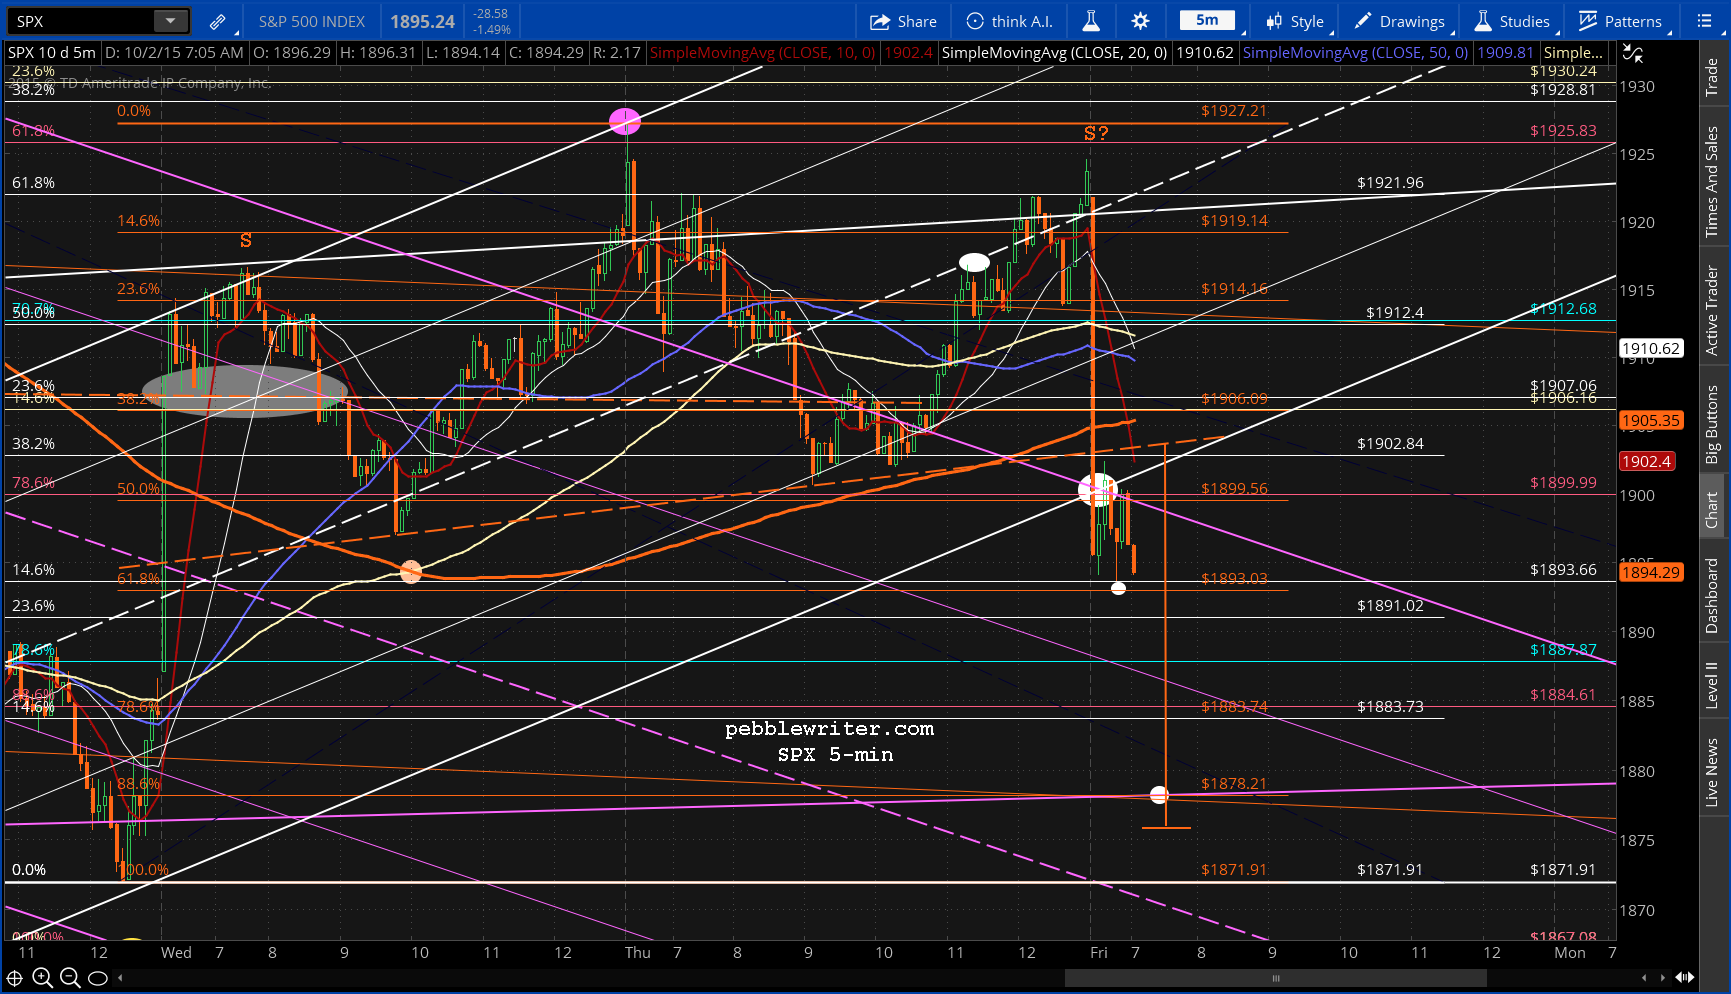
If they’re very clever about it, and start ramping ES and USDJPY as soon as the market opens, they might be able to hold SPX’s losses to that white dot at 1899. It’s important, because as we pointed out yesterday it’s also the neckline of a Head & Shoulder Pattern targeting 1875.
If 1899 doesn’t hold, then the red .618 at 1893 is the next most appealing initial target.
I think it’s going to be tough to hold, however. Consider how ES still has a long way to go in order to effect a decent retrace of the Aug 24 bounce. 1840 would make a lot of sense.
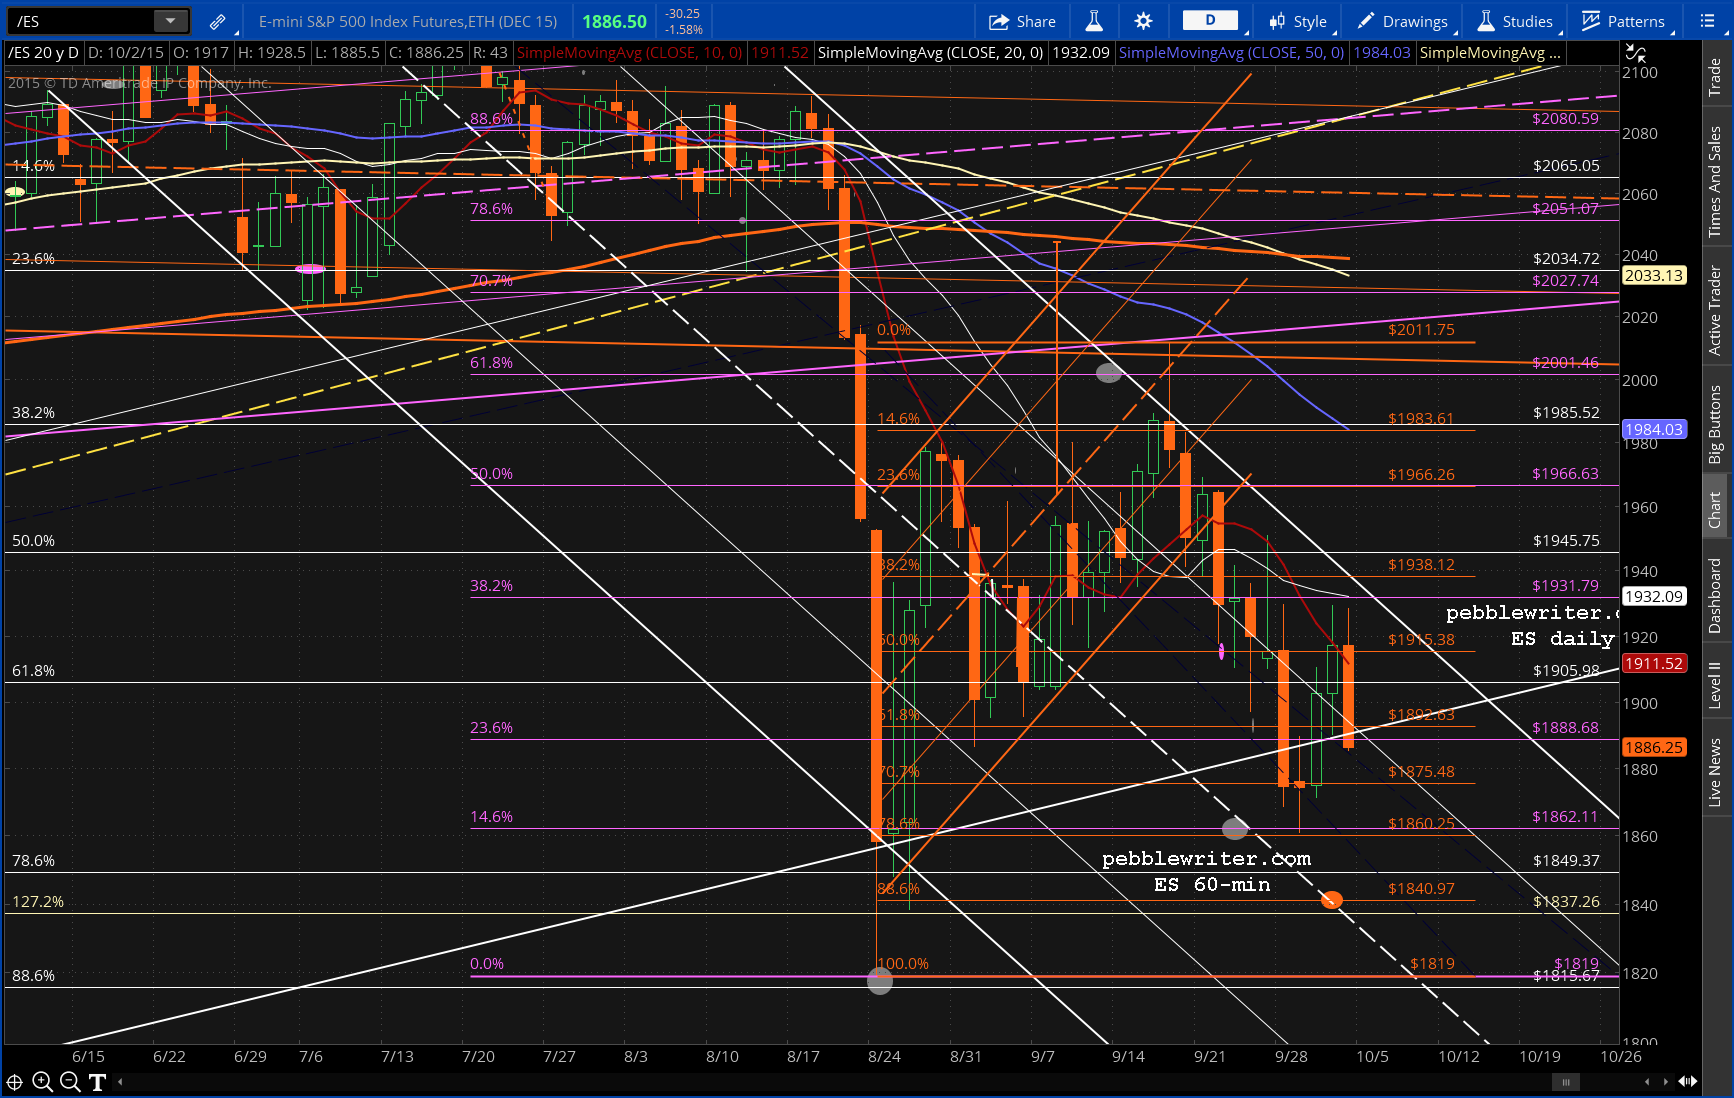 UPDATE: 9:34 AM
Getting some support here at 1898, but not enough that I’d want to jump in and buy. 1893 looks like a better opportunity, with 1878 as the ultimate target — one we’re not likely to hit today if USDJPY’s decline is halted at 118.85. For once, the selling pressure might just be too much for the carry trade to hold back. We’ll find out as USDJPY nears the white channel bottom.
 UPDATE: 9:36 AM
SPX just bounced at 1894.17, close enough. I’d be long here for a bounce back to the purple channel top, but watch for another push to actually tag 1893.03.
 UPDATE: 9:41 AM
Got the bounce. I’d look to short here at 1899.44 for 1893.
 If I’m early, the other target is the neckline at 1902.84.
UPDATE: 9:55 AM
Everything’s back under control. Reached 1893.70, but they’re having trouble pushing it just a little lower. USDJPY and CL still being forced lower, so should get there — maybe even a headfake overshoot. USDJPY still edging lower…
 UPDATE: 10:01 AM
That’s the problem with made to order “markets.” When, USDJPY slows down, everybody knows a bottom is forthcoming. And, no one wants to be the sucker to sell 30 cents above it. Now, USDJPY will need to overshoot the bottom if they want SPX to tag 1893.03.
 If they can’t do it on this try, they’ll probably give up and wait for the SMAs to catch up and force it lower.
UPDATE: 10:07 AM
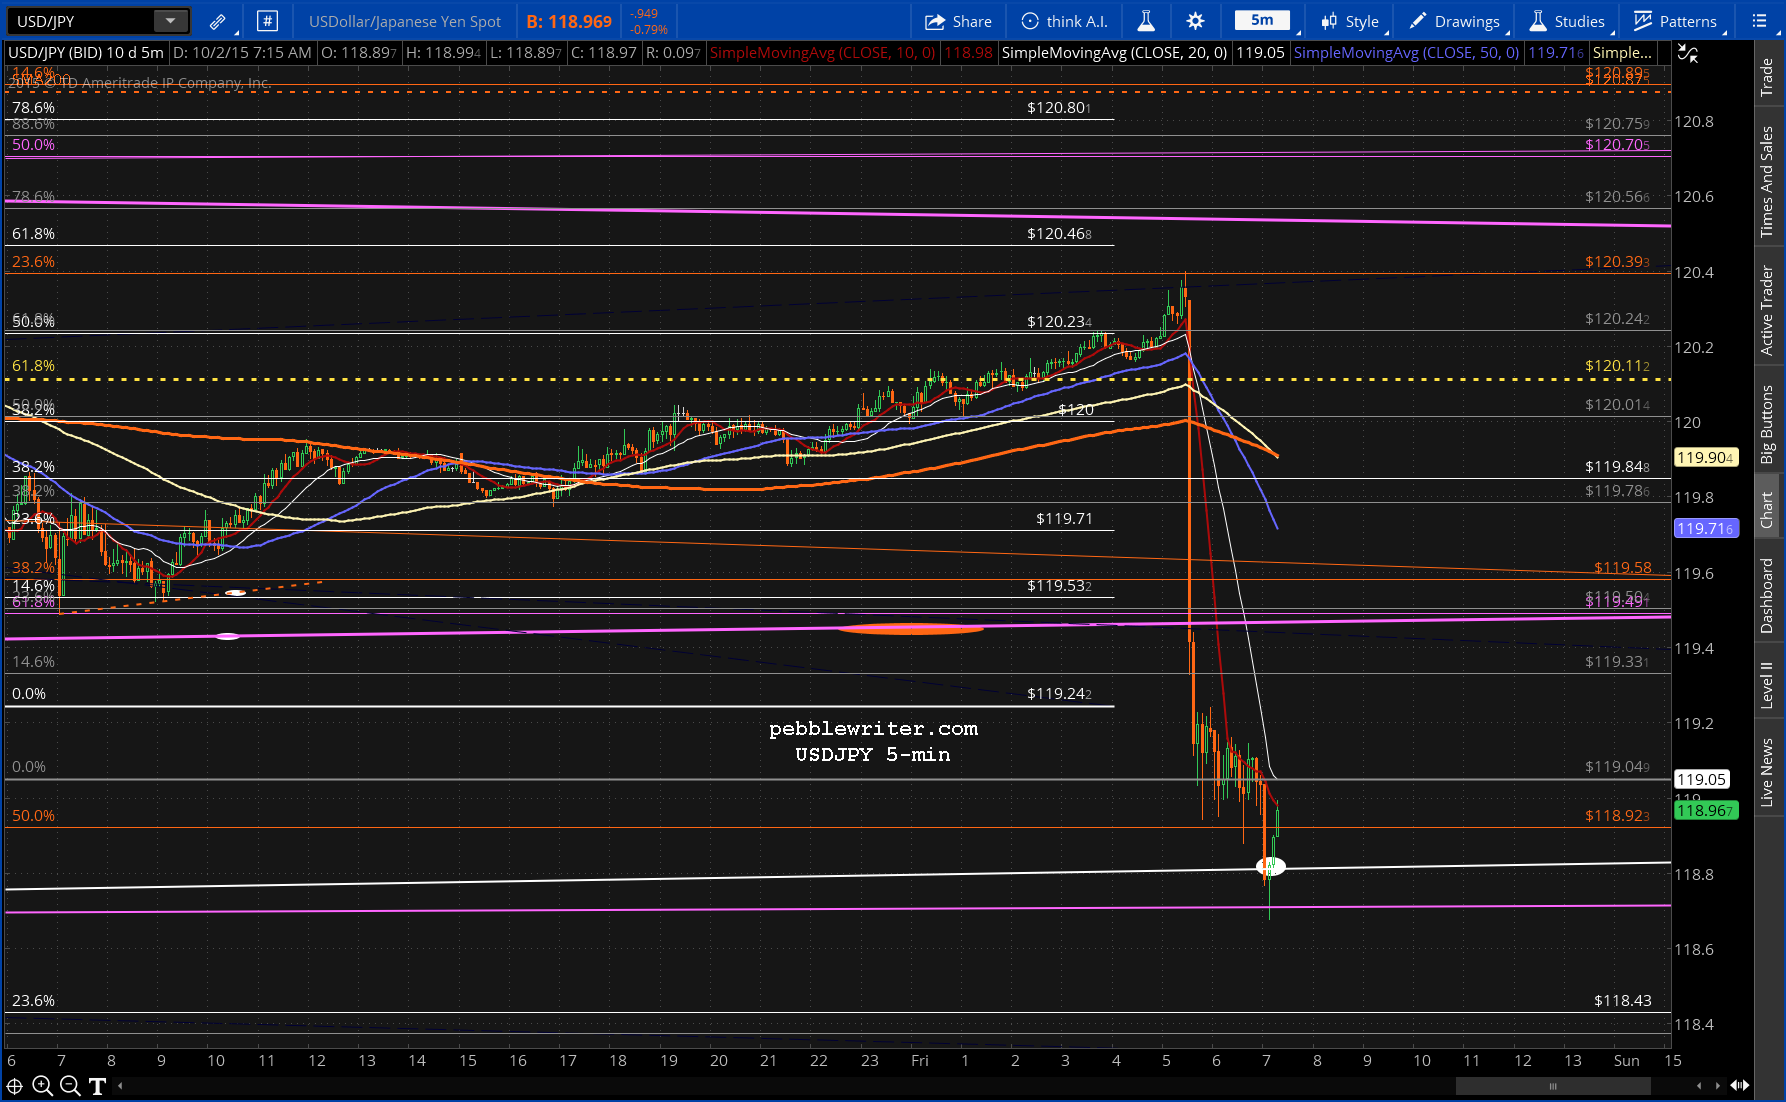
USDJPY just reached the purple channel bottom as well. Should get a bounce any second. 
If you don’t care about getting the exact bottom, this should work for an entry. One more (potential) point of downside isn’t worth the risk of a sudden spike higher.
 Just be aware that the 5-min SMA10 is approaching, and it sometimes exerts additional downward pressure. Set your stops accordingly. It wouldn’t be a bottom without a headfake or two.
Note that CL is getting into the act, pushing down — if even temporarily — below a key channel midline. This suggests the downside isn’t done, but no guarantee it’ll be effective.
 UPDATE: 10:16 AM
SPX back to the neckline and backtesting the SMA200 as USDJPY’s SMA10 catching up to it. Last chance (for now) for a push lower.

 If it retreats from the neckline, I’d consider another short position — but, only if USDJPY and CL support it. And, at present, they’re not. They’re both hanging around their SMA10s and going sideways. And, SPX is back out of the purple channel — which can be considered a bullish backtest if it holds. Next test for SPX is the SMA200 at 1905.65 — just beyond the neckline.
We’ll see how it does when USDJPY’s SMA200 arrives on the scene — which is about 1 minute from now. A rally in USDJPY would require a bullish SMA10/20 cross. And, that’s obviously easier to effect when the SMA20 is nearby.
UPDATE: 11:02 AM
SPX just tagged a red channel line and should take a breather here to let the SMAs catch up. Could be worth shorting, but probably not more than a backtest of the SMA200, and it could be as little as a few points to the SMA100. The .236 at 1914.16 is probably the better place. UPDATE: 11:07 AM
That’s better. I’d try a little short position here at 1914.98 and see what develops. ES and NKD are suggesting it won’t be huge — perhaps 1907-1910.
I’d look, first, for the intersection of the 10, 50 and 100-periods SMAs coming up at around 1910.43. And, if that fails, the SMA200 at 1906.65. UPDATE: 11:20 AM
That should do it. Back to long here at 1910.02.
 UPDATE: 11:38 AM
SPX taking a breather, waiting for the SMA10 to come along. It should be a good guide for stops.
 From here on, SPX’s goal is 1927.22, to bust the H&S Pattern by establishing a higher high. The narrative must be changed from the failing carry trade to the probability of easier money from the Fed.
UPDATE: 11:50 AM
This is that time of day when things get kinda muddled. We’re waiting for the SMA20 to catch up, USDJPY just ran into its SMA50, the channel is in danger of breaking down. It’s a good place to tighten up stops.
I don’t advise specific numbers, but go with what’s comfortable for you and your style of investing. We’re up 30 points from our long entry, closer to 60 (+3.1%) if you held short overnight.
That’s a very good day, and not one you’d want to flush down the toilet if this turns into a Bat Pattern and goes to 1878. I don’t think it will, at least not at this point. But, you never know. Nothing wrong with going to cash here and taking the rest of the day off. UPDATE: 12:01 PM
The problem with pushing higher at this point is USDJPY, which is about to run into the broken Pennant bottom. If it has trouble pushing through, or hesitates much, stocks will get nervous and start selling off.
Of course, USDJPY is completely and tightly controlled. But, the keepers of the pair might wish to engineer another leg down and use this as a pretext. I’m going to step aside here at 1913.9, and go to cash until it’s resolved.
 UPDATE: 12:09 PM
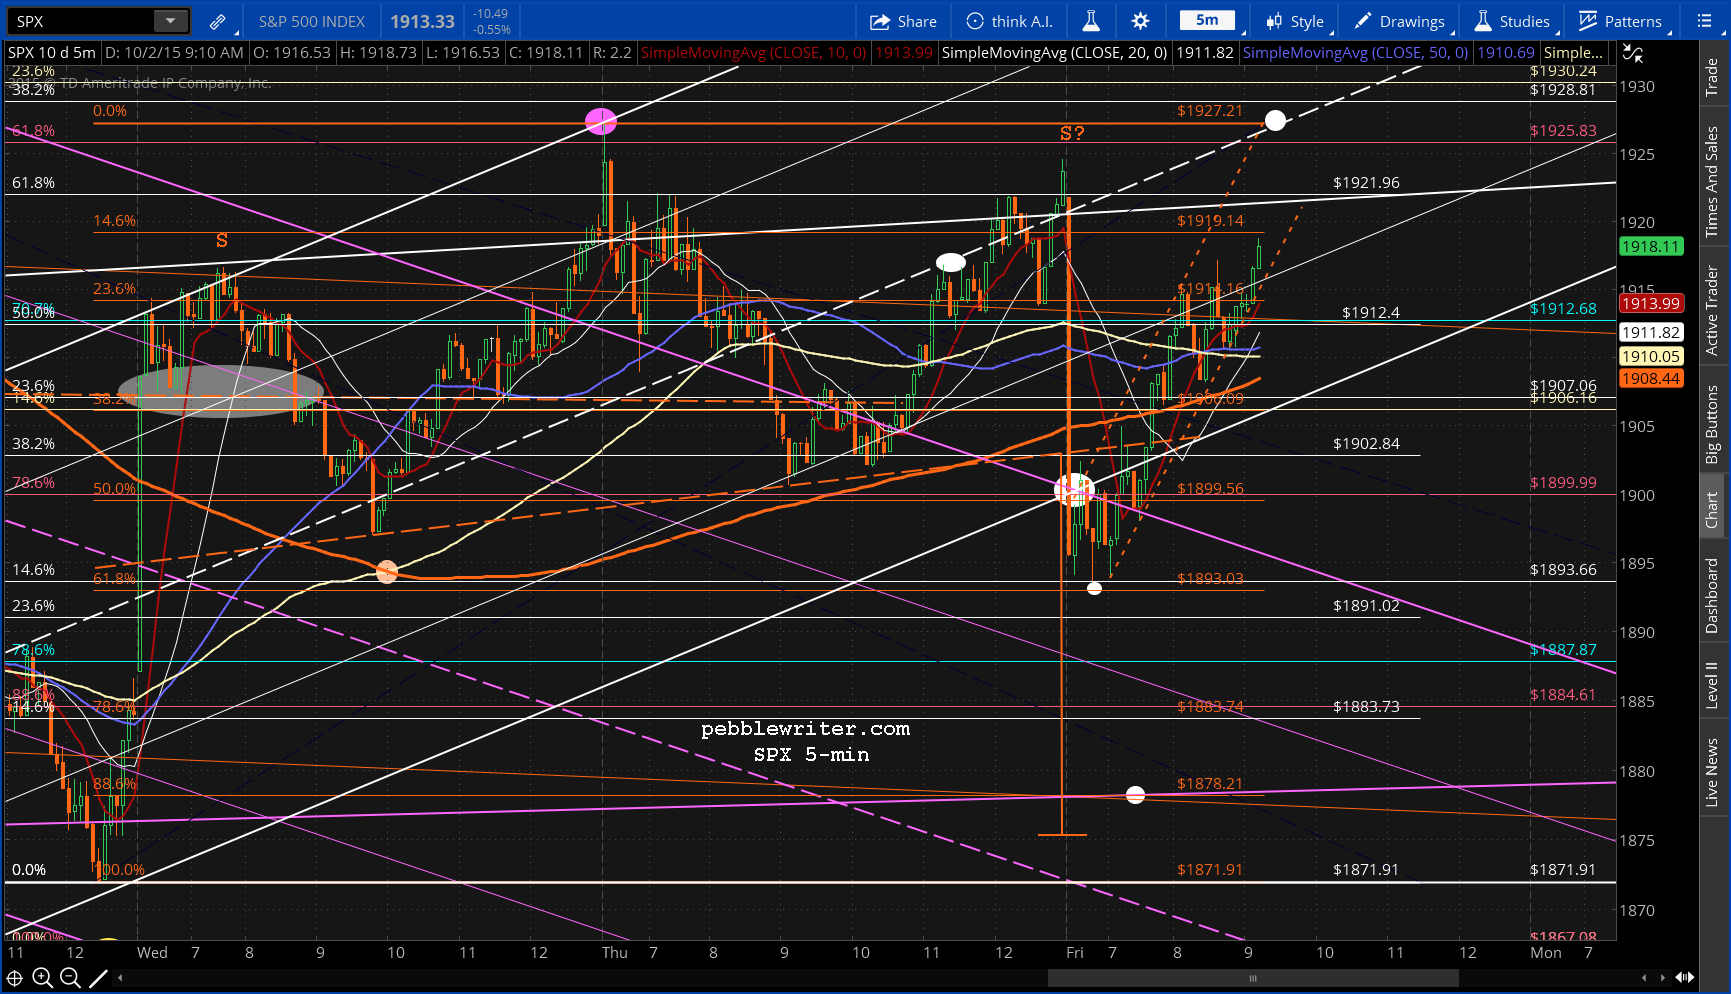
  Do or die time for USDJPY, which just pushed through the Pennant bottom – perhaps to get SPX to the red .146 at 1919. If it retreats, look for SPX to follow along. In other words, a potentially good shorting opportunity coming up.
 UPDATE: 12:16 PM
Jumping in on the short side here at 1920.96. If it plays out, should be good for at least 5-6 points. Note this is also the underside of the broken white channel from Aug 24…
 …and, ES just reached its .618 retracement of last night’s highs.
 Look for USDJPY to backtest the Pennant bottom.
 Our 1927.22 target is just overhead, so tight stops are a very good idea.
UPDATE: 12:31 PM
Stopped out on that position and going long again with a target of 1927.22.
 UPDATE: 12:33 PM
Nice initial push. Should take profits here at 1926 or wait for secondary push later in the session. Should settle back and gather strength here.
I wouldn’t short just yet, as the typical MO is to wander sideways, with lots of random HFT-induced headfakes throughout the day, and finish the day at the highs. 1917.92 is a good target, as are the rising SMA100 and SMA200.
 UPDATE: 12:57 PM
And, just like that, yesterday’s high is broken, the downside patterns are invalidated, and SPX is green. Shorting again here at 1929.59. Tight stops, please.
Note, we’ve tagged the white .382 at 1928.81. And, that very hard to see .618 at 1924.52 is a natural rebound for a Bat Pattern such as the one completed on Tuesday. And, ES just reached the .786. UPDATE: 1:24 PM
Could get a bounce here if the midline is defended. Best to dump the short here unless it pushes through. The algos loathe giving up “hard-earned” gains, and the SMA20 at 1943.71 could be on this afternoon’s agenda.
 Based on Friday’s highs, I might have drawn the falling red channel too low. The midline might be closer to 1943 which, along with the .886 Fib at 1943.66, is a very appealing target. Why not take advantage of some pretty impressive momentum to bag them now?
UPDATE: 1:43 PM
Getting a backtest of the SMA20 and the daily SMA10 here. Believe I’d close the short position and call it a day. Would consider reopening it with a push through the 1925.38, and would take on a long position with a push up through 1935.66.
 UPDATE: 2:17 PM
All dressed up and nowhere to go. SPX still doing the crab walk… …waiting for USDJPY to make up its mind. The key Fib level of 120.11 is just overhead. And, the promise of 120.11 is enough to keep stocks in the green. If they tag it, there will be all sorts of expectations/complications.
 If they break the red channel, however, we’ll get some downside — even if it’s only a little. 4:00 is a long, long two hours away.
I suspect they’ll let USDJPY/SPX drift lower and pick up support from the rising SMA50 at 1921ish (blue dot) or the daily SMA10 at 1925.38 (white dot.)
Stay tuned.
UPDATE: 2:59 PM
SPX dipping below the channel midline at 1932.32. Theoretical shorting opportunity for anyone who isn’t exhausted from this morning. Should be good for 5-10 points.  USDJPY stuck going sideways, could still break either way. So, if you play it, use tight stops.
  UPDATE: 3:09 PM
And, right back to the upside resistance. The red channel line is around 1937.10 here. If it’s broken, then 1943.66 should prove an attractive target — even if in the last 60 seconds. But, this is silly time here. Why spoil a great day? I’m happy watching it without playing it.  UPDATE: 3:29 PM
There’s the .886/SMA20/channel tag we talked about in the 1:24 update. Anyone who played this breakout should consider closing it here and getting started on your weekend.
 If you’re a greedy bastard and aren’t satisfied with the 50 points since this morning’s call to go long, at least tighten up your stops.
If you’re feel incredibly lucky and want to temp fate, try shorting here into the close (1934-1939?) But, if anyone asks, I didn’t say that.
EPILOGUE:
Pretty incredible day. In all my looking around on the web over the past hour, I can hardly find anyone talking about USDJPY and the huge impact it had on the markets today — let alone its bounce at 10am at a critical support level.
In all, I show us scoring 70.39 points from last night’s close for a total of +3.69% in our theoretical SPX portfolio. If you didn’t hold short overnight, it still amounts to 54.16 points for +2.85%. Neither is shabby for an unleveraged, well diversified approach.
At +4.2% for the first two days in October, I might take tomorrow off. But, I won’t. Lots of charts to update after today.
For those who aren’t pebblewriter.com regulars, I wish I could say every day is like this. This is probably the second best day we’ve had all year, falling short of Aug 25th’s +4.8%. But, it’s just plain fun to produce gains when the market is tanking and the world is going haywire.
Whether it’s my service or someone else’s, I encourage investors to embrace both bullish and bearish markets. In a volatile, go-nowhere market such as we’ve had since USDJPY flatlined in December, it affords opportunities to make money regardless of what’s going on.
Have a great weekend everyone.
P.S. I hope to get September’s results posted this afternoon.


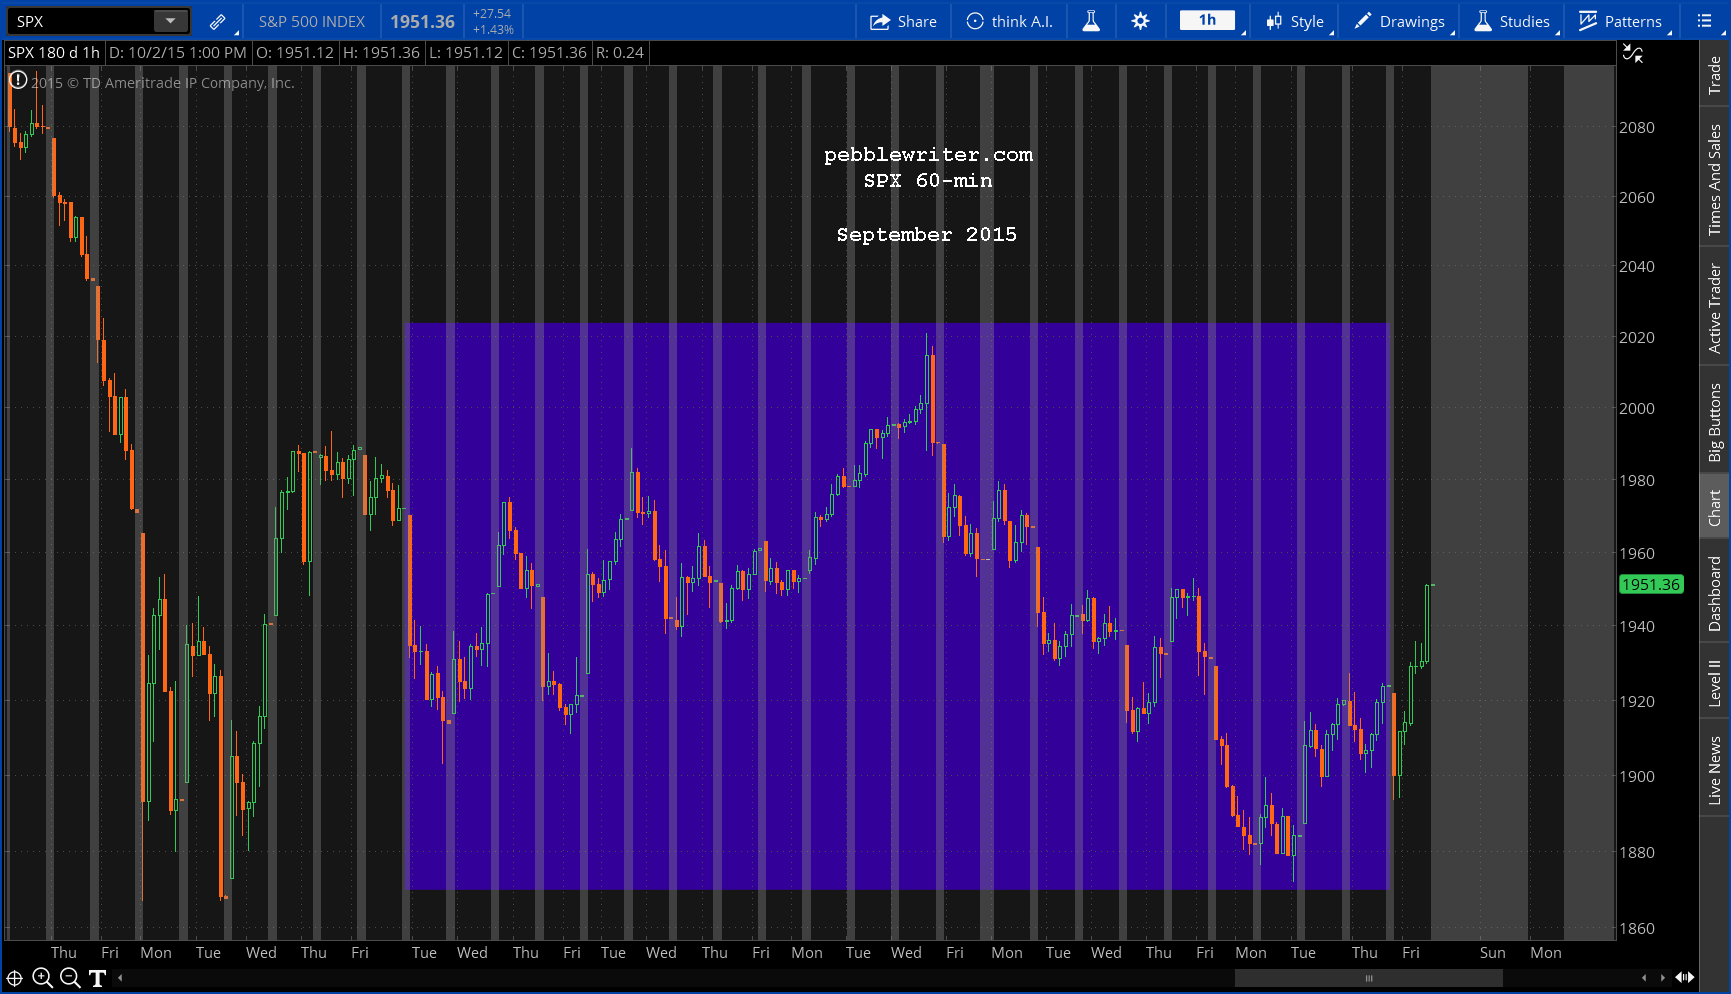
 …but, the 60-min chart provides a much better sense of the crazy, intra-day swings as well as the gaps up and down at nearly every opening bell.
 This led to more frequent trading than I’d like. But, the results were positive. So, we’ll take the bad with the good, and pray for more trending markets going forward.
 In fact, 17 of the 21 gapped higher or lower by at least 10 points at the bell. And, trends were very hard to come by — with huge gaps lower one day frequently followed by sizable gaps higher the following day.
 The graph above depicts the daily range and whether the day was positive or negative. It shows pretty clearly the unbelievably high whipsaw quotient for the month.
 By bouncing back and forth between the upper and lower bounds, USDJPY guaranteed that stocks would also bounce back and forth — making big moves with lots of volatility, but no net gains.
 Drilling down into our daily activity, about half of our gains were from moves that were less than five points. These accounted, however, for only 1/8th of our monthly return. So, eliminating some of these would be a desirable trade off. I think it’s safe to say that most folks would have been fine with a 31% month involving half the number of trades.

