Month: October 2015

  • BoJ Balks

    Last Halloween, the BoJ treated the “markets” with an enormous increase in QQE that sent USDJPY soaring 15% over the next few months.  Thanks to the magic of the yen carry trade, it stopped the October meltdown dead in its tracks and enabled stocks to reach new all-time highs.2015-10-30 USDJPY v ES daily 0615Last night, with most pundits expecting a repeat performance, Kuroda & Co balked.  No increase in purchases.  No expansion of allowable investments. No new fuel for the carry trade fire. Nothing.

    USDJPY, predictably, fell back below the SMA200.  2015-10-30 USDJPY60 0615Just as importantly, DX fell back within its falling channel.2015-10-30 DX 60 0615 About the only thing propping up stocks this morning is good old-fashioned currency manipulation.  That’s right.  The BoJ didn’t discontinue that!

    While QQE certainly supports a cheaper yen, and the BoJ’s direct purchases of stocks (which will continue as before) obviously prop up the “markets,” it’s the act of manipulating the USDJPY higher that has enabled the yen carry trade’s success.

    It has, can, and will continue to be utilized to push stocks higher and prevent dips whenever they see fit.  The only question is whether the rest of the carry trade investing world will stay the course given last night’s inaction by the BoJ.

    We’re talking trillions of dollars around the world that are directly and indirectly tied to a ever-cheaper yen.  Right now, some of those investors are quaking in their shoes.  The risk is a tsunami that even the highest seawall can’t contain.

    continued for members(more…)

  • How to Turn $27 Million into $8 Billion

    arrowSometimes USDJPY isn’t up to the task of levitating the “market” all by itself.  Take yesterday, for example.  It had already ramped as high as it could in order to convince muppets that, by maintaining ZIRP,  Yellen & Co. weren’t at all nervous about the recovery.  In fact, they are really, really confident that things are improving.

    So, this morning, with USDJPY already pegged at the top of the speedometer, it was up to CL to do the ramping.  With the futures off 12 points, CL started climbing off the 45.25 floor at which it had been propped up overnight.

    Between 8:25 and 9:00am, CL spiked nearly 3% — the equivalent of 60 points on the S&P500 or 500 on the Dow.  There was no news in the oil market, just a slight miss in initial claims and GDP.  It was enough to reduce the ES’ loss to about 7 points.2015-10-29  CL 1 1021Apparently, that was enough.  Because CL was allowed to settle back down over the next 30 minutes, until the “market” opened.  At that point, it was off to the races again — only 2% this time.
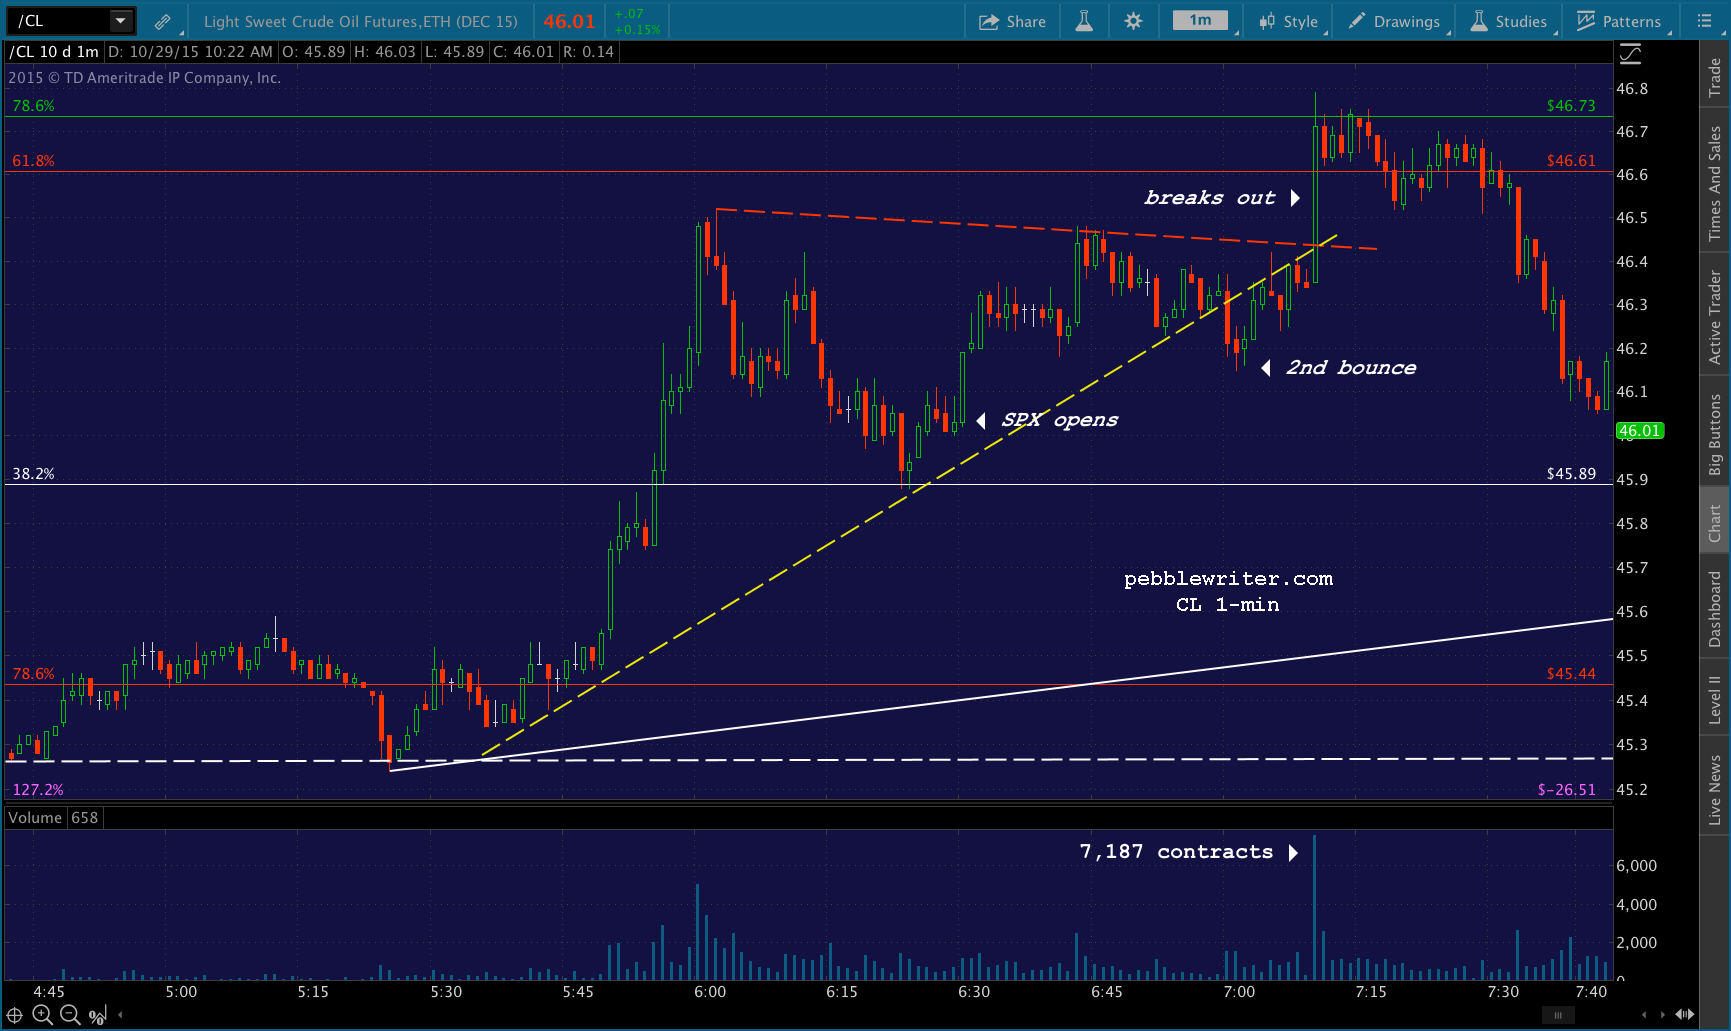
    The effect was to limit SPX’s initial decline on the open: a drop of only 6 points to 2084.12.  From there, it bounced a bit, then resumed falling for the obvious target — a backtest of the .786 Fib it had topped the day before.  This drop was supported by CL, which had broken down below the trend line off the morning’s lows (yellow, dashed in the chart above.)

    But, a funny thing happened when SPX reached 2084.14 — 2 pennies above the initial low.  CL suddenly reversed.  In fact, it reversed back through the broken red TL, back through the red TL, and all the way up to the highs of the day.

    Naturally, SPX stopped falling, and bounced back to test the previous day’s highs.  It was the last 1-min candle that caught my attention. 2015-10-29 SPX 1 1021The 1-min bar at 10:10 spiked a sudden 1.07 points — the equivalent of .0512%.  It’s not all that much, but it nearly resulted in new highs for SPX.  And, in dollar terms, it represented a $8.7 billion increase in the market cap of the S&P 500.

    I got to wondering, what was it that suddenly boosted the value of the S&P 500 by $8.7 billion?

    The answer is in the CL chart above.  In that one, single minute at 10:10 AM, CL suddenly shot higher by 0.45.

    Not to wear out the analogy, but that’s the equivalent of 20 SPX points or 170 Dow points.  That’s a pretty big move in one minute.  How was it accomplished?

    At 10:10, the total volume of CL traded on NYMEX was 7,187 contracts.  If, say, 80% of that volume was in service of driving prices higher, that works out to about $27 million in margin. I’m probably being generous, as the 24X increase from 292 contracts traded at 8:29 was no doubt much more than was needed to overwhelm the “market” for CL.

    Bottom line: for a $27 million (probably much less) investment, someone created $8.7 billion in “value” in the S&P 500.  Once the tide was turned, the game was much easier.

    I just snapped a picture of time and sales for CL, and it’s startling how such minuscule volume can keep prices on the rise.

    Screen Shot 2015-10-29 at 11.03.13 AMThese are 1-2 contracts trading at a time, typically adding up to 2-300 per minute during the day.

    The next time one of the talking heads holds forth on investor confidence or some such rubbish, remember that it’s probably a lousy $10-20 million in USDJPY or crude futures that’s really responsible.

    Sigh…

  • Does it Count?

    If the “market” is driven higher by blatant manipulation, in clear defiance of the fundamental laws of economics, does it still count as a rally?

    Yesterday, the FOMC delivered a near carbon copy of its Sep 17 missive — the one that precipitated a 148-pt ( 7.3%) decline in SPX. Sure enough, SPX fell immediately after the press release. But, this time, central bankers were better prepared.

    They started by pushing CL up and out of a well-defined falling channel. It would go on to rise 8.5% in less than 24 hours, and is up 9.2% as we go to press.2015-10-29 CL 60 5 0635Also within minutes, USDJPY was ramped (out of its well-defined falling channel) up to and over its  200-day moving average.2015-10-29 USDJPY 60 0615Needless to say, SPX reversed its initial 21-pt sell-off and spent the rest of the day playing Follow the Algos.  It finished well above its .786 Fib — the first one since the September lows that showed any promised of providing at least a modest retracement.

    But, consider the chart below — which shows USDJPY’s 5 previous tags of the dashed, red trend line.  ES – the thin purple line – didn’t react all that kindly in the past.  Is there any reason to expect it will this time?

    2015-10-29 USDJPY v ES 60 0610continued for members(more…)

  • Update on COMP: Oct 28, 2015

    Two of the most bearish things that can happen to an index are when either a rising channel or a rising wedge break down.  For COMP, both happened on August 21.  After having already lost 7% since its July highs, it plunged another 12% over the next two sessions. Things were looking rather bleak.

    2015-09-15-COMP daily CU 2000In our September 15 update, I noted that it had climbed back up to reach important resistance:

    Exacerbating the situation is the fact that the bounce since Aug 24 has reached, just today, the .618 retracement of the drop from the Jul 20 highs.  What’s more, it has backtested an important internal TL (yellow, dashed) connecting many key highs and lows since last November.

    It’s a precarious situation for COMP.  Any of those features could, alone, be responsible for a downturn here.  If, on the other hand, the FOMC bails on the idea of higher interest rates in a couple of days, we could easily see all that resistance melt away.

    I put an upside target at the red TL (the white circle above) and waited to see what happened.

    Two days later, the FOMC decided that interest rates were just fine where they were for the time being, and COMP shot directly to our target — only to promptly reverse and plunge nearly 10%.2015-10-28 COMP daily 1050continued for members(more…)

  • Update on RUT: Oct 28, 2015

    In September’s update on RUT, I posted the following chart, showing both upside and downside targets for the index depending on how central bankers’ pronouncements were received over the next few days.

    2015-09-14 RUT daily 2001
    Sep 14, 2015

    It never occurred to me that both the upside and downside targets would prove to be correct (and, eerily correct, at that.)

    2015-10-28 RUT daily 0909
    Oct 28, 2015

    If that weren’t eerie enough, the index is, again, sitting at the gray channel midline, waiting to react to what central bankers have to say over the next few days.

    continued for members(more…)

  • When the Music Stops…

    musical-chairsAnother day, another central bank announcement.  Actually, make that two central banks, and the big one yet to come on Friday.

    In an effort to keep up with the ECB, Sweden’s Riksbank went all-in’er earlier this morning.  Around and around they go, waiting for the music to stop….

    As with any other FOMC announcement day, I recommend not trading — at least until the dust settles.  Today, I’m putting my keyboard where my mouth is and will use the next several hours until the announcement to update as many charts as possible.

    Last night, I posted an update to EURUSD.  And, earlier in the week, I updated both NYSE and DJIA.  If there’s a general theme to the big picture, it’s this:

    Having failed to generate real industrial growth and real income growth, central banks are focused on reinflating asset values and protecting their share of international trade through currency debasement and ZIRP (or, NIRP in some cases.)

    The chief driver of stock prices [see: What Really Drives Stock Prices?] continues to be the USDJPY which, now that it rests atop the critical .618 Fib at 120.11 and a bevy of moving averages, seems poised to break out.  If the “market” is to top May’s highs,  it needs USDJPY to break out.

    2015-10-27-USDJPY daily 0610And, that’s where things get complicated.  Because, right now, the US dollar chart suggests it’s done rising for the time being.  Having exhausted all its energy to drive SPX above its 200-day moving average, the old gal needs a breather.2015-10-27-DX daily 0610Arguing the opposite case is EURUSD, which has been on life support since breaking below channel support last Friday [see: Update on EURUSD.]

    I know what you’re thinking:  is there a scenario where USDJPY can break out (yen weakness, dollar strength), EURUSD can break down (euro weakness, dollar strength) and the US dollar can also weaken?

    Glad you asked.

    continued for members(more…)

  • Update on EURUSD: Oct 27, 2015

    EURUSD has declined to within .0056 (1.0995 vs 1.0939) of our downside target from September’s forecast.  It took a bit longer than anticipated, which wouldn’t much matter except that it means the pair departed from a well-defined trend channel.

    In early September, it appeared that EURUSD was within a few days of reaching the .618 Fib at 1.0939.  The pair was settling back down after spiking to the channel top (peak 1, below) to help SPX recover from its late-August correction.

    But, rather than make the obvious tag, EURUSD suddenly reversed (the white arrow) and backtested the purple channel’s midline a second time.  2015-10-27-EURUSD daily 2244This had the desired effect of helping to prevent another leg lower for stocks, as can be seen in the SPX chart below. 2015-10-27-SPX 60 2246In a world where USDJPY is seemingly all that matters anymore, EURUSD did an admirable job of pinch-hitting.

    But, as mentioned above, the delay had repercussions for EURUSD and, potentially, stocks as well.

    continued for members(more…)

  • Well Played, Currency Manipulators…

    Our initial downside target yesterday was the SMA200. It looked to be in the bag, as the white channel line intersected the daily SMA200 at exactly the same time as would the 5-min SMA200 (another common intraday target.)

    And, since SPX had fallen below the purple channel .786 line, a drop to the midline was potentially in the cards as a secondary target.

    2015-10-25 SPX 5 0732USDJPY was cooperating, having reversed below the SMA200.  It was even tracing out a nifty little falling channel.  2015-10-26 USDJPY 5 0905But, as we noted earlier in the session [see: Central Banks Can Relax]:

    [USDJPY] is the key chart to watch, as TPTB will want to keep it within striking distance of its SMA200 in case stocks start looking too wonky.  A quick ramp back to the SMA200 should fix things in a hurry.

    Apparently a 9-pt dip in SPX was much too wonky for The Powers That Be.  The perfectly good falling white channel in USDJPY was interrupted (the white arrow, a very unnatural spot) so that USDJPY could head back to the SMA200.  2015-10-27-USDJPY 5 0910The impact on SPX was almost immediate.  It popped through its clearly defined channel and spent the rest of the day oscillating higher — never once dipping below the green, dashed TL in the chart below.

    2015-10-27-SPX 5 0817
    updated Oct 27, 11:30 AM

    There would be no SMA200 tag during the cash session.  The only way US traders could play the backtest would be to:

    (1) stay short overnight, and run the risk of waking up to a big loss
    (2) stay up all night and watch it like a hawk
    (3) stay short, but hedge your position (or use stops, if playing futures)

    I’ve tried all three approaches many times.  And, trust me, none of them are particularly effective or enjoyable.

    I’ve been hit with many 3AM ramp jobs that nullified good patterns and left me with a loss.  I’ve pulled all-nighters, only to see the eminis easily propped up in the low-volume environment.  And, I’ve seen way too many stop-running exercises that prey on cautious investors.

    The “market” has always been manipulated.  But, in the old days, it was just as likely to result in a dip as it was a spike higher.  Not any more.  These days, the regulators are quick to prosecute HFT’s and algos that results in market corrections.  But, if you manipulate it higher, you have nothing to fear.

    After all, the biggest manipulators of all are the central banks themselves, with both direct and indirect intervention whenever things are getting out of control — or, they simply want to push indices past overhead resistance.

    That’s what last week was all about: SPX topping its SMA100 and SMA200.  It was driven entirely by USDJPY’s manipulation higher.  If this comes as news to you, please take 10 minutes to read the recent post:

    What Really Drives Stock Prices?

    Whatever pattern seems to be unfolding, whatever target appears obvious, they’re easily avoidable by the simplest of means: pushing the easily-manipulated USDJPY a little higher.

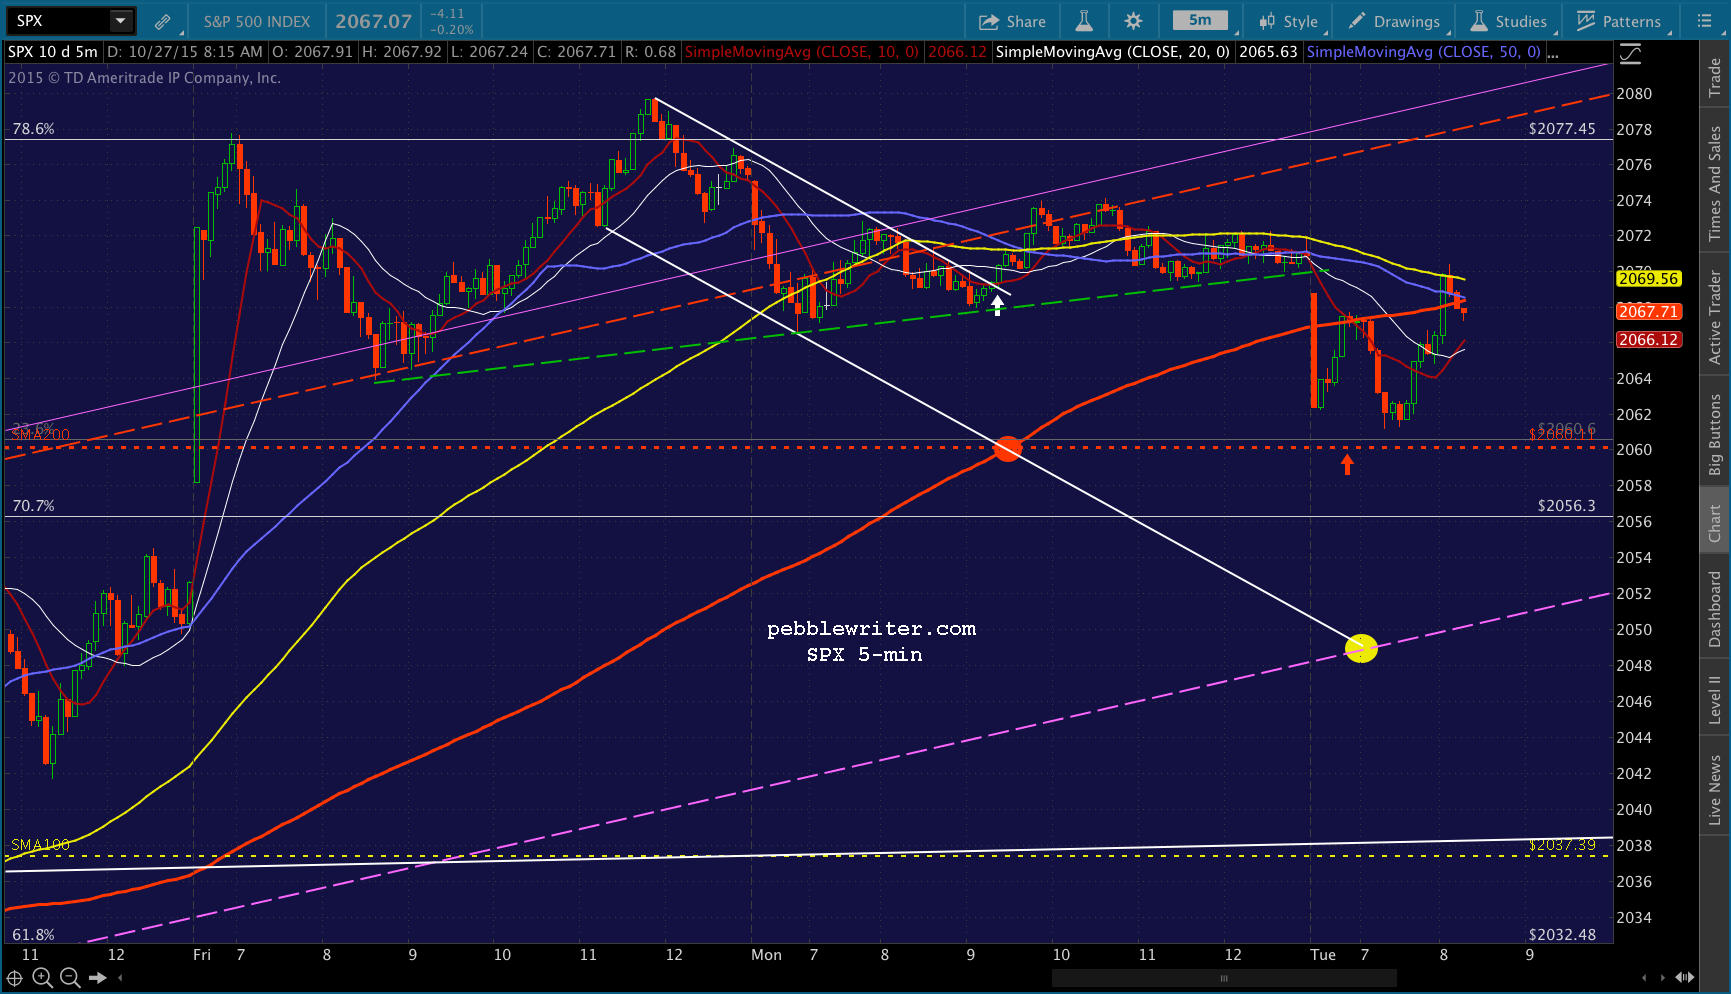
    We don’t have to look far for more proof.  As soon as cash markets closed yesterday (the red arrow) USDJPY continued to our downside targets: the bottom of the red channel, and on down to the .618 Fib at 120.11.  2015-10-27-USDJPY 5 0908 The goal was for SPX to tag its SMA200 at the open — when cash traders would be unable to participate.  And, it almost worked out that way.

    2015-10-27-SPX 5 0913Traders saw USDJPY bouncing before it even reached 120.11 and were quick to flip back to long positions.  It’s only now, almost 3 hours later, that SPX appears ready to finally reach 2060.

    After all this drama and subterfuge, will SPX get a big bounce there?  It’s not as clear cut as one might think.

    continued for members(more…)

  • Central Banks Can Relax

    The two charts on everyone’s minds this week are the meeting schedules of the FOMC and BOJ.  The Fed gets started tomorrow and announces Wednesday, and the BoJ bats clean-up on Friday.Screen Shot 2015-10-26 at 6.03.27 AMScreen Shot 2015-10-26 at 6.03.58 AMThe FOMC has been fostering sentiment that they’ll do something.  And, the BoJ has been downplaying their interest in doing anything.  From a market standpoint, it doesn’t matter all that much, as they already got what they wanted without lifting a quantitative finger.

    continued for members(more…)

  • Update on NYSE: Oct 25, 2015

    In our September update, I noted that NYA had plunged below a year-old channel bottom, only to reach the bottom of an even longer-term channel — seen below in white.2015-10-25 NYA wkly 2000 It struggled for over a month to climb back above the shorter-term channel bottom.  Finally, in early October, it gapped back above.  Now, it’s found new potential resistance.

    continued for members... (more…)