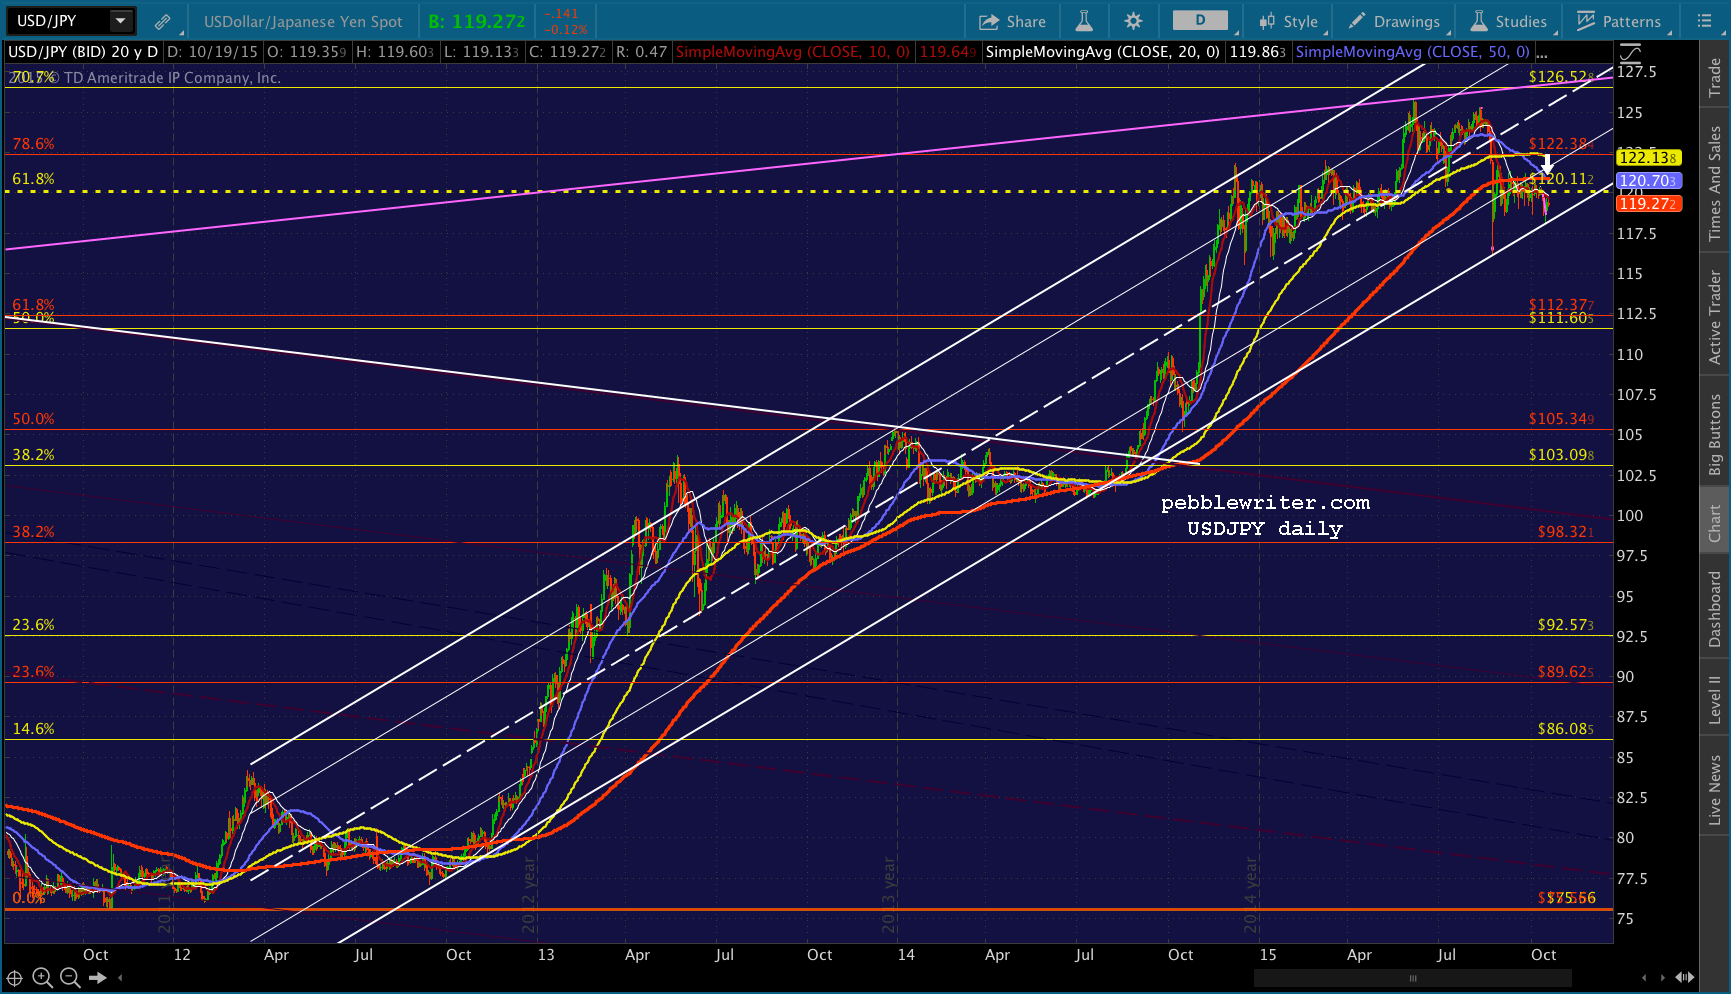
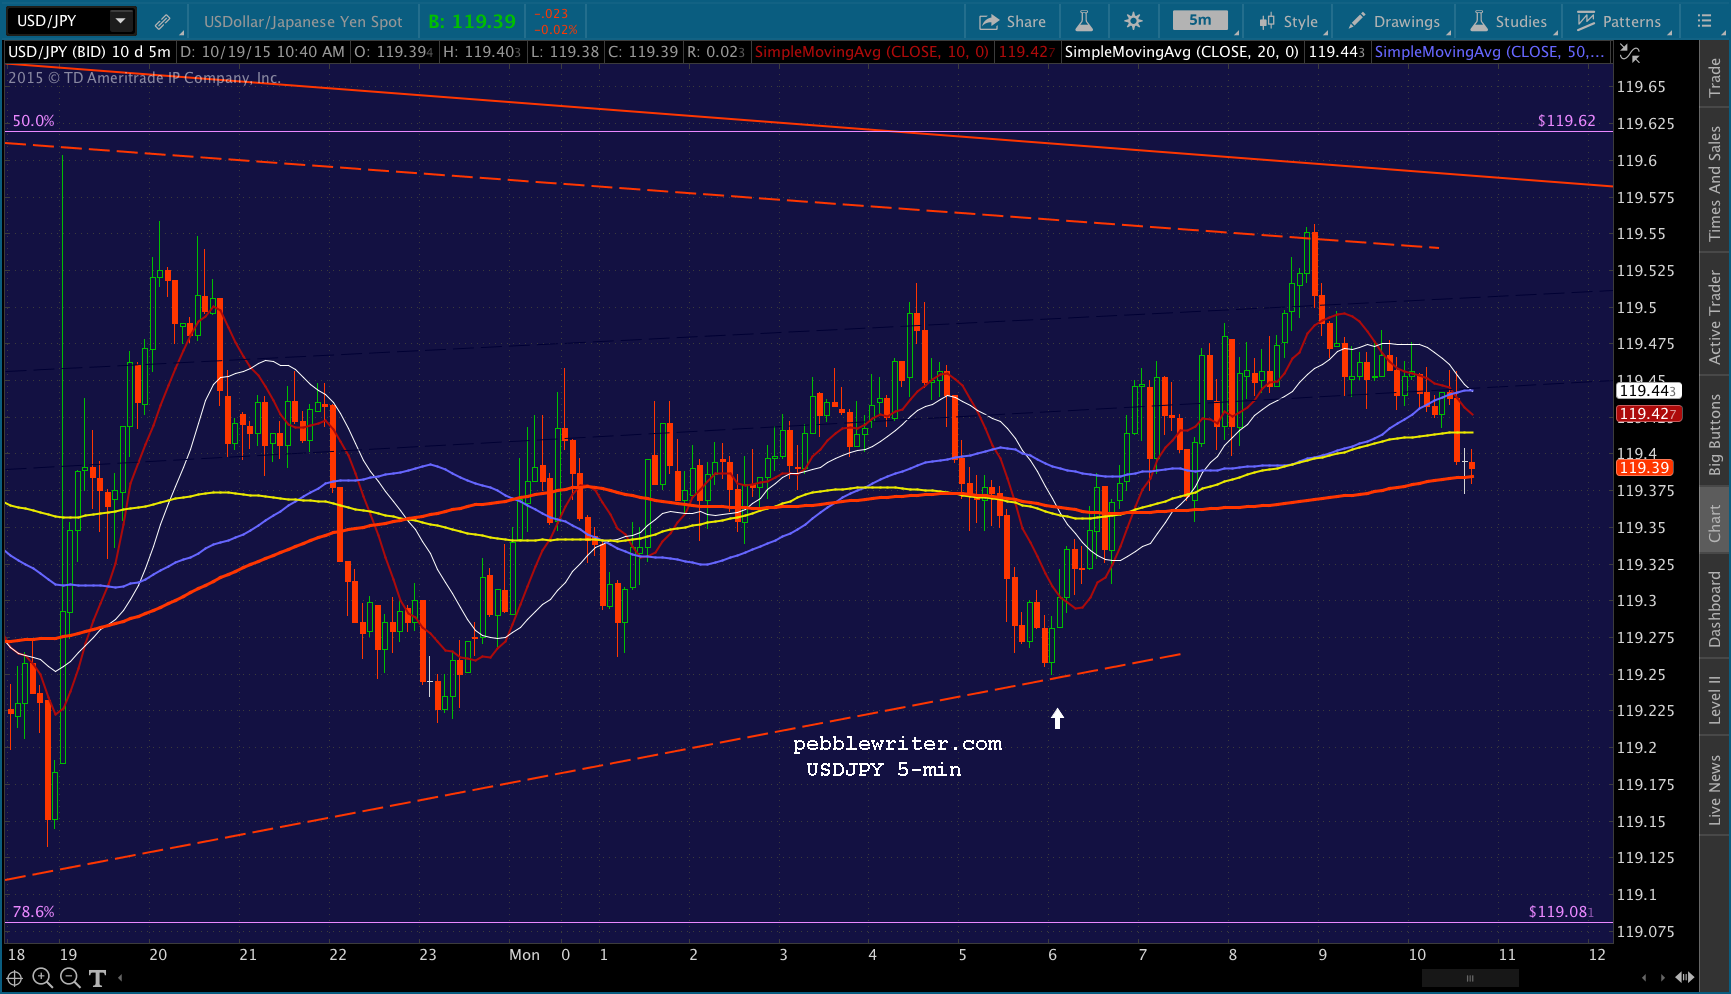
USDJPY’s 50-day moving average dropped below its 200-day moving average on Friday. In technical analysis, this is known as a death cross and is ordinarily considered a rather bearish development. The last time it happened, it precipitated SPX’s second biggest drop of the year. But, it is remembered more for the BOJ’s reaction than for that or the even bigger plunge that followed.
continued for members…It was July 17, 2014, and USDJPY had been in a protracted consolidation pattern, much like this past year. Within a week, SPX topped out and dropped about 80 points. The BOJ immediately took steps to devalue the yen, bringing the pair back above the SMA50 within a week and the SMA200 within another week. But, the most important impact was when, in a clear signal of what was to come, they broke USDJPY out of its triangle on Aug 20. It was off to the races, and SPX dutifully followed along. They allowed a significant backtest in mid-October that produced a 200-pt drop in SPX (that was reversed by Bullard’s QE4 comments and a subsequent BOJ QQE expansion on Oct 31.)
 The point is that the cross precipitated some rather important central bank moves that, in the end, required additional easing in order to save the “markets.”
With SPX having enjoyed an uninterrupted rally from 1871 on Sep 29, we can expect USDJPY’s latest death cross to incite a retracement — perhaps to one of the key moving averages such as the SMA50 down at 1988 or at least a lower Fib such as the purple .500 at 2000 or .382 at 1963.
But, more importantly, should carry trade investors decide the pair isn’t being properly propped up, we could see another, bigger leg down.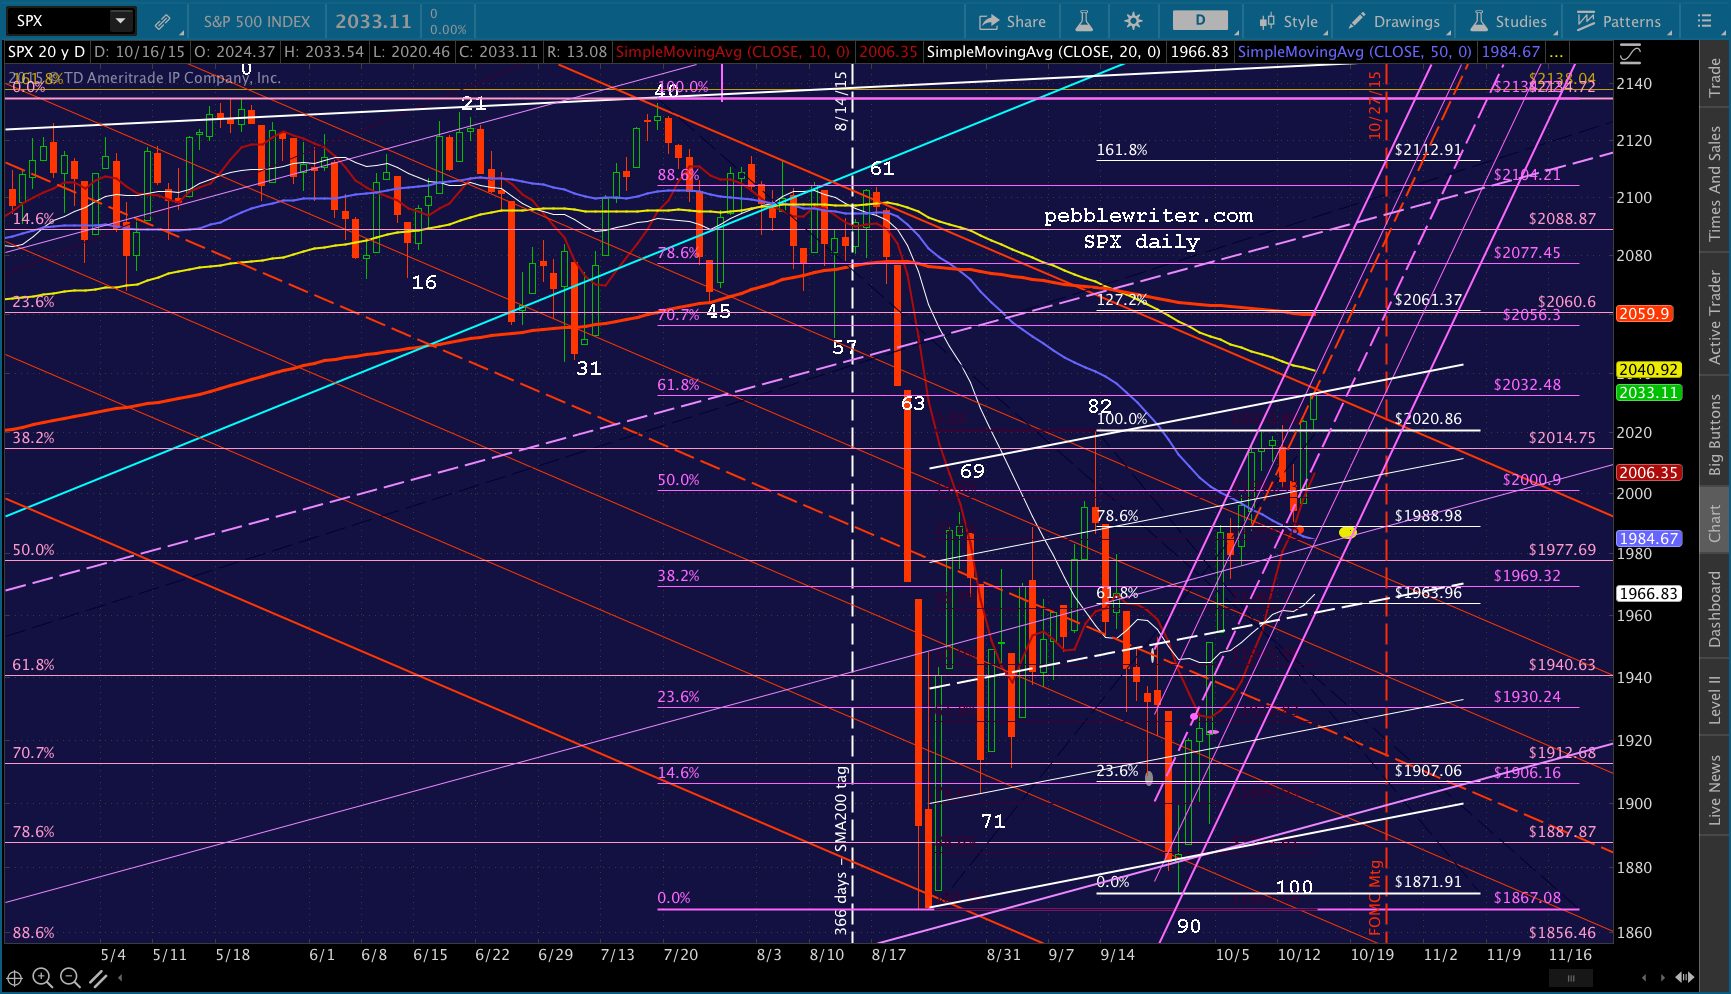 I expect the BOJ to come to the pair’s defense long before a 200-pt decline is allowed to unfold. But, with SPX having reached the top of its falling red channel and the purple .618 at the same time, the potential is there.
Today’s downside targets start at the SMA10 at 2006.35, and from there include the .500 at 2000.90, the white .786 at 1988.98, and the purple .382/white .618 cluster at 1963-1969. The upside targets are pretty obvious: the SMA100 currently at 2040.92 and the SMA200 at 2059.90.
I imagine that is TPTB are planning to leapfrog this resistance on this go-round, they’ll time it to coincide with the ECB’s announcement on Thursday.
UPDATE: 10:15 AM
A repeat of Friday so far, with a USDJPY ramp job to stave off futures’ pre-opening slump. It’s an extremely effective circuit breaker. And, it’s hard to know whether they’re working on a deep retracement (slow down the decline) or a new high until it plays out.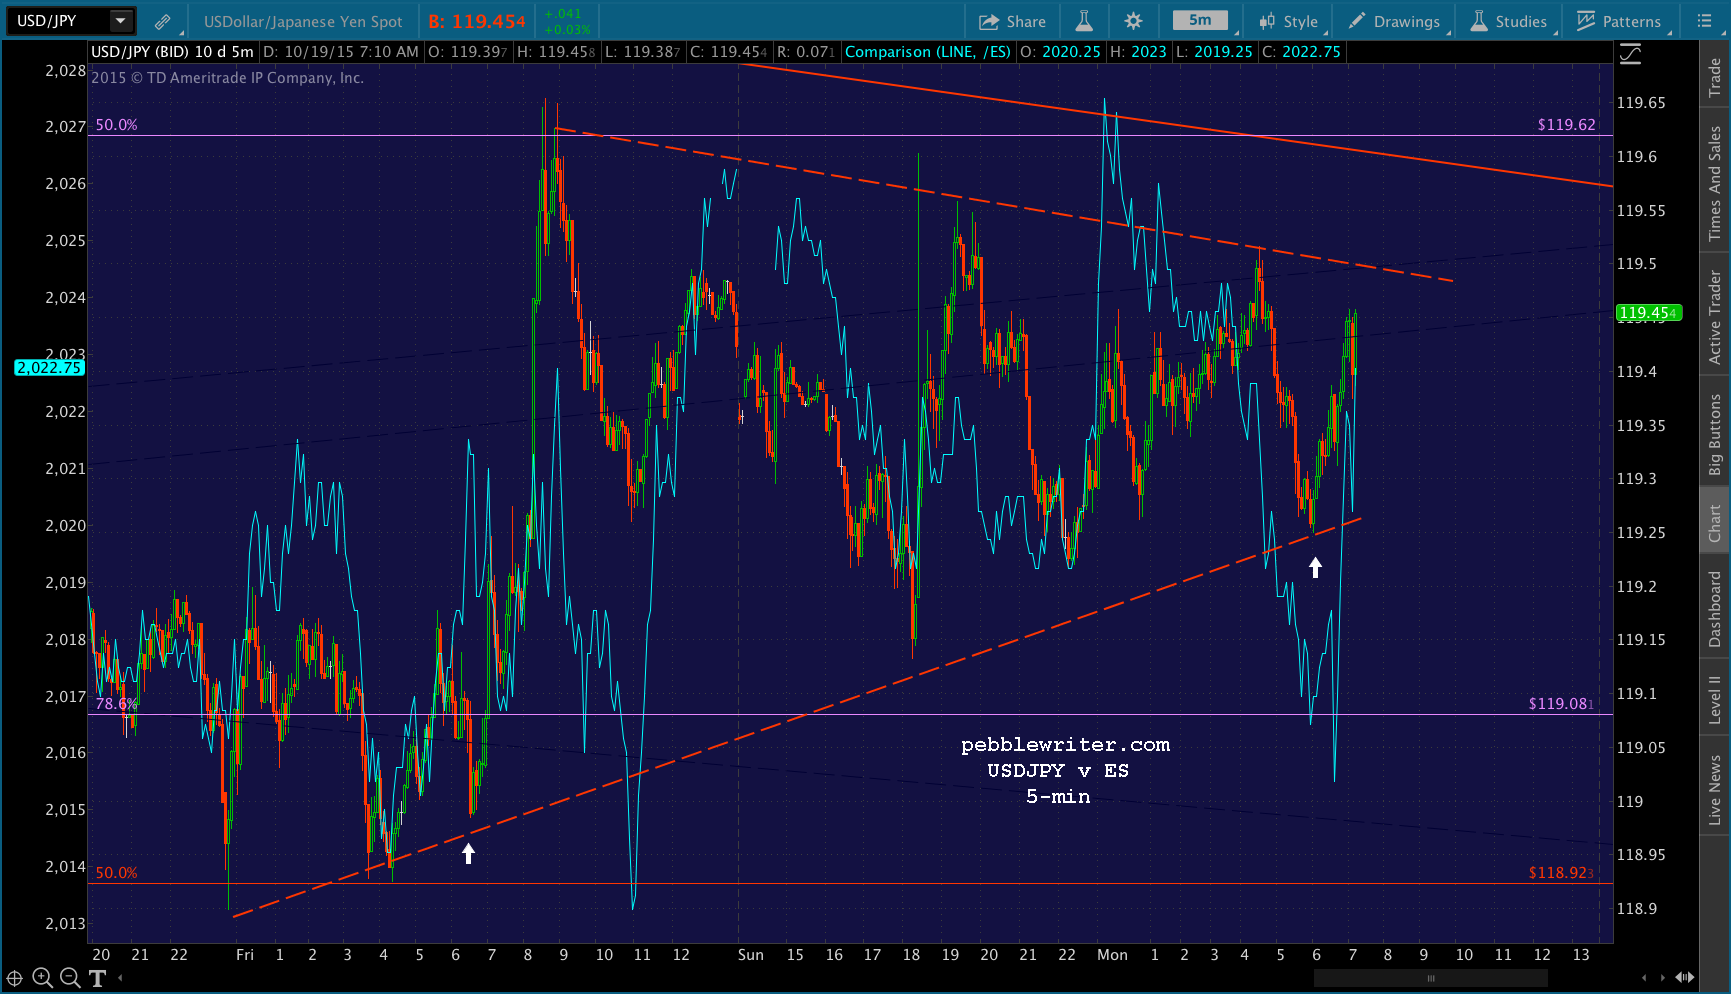 In this case, I suspect they’ll let it go ahead and decline — at a moderate pace — and use the ECB’s action/press conference on Thursday to break above the SMAs (assuming that’s the goal.)
UPDATE: 11:30 AM
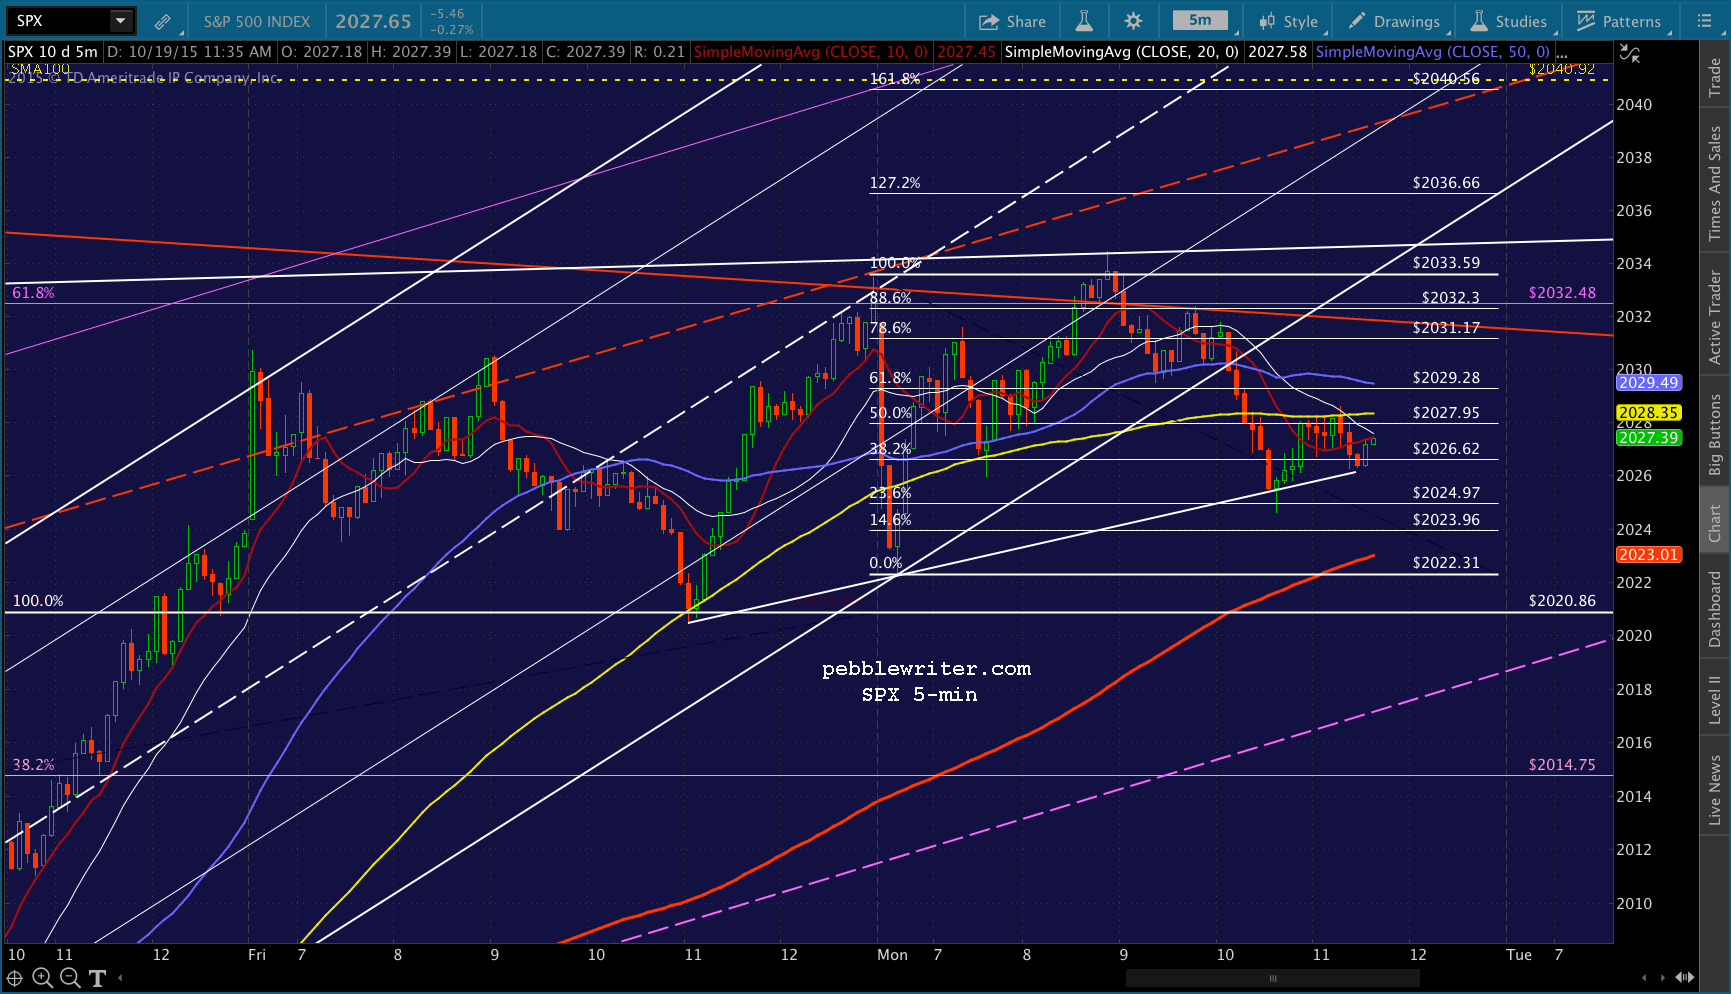
USDJPY has continued to rise, but without breaking out of the triangle — meaning that SPX is likely to stop melting up at the .886.
If it doesn’t reverse there, however, there’s very little resistance up until 2036.66 — the white 1.272. I’d want to get long on any sustained push higher than this — and, particularly if USDJPY breaks out.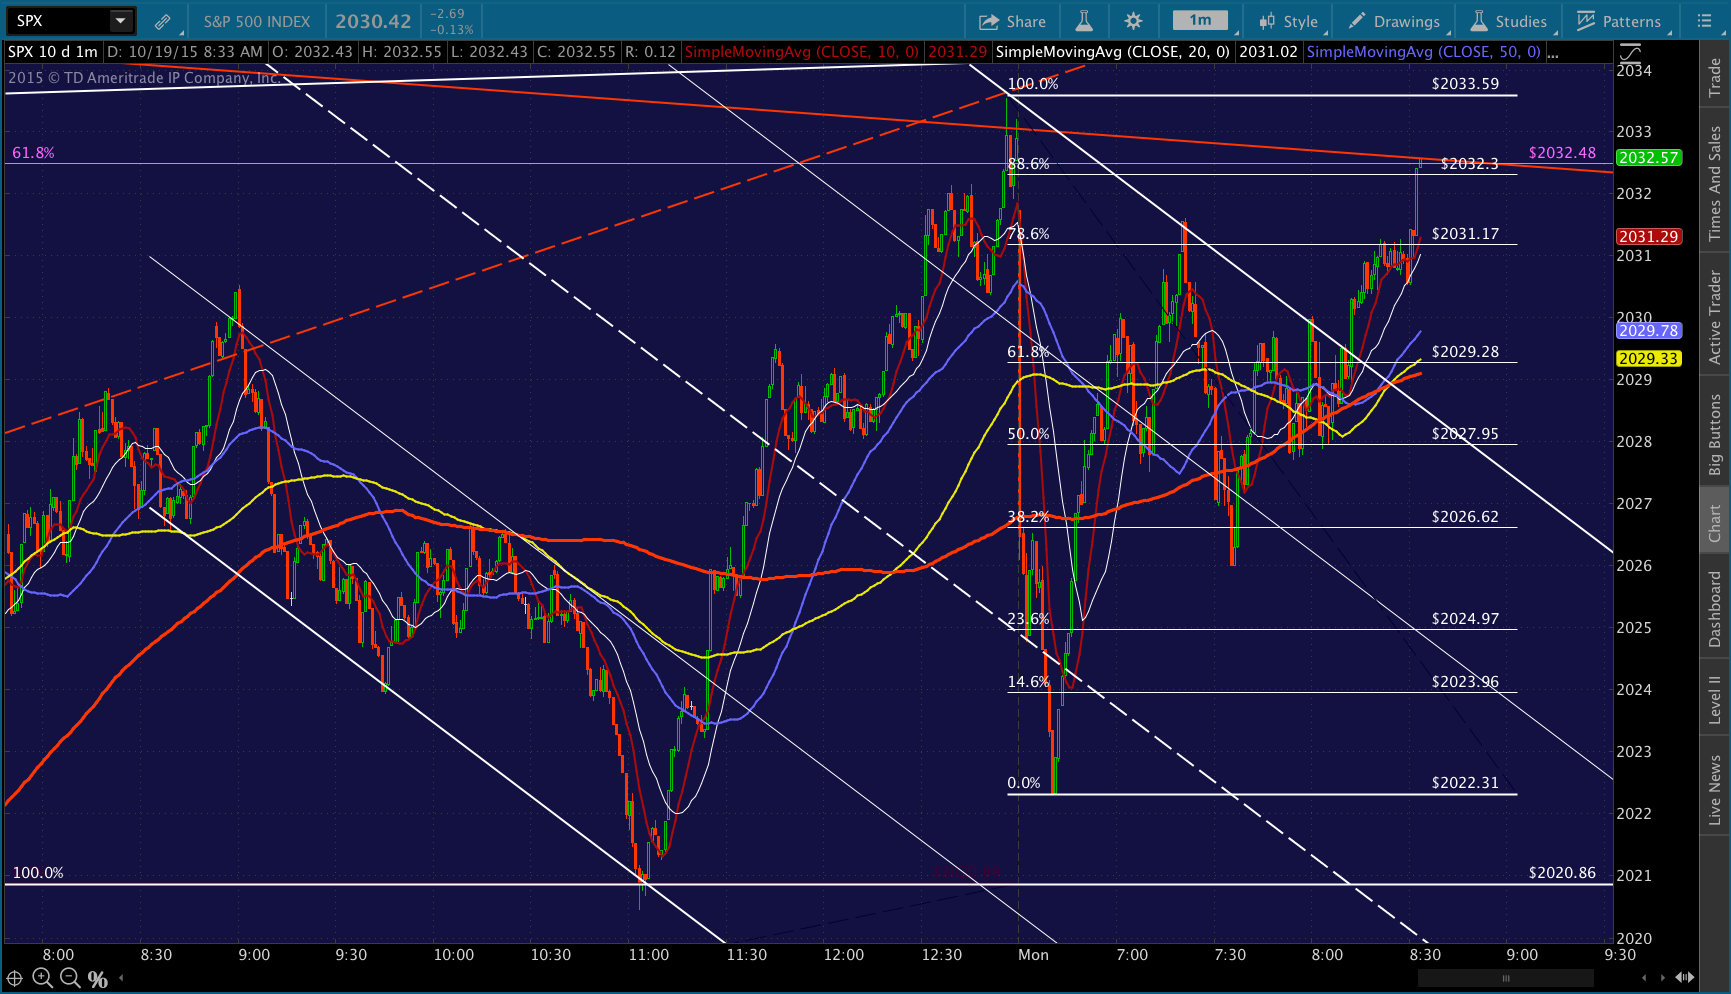
 My gut tells me they’re not ready for it to break out just yet. So, it’s entirely possible we’ll see another 3 steps forward, 2 steps back advance that keeps the rising trend alive without committing them to a break out. The clue is NKD, which completed a large IH&S Friday, but hasn’t played out as yet. If it hasn’t played out, there’s a reason — as very little happens to NKD without the BoJ’s direct involvement and approval.
UPDATE: 11:55 AM
ES just completed its .886 retracement — final line in the sand for our retracement scenario.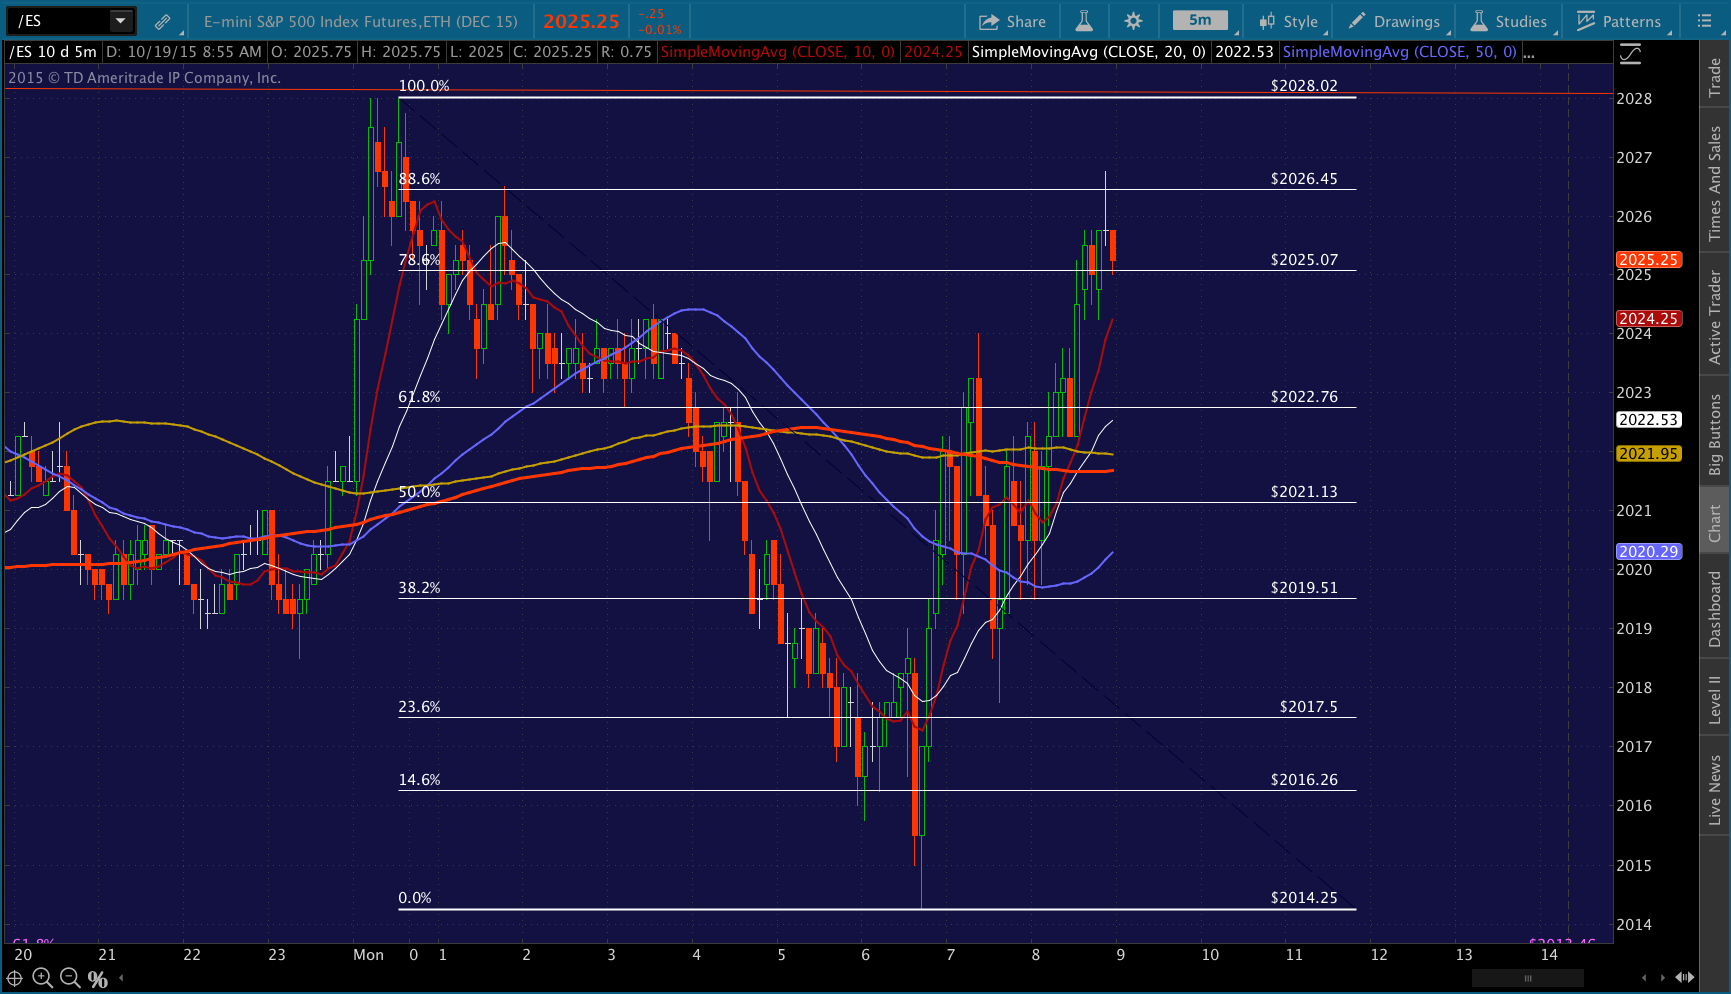 UPDATE: 1:40 PM
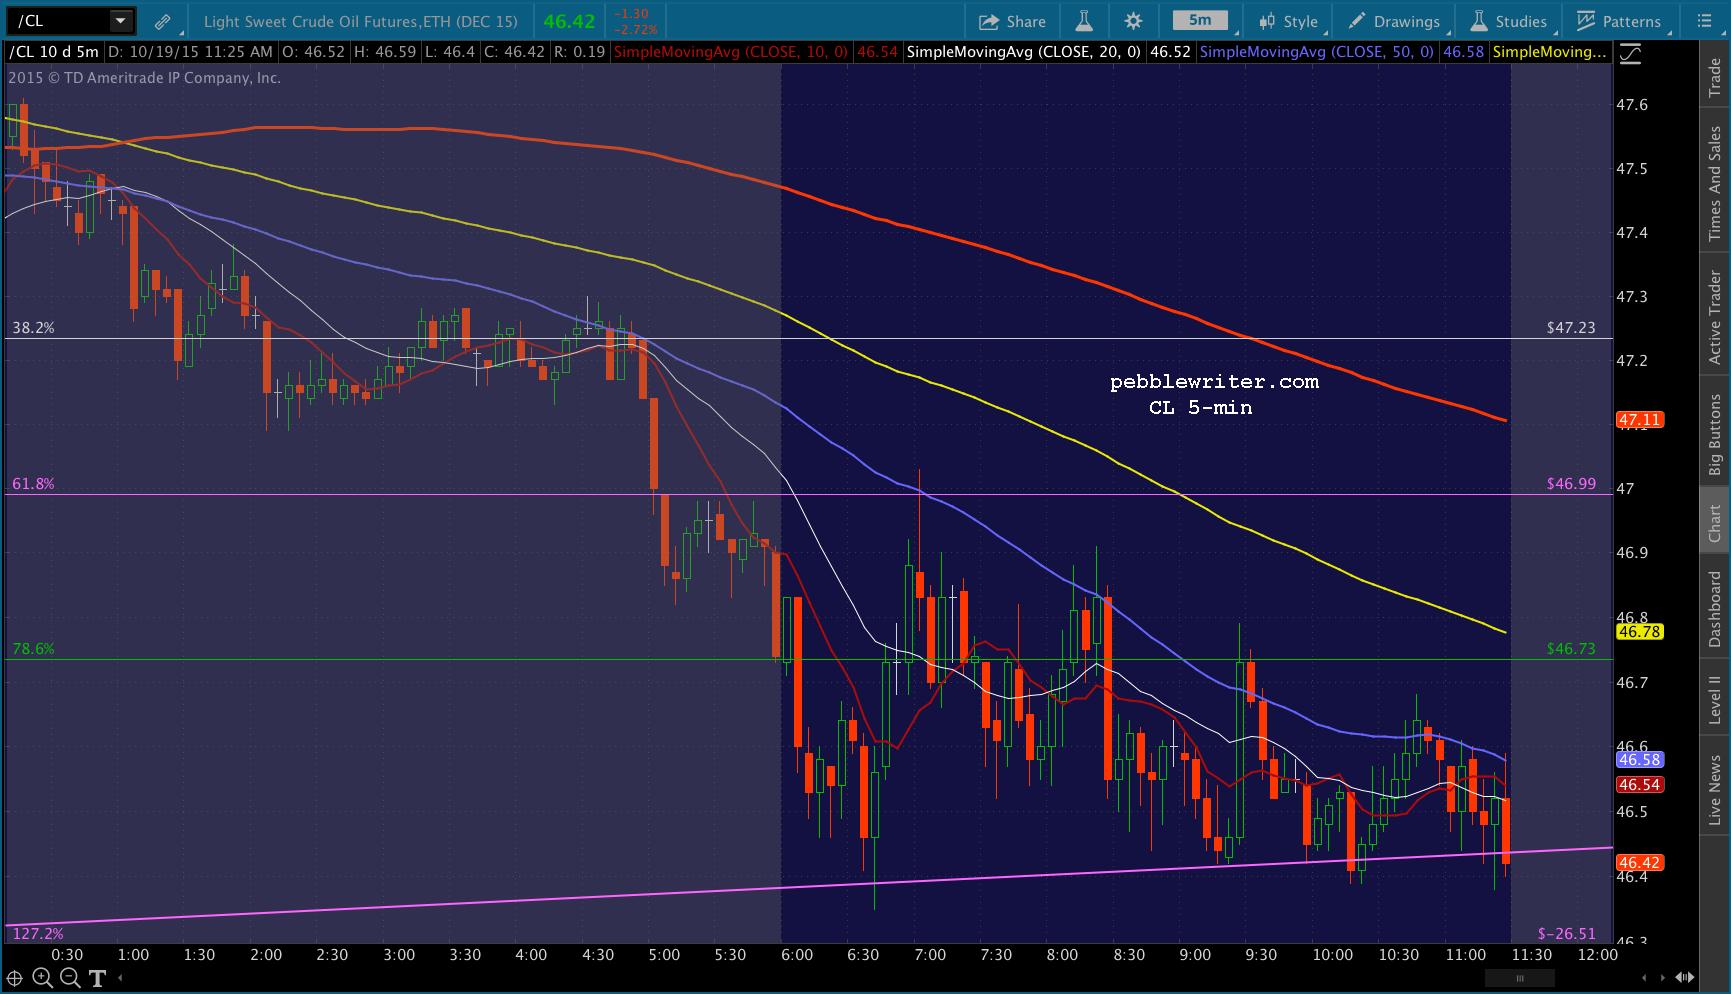
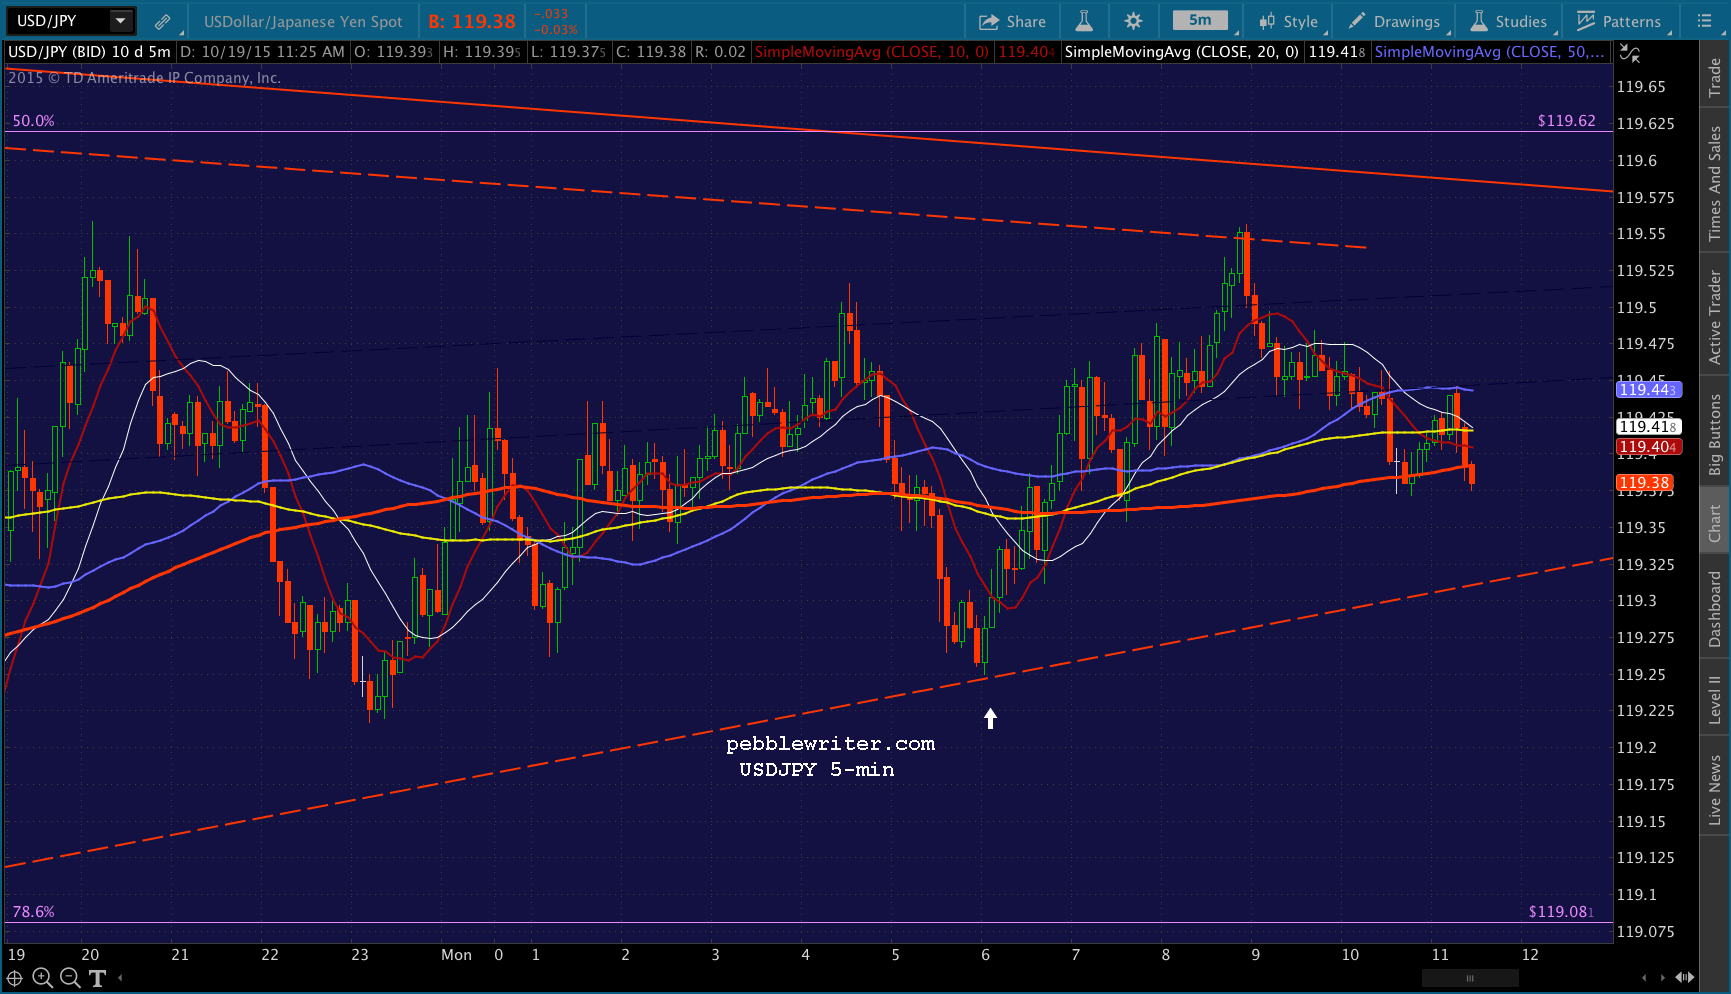
USDJPY has found support at its 5-min SMA200, and CL is recycling back up after finding support on the channel bottom. So, apparently, that’s all the downside TPTB are going to allow for now.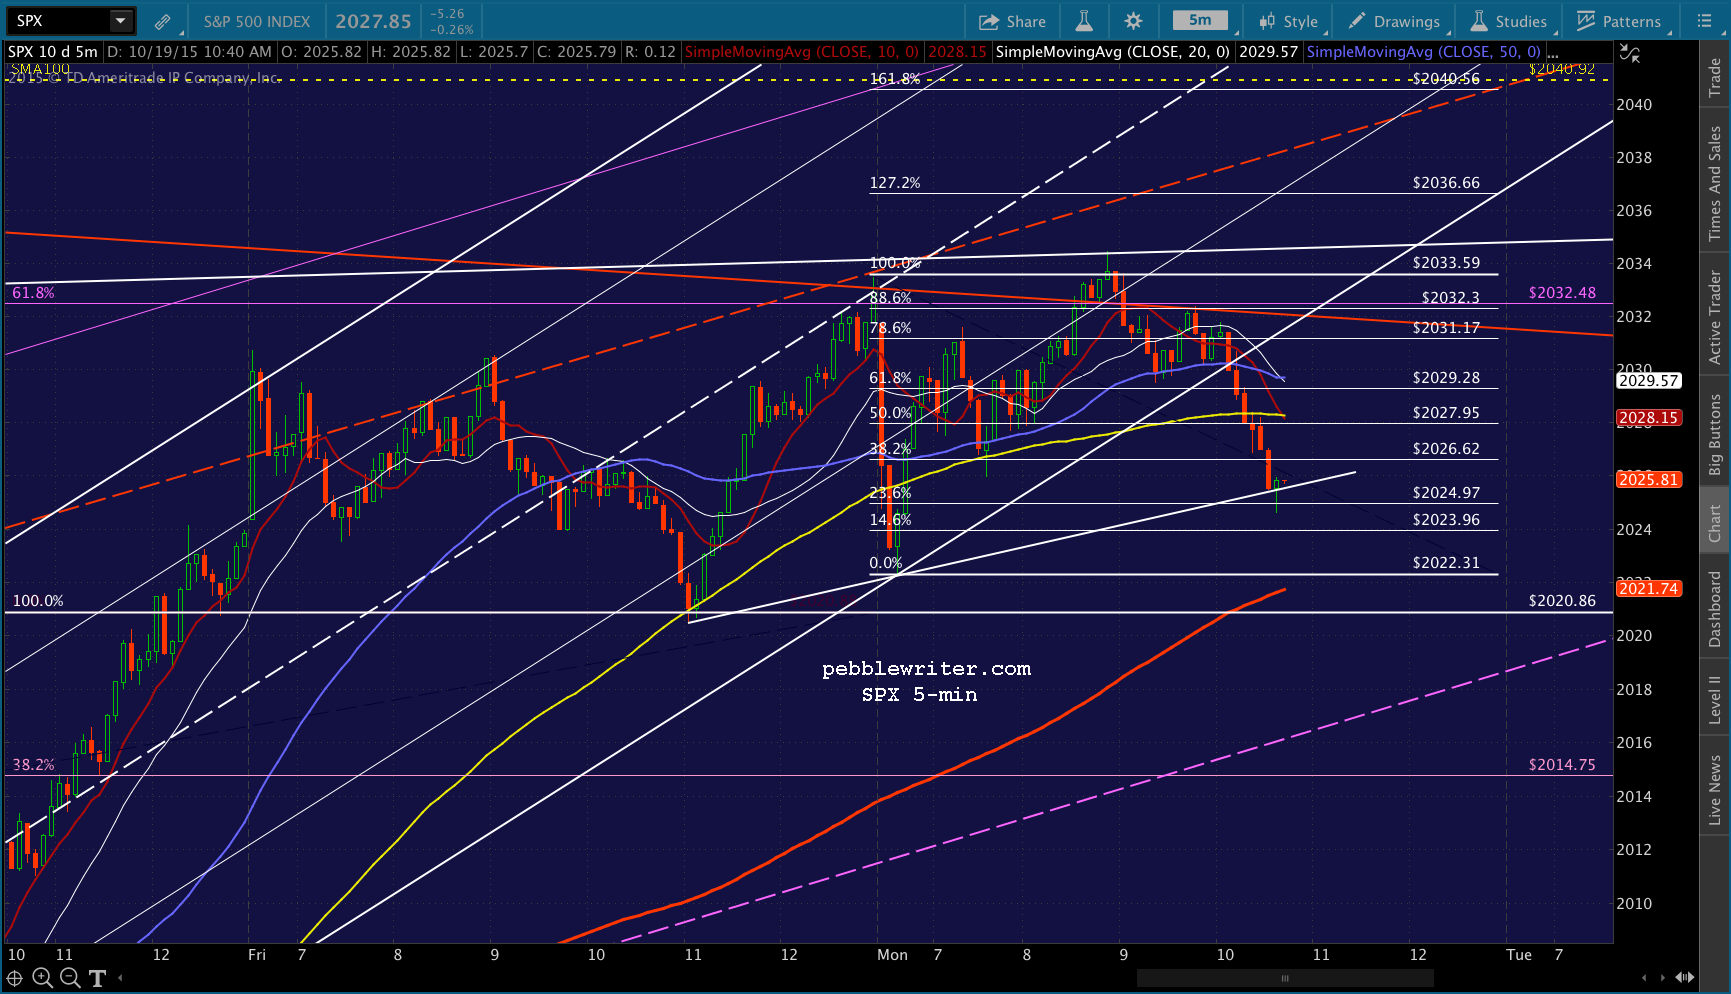 Watch for a bounce back up to the falling SMAs unless these drivers of stock prices can settle lower.
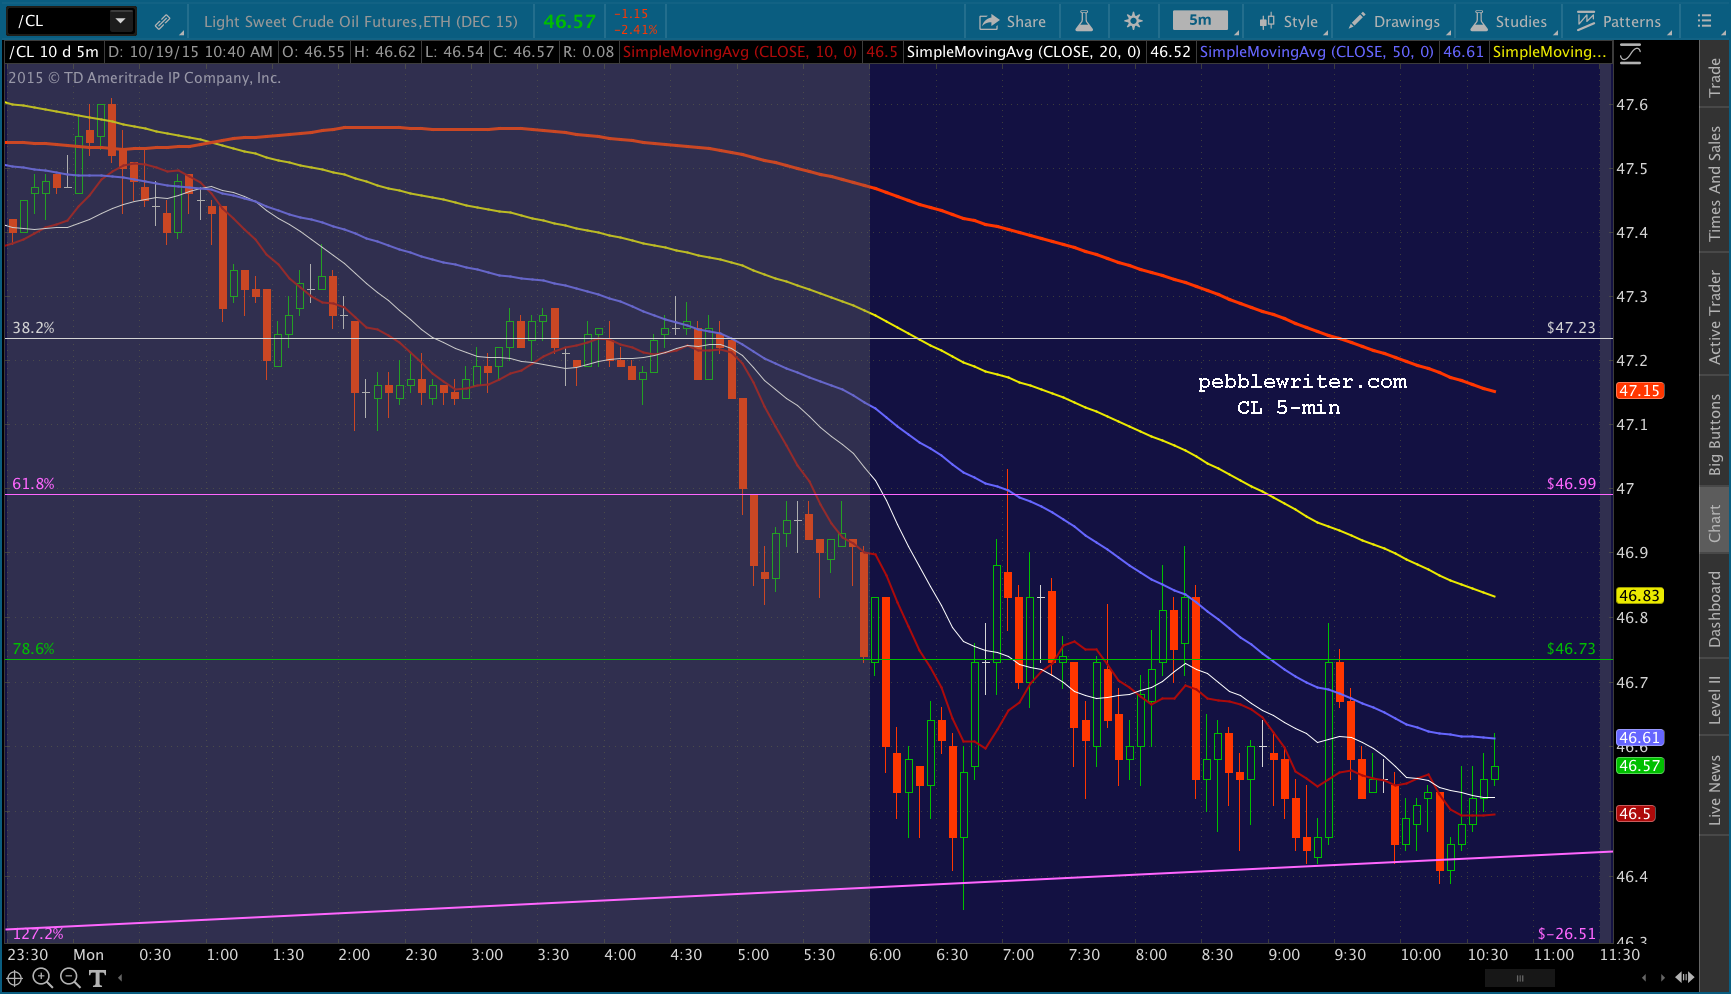
 UPDATE: 2:25 PM
USDJPY is back down to the SMA200 and CL testing the channel bottom again, so SPX should be able to tag its SMA200 at this point. Back to short.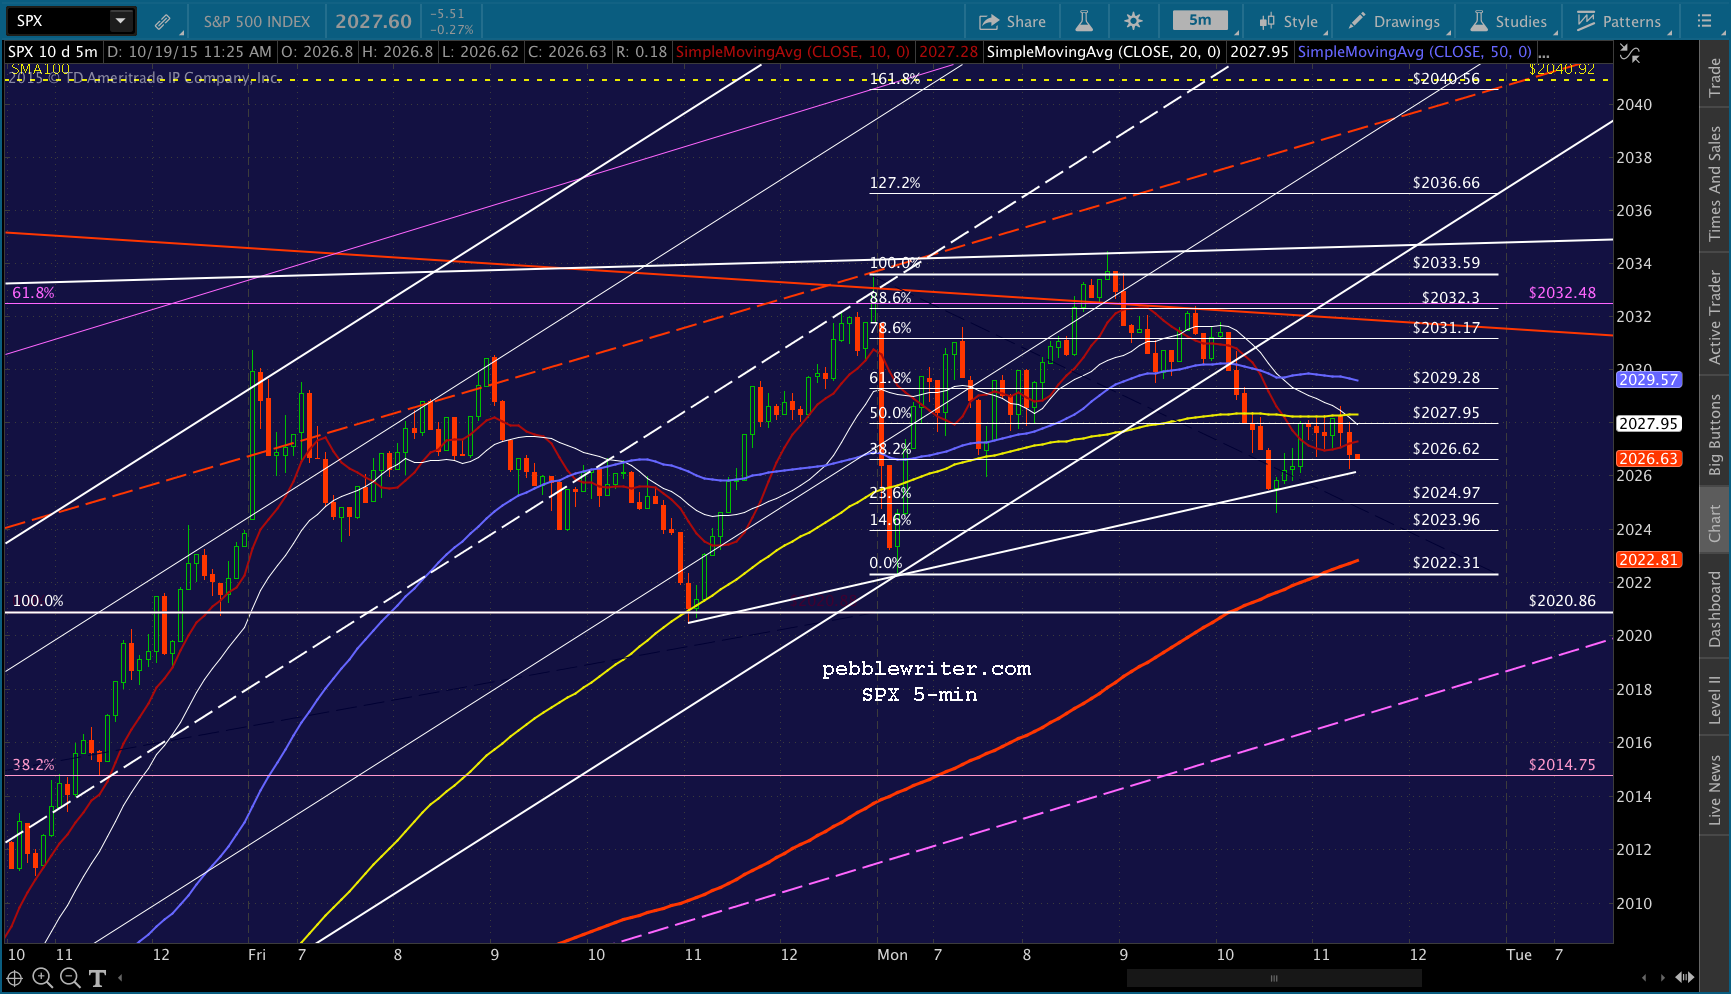
 UPDATE: 2:35 PM
It was a head fake. Closing the short and going to cash.
Given the propping up that’s going on, I’m going to assume that the ECB triangle has already begun. Any sizable moves will likely come in the opening hour (or even minutes) and the rest of the days will be about backfilling and testing the top/bottom of a narrowing triangle with apex on Thursday.
Not a great trading environment unless the triangle is big enough and reliable enough to play the intraday swings.