Month: October 2015

  • Pennant no More

    Yesterday played out as expected, with a stop-running exercise that set a new high as we discussed last week.

    But, this market is far from unrigged.  Predatory HFTs use traders’ expectations of reversals at Fib levels to set them up.

    It has already played out once, suckering those who bet on any kind of a reversal along the way since the 1871 bottom (there wasn’t one.) It may yet sucker in those who go long once 2020.86 is broached.

    USDJPY closed outside the Pennant Pattern yesterday for the first time since its inception on August 24.  Furthermore, it tagged our initial downside target overnight.  From yesterday’s members section:

    The BoJ would love to morph USDJPY’s fluctuations into a rising channel, but that means including some tags on the lower Fib levels such as the red .618.  They’re more likely to chicken out at the rising red TL and purple .236 at 119.27 — especially if SPX is tanking.

    By waiting until after the cash market closed, most of the damage to stocks was avoided.  But, with 15 minutes until the market opens, I suspect SPX will reach yesterday’s downside targets with little trouble.2015-10-14-USDJPY 5 0615continued for members(more…)

  • Charts I’m Watching: Oct 13, 2015

    USDJPY’s Pennant continues to drive markets.  Today, it’s lower.2015-10-13 USDJPY 60 0615continued for members(more…)

  • Update on USDJPY: Oct 12, 2015

    The big picture shows several very significant features.  First, the drop from 1998 followed a fairly well-formed channel that was interrupted in October 2011 by a massive QQE expansion.  The subsequent yen devaluation (USDJPY increase) sent the pair screaming higher where it barely reacted at the yellow .382 — not even dropping to the next lower Fib level.2015-10-12-USDJPY wkly backtestAnother QQE expansion sent it spiking out of the huge channel and up to the yellow .618 at 120.11 where it was quite overdue for a retracement.  However, since the pair is carefully managed by the BoJ, and any decline is instantly translated into falling equity prices (thanks to the yen carry trade), it was, again, not really permitted to react.

    It has occasionally drifted lower, but as soon as equities start sagging it is immediately brought right back up to that key Fib level.  Finally, this past May, it broke out.  But, it ran into the rising purple channel that broke down back in 2008.

    This backtest has proven problematic for USDJPY’s continued upside, as has the BoJ’s pause in announcing additional QQE.  USDJPY dropped back down and backtested the .618 (well, almost…stocks had a hissy fit) before zipping back up to retrace .886 of that particular drop on Aug 12.

    That’s when the wheels came off the bus.  China and nearly all of SE Asia was in trouble, and all that hot money was flooding back into and strengthening the yen (weakening USDJPY.)

    continued for members(more…)

  • The Big Picture: Oct 12, 2015

    With the bond market closed today and volume expected to be minimal, I’m taking the opportunity to update a number of secondary charts.  We’ll start with an overview of the big picture.

    *  *  *  *  *

    In December 2013, the S&P 500, along with other key indices, had reached important technical resistance: a huge Butterfly Pattern at 1823, set up by the decline from 2007 to 2009.  Rather than reverse, though, it was forced higher by the yen carry trade.  The yen was aggressively monkey-hammered, USDJPY spiked right through resistance, and stocks did the same.

    2013-12-23-SPX-wkly-butterflyIt was the second big success for the yen carry trade since the BoJ put a floor under USDJPY in 2011.  But, the celebration was short-lived.  Central planners were growing increasingly uneasy about the repercussions of the yen’s continual devaluation.

    Bashing the yen made stocks more valuable and helped exporters, but it made everything Japan imported more expensive — especially oil, which is priced in US Dollars.  Energy prices, conveniently excluded from Japan’s CPI calculations, had soared 27% since Fukushima.

    Yen Carry Trade PictureHigher energy prices not only hurt Japanese consumers and businesses, they complicated the argument for expanded QQE — which was necessary (the party line, at least) in order to cause much-needed inflation.

    Seven months after USDJPY got the S&P 500 over the 1823 hump, stocks were starting to struggle again.  USDJPY had been going sideways, and investors were starting to wonder if the carry trade had run its course.  TPTB needed USDJPY to actually break out.

    The only way to accommodate this without killing off Japanese consumers and businesses alike was to crash oil prices (or, at least stop propping them up.)  And, that’s exactly what happened.

    2015-10-11-CL v USDJPY 1835As the chart above shows, USDJPY’s breakout from that protracted consolidation occurred at exactly the same time that CL started crashing.

    And, everyone would have lived happily ever after… except for the fact that the carry trade relies on the yen continuing to devalue.  Sideways doesn’t cut it.

    Last December, USDJPY reached the critical .618 Fib retracement of its losses from 147 to 75, and has since gone essentially nowhere.  Without the guarantee of the yen carry trade to propel it higher, SPX topped out in May and has been dropping ever since.2015-10-11-USDJPY v SPX 1835Bottom line, it’s time for another boost.  If you find yourself thinking “wait a minute; this has to end eventually,” congratulations!  You are smarter than all the central bankers in the world put together.  They’re addicted to the “benefits” of the yen carry trade: higher stock prices.  And, like any addict, they can’t see beyond the need for one more fix.

    But, keeping the carry trade going means oil has to decline even further — which presents other problems.  The fracking industry, for instance, is hanging by a thread.  Worse yet (from their standpoint, not mine), the banks financing all that activity are feeling the pain of all those borrowers going belly up.

    While TPTB might not care much about frackers, they do care about bankers (or, at least a couple of them would be in jail by now.)  So, they’re at an interesting juncture with no great choices:

    1. keep bashing the yen, which would keep stocks rising but make Japan’s 5th recession since 2009 official as oil and food prices spike.
    2. keep bashing the yen, but crash oil prices too — which would kill off at least a few banks and more than a few oil industry players.
    3. give up on Abenomics and the yen carry trade, which would give some measure of relief to Japanese consumers and businesses (other than exporters) — but crash the stock market.

    The one factor I haven’t mentioned is that between the BoJ and the GPIF, the Japanese government owns about $700 billion in stocks.  That’s almost 15% of its GDP.  And, given that Japan is leveraged to the tune of 240%, their stock holdings should be considered heavily margined.  I wrote about this two months ago in Japan’s Equity Trap.

    2015-10-12-USDJPY v SPX LTAnyone who’s ever been heavily-leveraged and upside-down on a huge bet knows what desperation is all about.  And, though you’d never guess from their speeches and press releases, Abe and Kuroda must be feeling pretty desperate right about now.

    The BoJ has another monetary policy meeting coming up on October 30.  All investors will remember last October 31, when the last big expansion of QQE (with help from Jim Bullard) rescued stock markets from the biggest decline since 2011.

    Will we see a repeat performance? I think so. Central bankers have consistently deferred to the institutions which caused the financial crisis in the first place.  I can’t see that changing anytime soon.

    Sure, they’ve painted themselves into a corner with respect to oil prices.  But, when was the last time a central banker stood up and admitted that QE was a huge mistake — a zero sum game which shifted rather than created wealth and which should be unwound regardless of the impact on the stock market?

    Stay tuned.


  • Busted Patterns

    Another night of USDJPY ramping took ES up to 2014.  It’s not significant in and of itself, but it is slightly higher than the Sep 17 high of 2011.75.  In the world of Fibonacci Patterns, this means that the red grid set up by the Aug 24 bottom and the Sep 17 top is technically kaput.2015-10-09 ES daily 0621Ordinarily, this would be a very bullish development.  But, in a world run by currency manipulators and HFT’s it has more often than not been a head fake.


    Note that USDJPY and CL have both reached important reversal points, meaning that this morning’s initial gains should be faded.2015-10-09 USDJ{Y 60 06162015-10-09 CL daily 0646

    continued for members...

    The only caveat is that ES is only 21 points away from its SMA100, and could be ramped up there quite easily by USDJPY popping up above the Pennant top as happened back on Sep 24.  Odds are that SPX is also being primed to bust its Fib top at 2020.86.

    A glance at the 5-min chart shows strong and rising SMA support that should be able to get USDJPY to the purple .786 and SPX up to 2020.87.

    From there, note that there have been few reversals since SPX 1871.  Today it should at least backtest the white and gray midlines and SMA50 at 1995 – provided that USDJPY respects the Pennant top.

    UPDATE:  9:48 AM

    Almost there.  I’ve always said that the most dangerous time for Harmonic Pattern traders is the space in between the .886 and the previous high.  Is it a Bat Pattern that’s running a little over or will we see new highs?

    In unrigged markets, it’s normal to see a reversal at the .886.  Those who rode out a stock’s decline are relieved to be back near its previous highs, and sell once it gets “close enough.”  But, this market is far from unrigged.  Predatory HFTs use traders’ expectations of reversals at Fib levels to set them up.

    It has already played out once, suckering those who bet on any kind of a reversal along the way since the 1871 bottom (there wasn’t one.) It may yet sucker in those who go long once 2020.86 is broached.

    They’d pile in on the long side (many as a result of being stopped out) and face a sell-off as USDJPY reverses at the Pennant top.  Since few investors are even aware of it or its influence, they’d never see it coming.   And, since it’s the weekend, they’d have to decide whether to risk holding long or not.

    If the sell-off, whether today or Monday, is violent enough, they can be counted on to dump their new long position just in time for USDJPY to pop above the Pennant top and run SPX back towards the approaching SMA100.

    2015-10-09 SPX daily 0648The SMA100 should reach the purple .618 and red channel top sometime next week, and makes for an appealing target — that is, unless our 2011 analog works as it should.  As much as I would love it to play out, its odds of doing so are fading daily — at least in the prescribed time frame.

    A drop either later today or Monday would be a good start.

    UPDATE:  11:06 AM

    SPX came within 73 cents earlier, when USDJPY suddenly reversed lower.

    2015-10-09 USDJPY 5 0805 2015-10-09 SPX 5 0805Here’s a close-up in 1-min charts.  The timing was exactly the same (9:54 EST) in both, meaning that SPX has been completely locked in by USDJPY today.  No rigging here…2015-10-09 SPX 1 0823 2015-10-09 USDJPY 1 0823USDJPY can do this all day, meaning it could be 4 1/2 more hours of watching and wondering, knowing all along that whatever the final move is will be irrelevant because of the odds of it being a head fake.
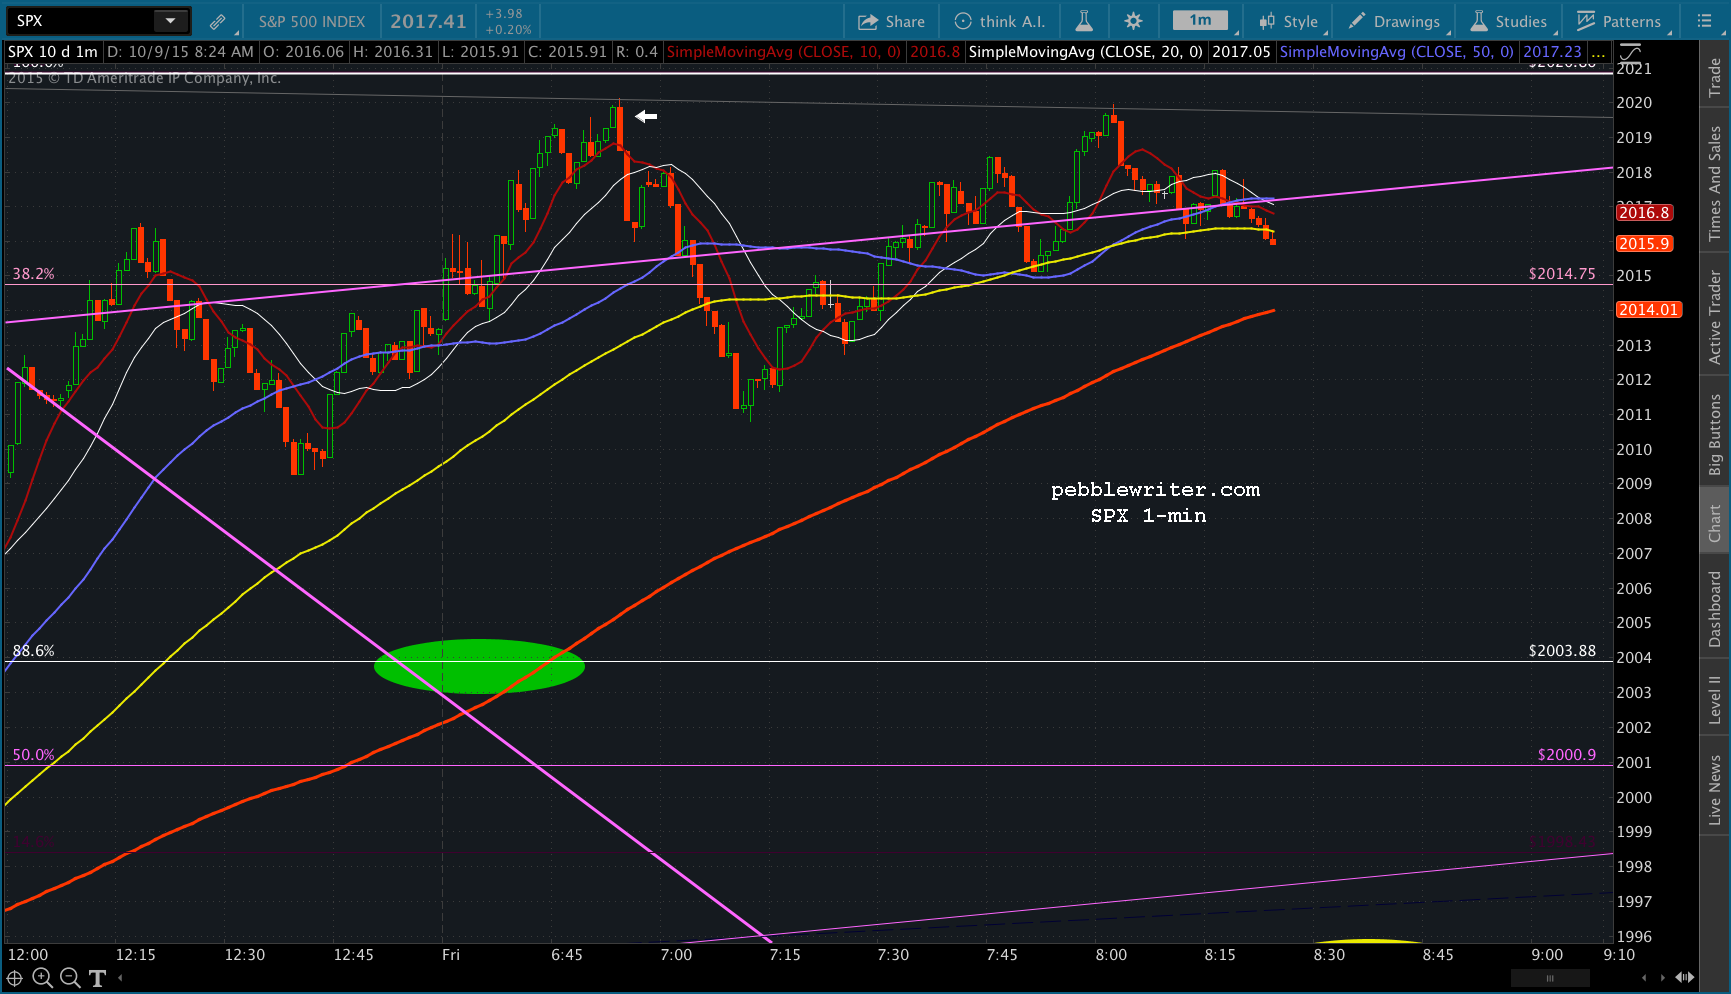
    Given the non-existent volume, it’s apparent that most traders have had enough of this crap and are getting an early start to their weekend.

    The only move that would get me interested in trading right now is a push below the SMA50 at the yellow TL (2012.70ish), which would signal a probable backtest of the SMA100 where it crosses 2003.88.  It would be a potential 9-point move, meaning a whopping 4/10%.    If it got going, however, then our 1995 target suddenly comes into play — more like 2015-10-09 SPX 5 0834The SMA100 should reach the .886 a little after 12:00 today, so the whole thing would need to get started pretty soon.

    And, it would need to be accompanied by USDJPY pushing below its moving averages and the purple channel midline.2015-10-09 USDJPY 5 0834UPDATE:  11:55 AM

    Here we go.  SPX is just about to the TL and SMA50.  It’ll either bounce here or be a nice little short targeting 2003.88.  Watching USDJPY for a sign…2015-10-09 USDJPY 5 0854FYI, I have to be out of the office for a meeting from 12:45 – 2:30PM.

    UPDATE:  12:11 PM

    I’ll try that little short here at 2013.43.  The objective is 2003.88 or wherever the SMA100 is when it’s tagged.

    2015-10-09 SPX 5 0910 Tight stops are advised, as it already backtested the SMA10 and 20 and shouldn’t need to tag them again unless it’s going to rise back above.  Also, ES has TL support here.

    2015-10-09 ES 5 0910UPDATE:  12:45 PM

    As mentioned earlier, I have to run out for a meeting.  I’d stay short for 2003.88.  At that point, I’d look for a reversal or a bounce.  If a reversal, the next stop is >2020.86.

    If it’s just a bounce, the best target is probably the top of the falling purple channel or the white SMA20 — wherever it happens to be at the time — with the purple SMA50 a secondary target.  And, then the decline would continue to the SMA50 at 1995ish.

    2015-10-09 SPX 5 0944At this point, everything feels very controlled.  But, if USDJPY gets going toward 120.11 — which it could easily reach by day’s end — then that will obviously accelerate things.  Keep an eye on it, and the purple channel which crosses 120.11 at 2:30ish.2015-10-09 USDJPY 5 0944I should be back around 2:15pm.

    UPDATE:  2:23 PM

    SPX just tagged the 5-min SMA100.  I’d close out the short here at 2008.59 and wait for a dip below it in order to get short again.  Another possibility is to short at the SMA50 — currently at 2012.89.

    My best guess at this point is 2003.88 won’t come until the close — if then.  Note the SMA200 has really flattened out, and is unlikely to top 2000 by the end of the session.2015-10-09 SPX 5 1122If USDJPY could break down below the white TL (also a neckline for a little H&S) then I’d get excited about more downside, but right now this is proving to be too carefully controlled.2015-10-09 USDJPY 5 1122UPDATE:  2:29 PM
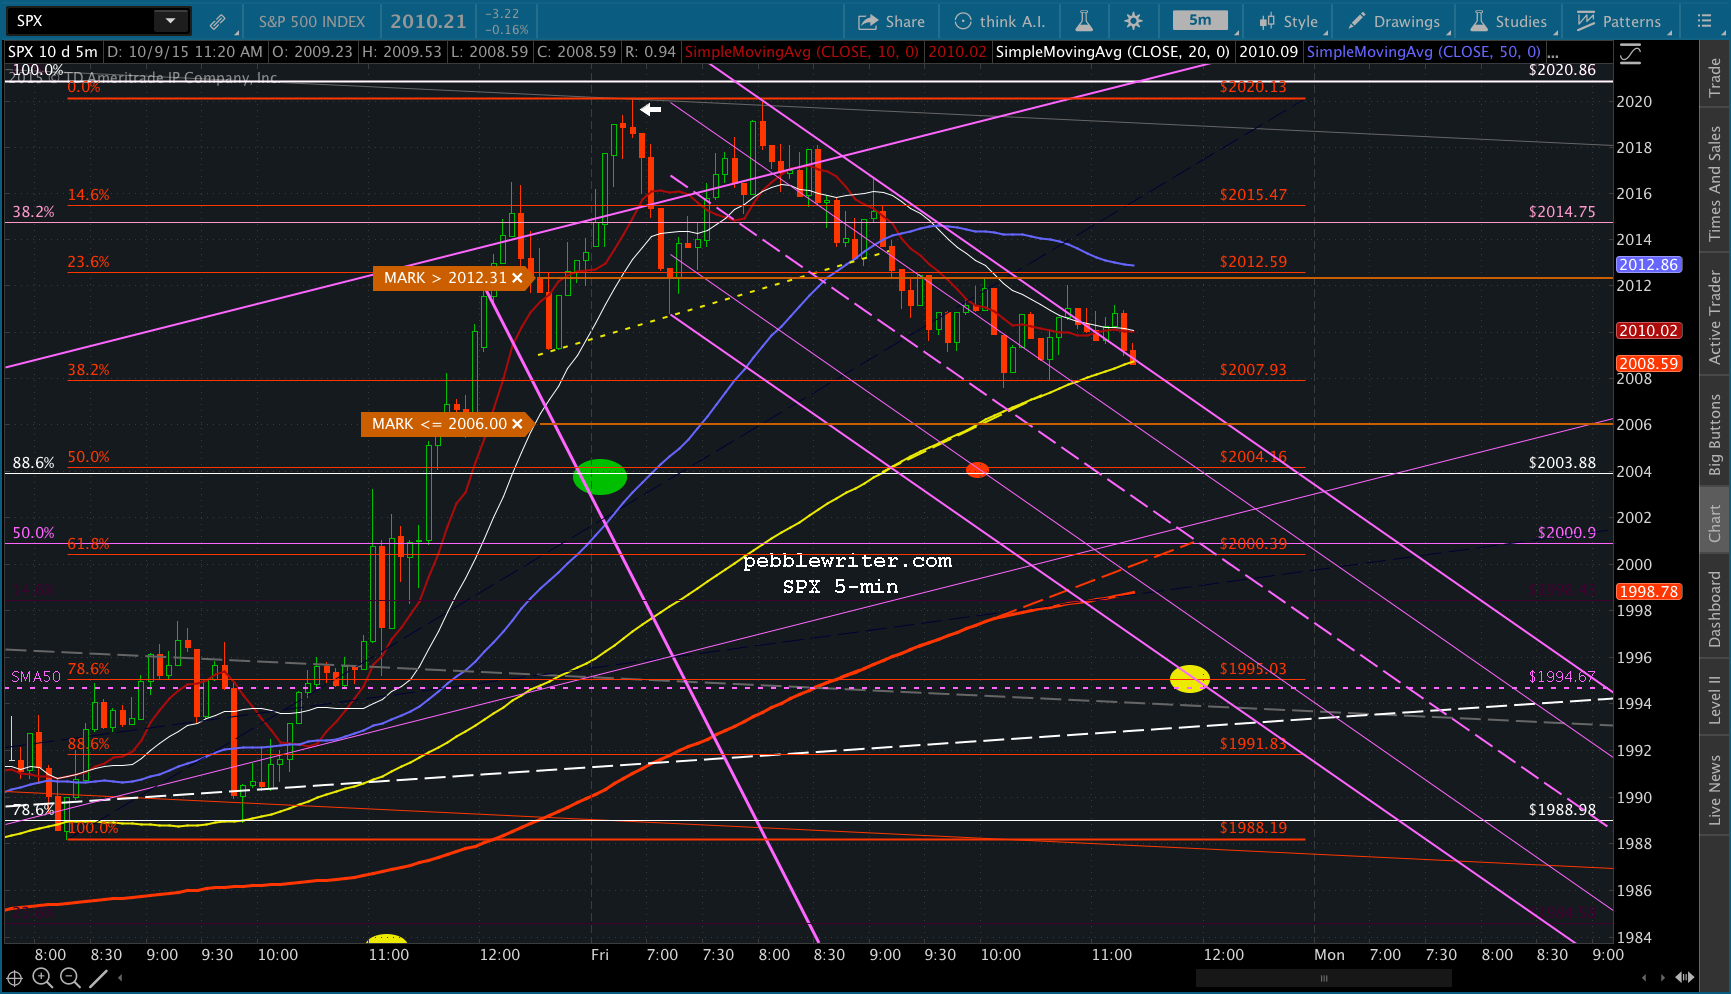
    USDJPY just backtested the purple midline, so there’s at least a chance for a reversal at SPX’s SMA50.2015-10-09 USDJPY 5 1129UPDATE:  2:52 PM

    CL playing games now.  A 1% move in 3 minutes in order to help SPX break above the SMA10/20 combo a few minutes ago.  Now it’s refusing to let up, and SPX just broke out of the other, less aggressive falling channel that might have allowed it to reach 1994 by EOD.

    I would fade this bounce.  The SMA100/200 tags provided a nice reversal that should see CL back down to new lows: 37.07 and quite possibly the .886 at 26.22.2015-10-09 CL 1 1154

    SPX needs to reverse right here, right now in order to have a shot at those downside targets.  I’ll try shorting here at 2013.05, but with super tight stops.  If it doesn’t start down shortly after 3:00, I’m out.

    2015-10-09 SPX 5 1154Note that ES is backtesting the broken TL connecting last night’s lows.2015-10-09 ES 5 1158UPDATE: 3:30 PM

    In technical terms, it ain’t happening.  Closing out the short here at 2013.06 and calling it a day.  I’d not be surprised to see follow through on Monday — especially since USDJPY did tag the top of the Pennant and the next move should be to the bottom.2015-10-09 SPX 5 1230Would I go long here?  I don’t see any problem with it into the close, using the SMA10 as a guide for trailing stops.  Just know that it’s just as likely to close right where it is.  ES’s VWAP is at 2006.45, and it’s already sitting at 2007.5 right now.

    UPDATE:  3:50 PM

    USDJPY suggesting a sell-off at the close.  With only 8 min to go, hard to imagine it amounting to much.  If it starts plunging, though, hit the sell button as quickly as possible.2015-10-09 USDJPY 5 1250 2015-10-09 SPX 5 1250

  • Pinball Wizards

    We still have 2 Charter Annual Memberships left that are eligible for an immediate $200 rebate.  This lowers the already discounted $1,099 rate to only $899 for your first year — only $2.46 per day! 

    We’ve had terrific results year-to-date, and are up about 8% so far this month.  If you’ve recently joined as a monthly member, consider upgrading to an annual membership now.  There will never be a better deal. 

    To sign up, CLICK HERE.

    FOMC days (minutes are due out at 2PM) are often characterized by markets bouncing back and forth within a tight triangle until the big event occurs.  At that point, they bounce wildly higher or lower — careening off support and resistance only minutes apart before finally settling on a direction and the algos kick in.

    I see no reason why today should be any different.  And, the upside and downside targets are pretty clear.

    USDJPY dipped to the bottom of the Pennant Pattern again last night.  While it’s pretty easy to keep this game going for a while, the trick is in the timing.  By holding off on the bottom tag until after the close, TPTB were able to minimize the impact on stocks.

    2015-10-08    USDJPY 15 0615continued for members… (more…)

  • Make it or Break it?

    Last day of our membership promotion.  Rather than dragging it out, let’s make this fun. 

    The next 5 new members who sign up for a charter annual membership will earn an immediate $200 rebate.  That works out to $899 for your first year — only $2.46 per day! 

    After the first year, your subscription continues at the discounted price of $1,099 and never increases for the life of the site — even when membership prices go back to $1,650 after this promotion, and next month when they’re slated to increase to $1,800.

    If you’ve recently joined as a monthly member, consider upgrading to an annual membership now.  There will never be a better deal.  And, with the terrific results we’ve had so far this year, there might never be a better time.

    To sign up, CLICK HERE.

    Existing members — don’t forget, referring a new annual member will earn you (or, share it with them) a cool $300.  Or join with a friend and split it.  Either way, it’s my way of saying thanks for spreading the word.

    *  *  *  *  *

    It came a day early — I charted it as Oct 8 back on the 25th [see: USDJPY’s Triangle Breaks] — but, today’s the day we find out whether or not our latest analog is worth a darn.  Yes, the 50-day moving average will be tagged this morning.

    Last night, the BoJ punted on additional QQE (at this time, as we expected) and USDJPY plunged back below the key 120.11 Fib.

    After seeing the effect on stocks, though (ES was off 22 points from yesterday’s highs) it was quick to find its way back — and without even testing the bottom of the pennant pattern.2015-10-07 USDJPY 60 0600Thanks to that, as well as CL breaking to a new interim high [see yesterday’s post], ES ramped overnight to tag its SMA50.  2015-10-07 CL 60 0600SPX will clearly follow along on the opening.  The big question is whether or not it’ll stick.

    continued for members(more…)

  • Update on Oil: Oct 6, 2015

    If USDJPY is the kingpin of stock manipulation, CL is more like the enforcer.  That is, if USDJPY is otherwise occupied in, say, a gang war with the yuan or the dollar, CL is more than happy to step in and ensure that stocks don’t seize the opportunity to stray from the “understanding” that there is only one direction in which they should spike.

    So this morning, as USDJPY cools its heels waiting for the BoJ to come through with expanded easing, CL is up nearly 3.5% — gleefully kneecapping bears who had the nerve to bet against central banks’ omnipotence.2015-10-06-CL 60 0751It was enough of a move to break out of the triangle it’s been in since late August.  What does it mean for the bigger picture?

    continued for members(more…)

  • The Pennant Race

    A reminder: our membership promotion has 36 hours left to run. Save over 50% on an annual membership that protects you against future price increases for the life of the site.  It works out to about $3/day, not a bad price for some pretty terrific results. To sign up, CLICK HERE.

    For those who’ve recently joined as monthly, quarterly or semi-annual members, consider upgrading to an annual membership now.  Annual rates will revert to $1,650 when this promotion is over, and are slated to increase to $1,800 next month. 

    And, don’t forget, referring a new annual member will earn you (or, share it with them) a cool $300.  Or join with a friend and split it.  Either way, it’s my way of saying thanks for sharing the word.

    *  *  *  *  *

    For the last month or so, we’ve been tracking USDJPY’s movement through (and beyond) the Pennant Pattern that set up following the Aug 24 plunge. 2015-10-05 USDJPY 60 0612 Yesterday, USDJPY confirmed its importance by racing to the top of the Pennant and sitting there for the next 4 hours.  SPX dutifully followed along, logging in its second biggest day since last week’s bottom as traders anticipated a big breakout.

    But, they were disappointed. There was no breakout. SPX reached the highest of our three targets yesterday, but USDJPY — not so much.  So, we’re sitting here this morning at pretty much the same spot that we left off yesterday.  And, the only chart that really matters today is this one:Screen Shot 2015-10-06 at 6.38.06 AMIt’s the schedule of BoJ’s Monetary Policy Meetings.  If Kuroda, who is supposed to speak at 11pm, announces more easing, then the Pennant breaks out and the carry trade can go on to produce new highs.  If he doesn’t, then it’s back to the bottom — or lower — for more cellar dwelling, at least until the next meeting at the end of the month.

    continued for members

    (more…)

  • Charts I’m Watching: Oct 5, 2015

    A reminder: our membership promotion has 48 hours left to run. Save over 50% on an annual membership that protects you against future price increases for the life of the site.  It works out to about $3/day, not a bad price for some pretty terrific results. To sign up, CLICK HERE.

    For those who’ve recently joined as monthly, quarterly or semi-annual members, consider upgrading to an annual membership now.  Annual rates will revert to $1,650 when this promotion is over, and are slated to increase to $1,800 next month. 

    And, don’t forget, referring a new annual member will earn you (or, share it with them) a cool $300.  Or join with a friend and split it.  Either way, it’s my way of saying thanks for sharing the word.

    *  *  *  *  *

    Today marks the 30th session in a row where USDJPY’s Pennant Pattern will dictate the movements of the stock “market.”  USDJPY has not only bounced back into the Pennant, but has climbed back above the all-important 120.11 Fib level.  2015-10-05 USDJPY 60 0612Futures are loving it, with ES currently up 13.25 with 15 minutes to go before the cash open.  But, as usual, there is a limit to the amount of fun one can have on the upside. In other words, there’s a reason ES has stopped right where it has.

    continued for members

    (more…)

