

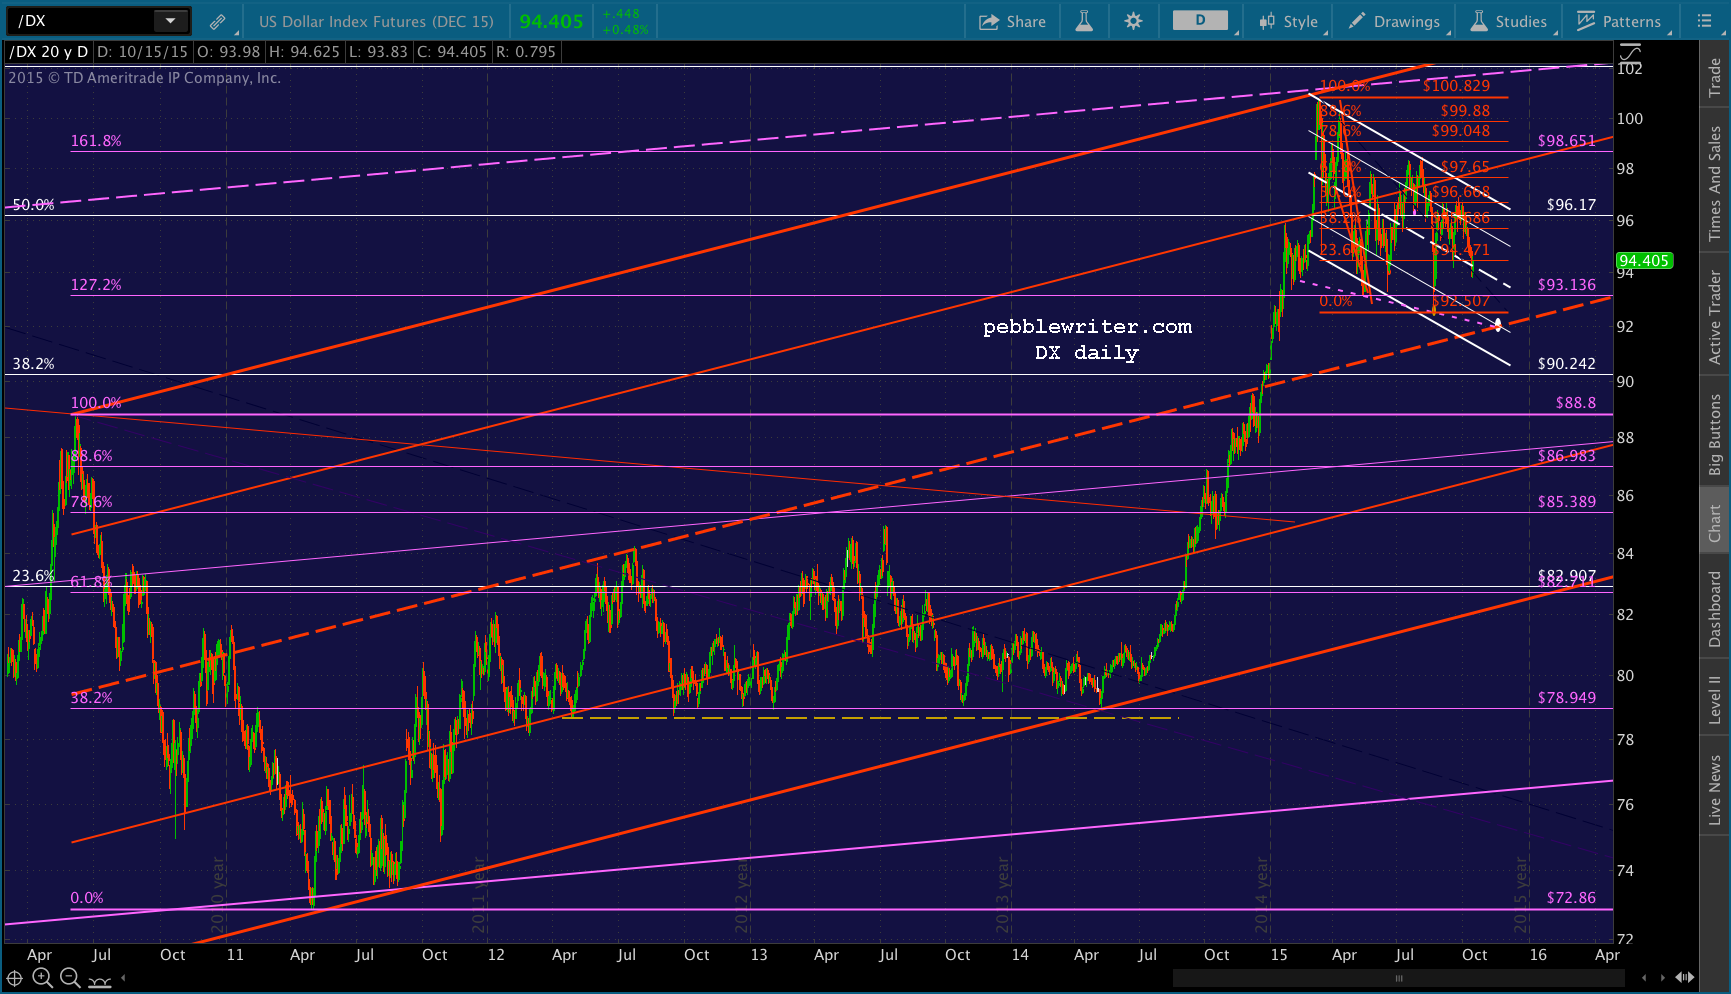
In our March 13 Update on DX, I noted that DX was approaching the 61.8% retracement of the drop between 2001 to 2008 and two key channel lines, writing at the time:
The white .618 intersects with two major channel lines… Should DX punch through, there’s much more upside. Otherwise, look for a correction in the very near future.
As fate would have it, March 13 itself was the high. DX didn’t go on up and tag the .618. Instead, it has been fading slightly ever since in a pattern that can’t decide between a flag pattern or a descending triangle. continued for members…
The pattern makes a lot more sense when seen in the context of the rising red channel from 2011, and the floor established under DX during 2012 and most of 2013.
 Like all the other major markets, DX is dancing to the yen carry trade’s tune. With stocks so dependent on an ever-rising USDJPY (falling yen), DX is establishing another floor — albeit a slightly declining one. Note the successively lower lows – the dotted purple line.
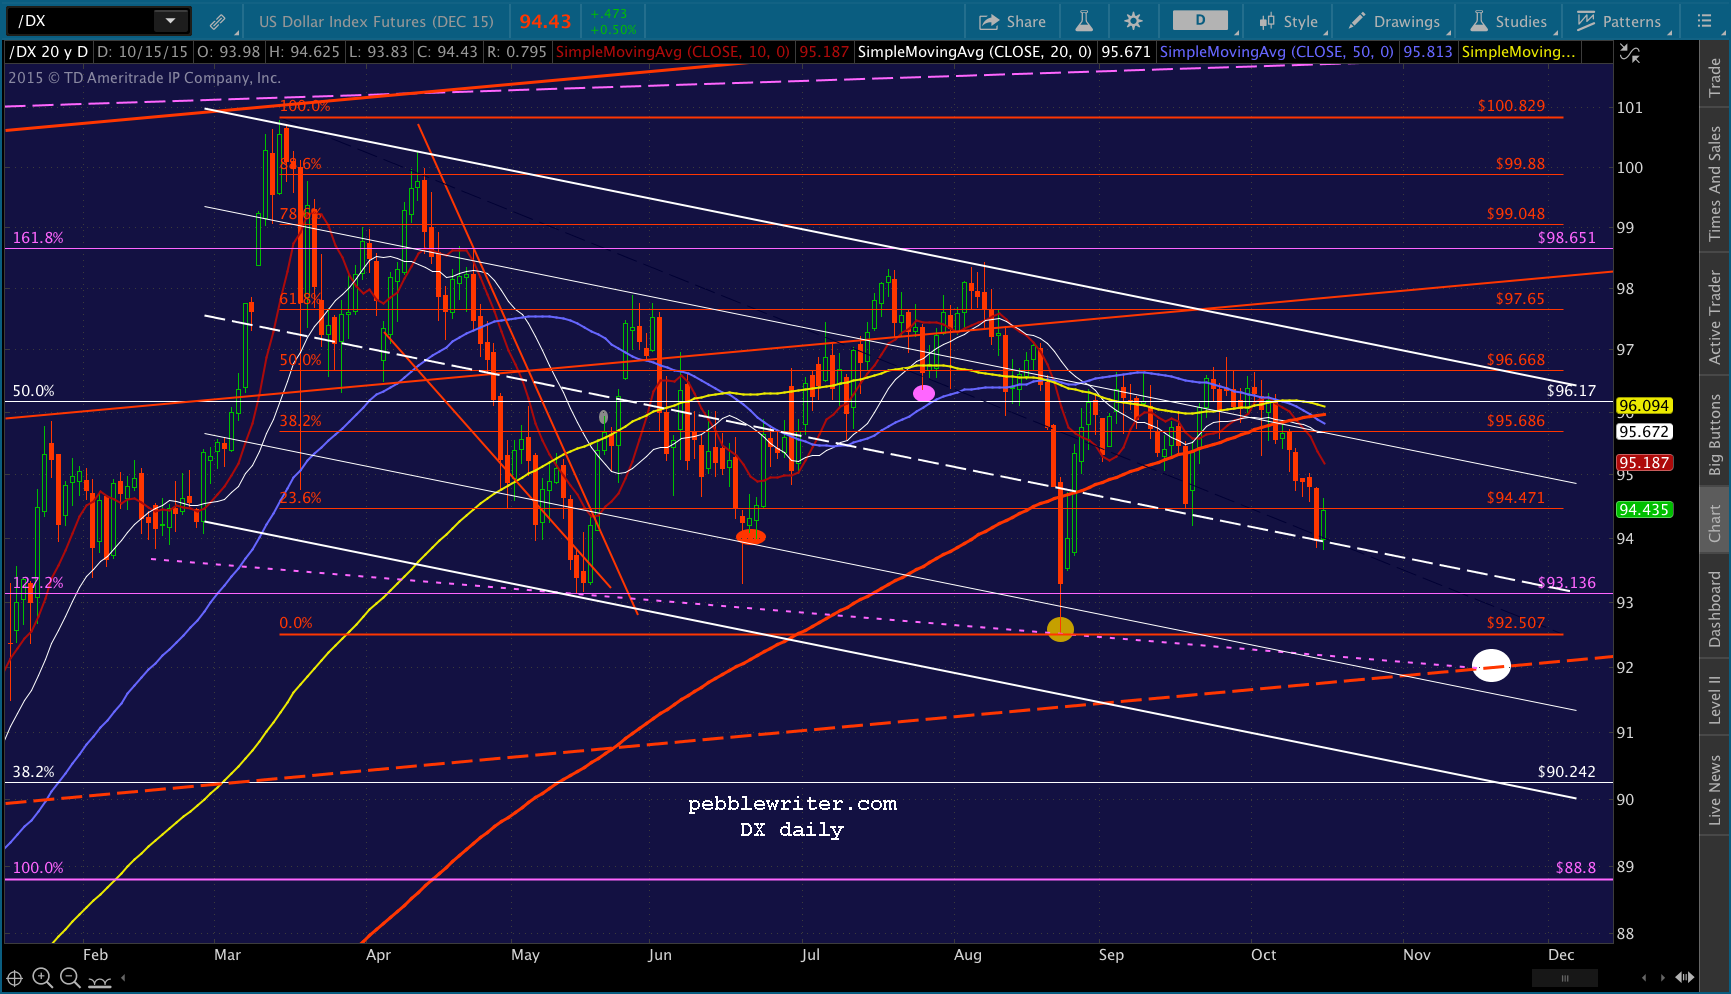 If the pattern continues, we would see the white channel midline yield to another test of this purple line — perhaps to intersect with the rising red channel midline around mid-November at 92ish.
This would imply a strengthening of the yen over the next month, which is hardly bullish for SPX, which is currently testing its Sep 17 highs in the midst of what has been (so far) a very sharp rally. Another collapse of DX would certainly present problems and open the door for SPX to decline to 1823.
On the other hand, GC just pushed above its SMA200 yesterday. It has failed to hold 4 previous attempts in the past year or so, and I suspect it will do so again. Each previous failure has meant at least a short-term bounce for DX and SPX, which is likely a week away from testing its own SMA200. I’d look for DX to reverse here and help SPX rally at least a little longer.
GLTA.