Month: March 2015

  • Charts I’m Watching: Mar 31, 2015

    The futures are off 8.25 just before the opening. The earlier sell-off reached 2062.25, but bounced off yesterday’s broken TL and channel bottom.

    2015-03-31-ES daily 0615CL has contributed, with a drop to the .500 and 1998 trend line overnight.  It continues the pattern of big drops/ramp jobs overnight to reset the intra-day ramp jobs/drops.

    Don’t be surprised if we get an intra-day bounce to the white .382 at 48.63 if this morning’s equity weakness accelerates at all.2015-03-31-CL v DX 60 0530And, EURUSD’s rising purple channel is a distant memory as the pair fell through and backtested the falling red channel midline.

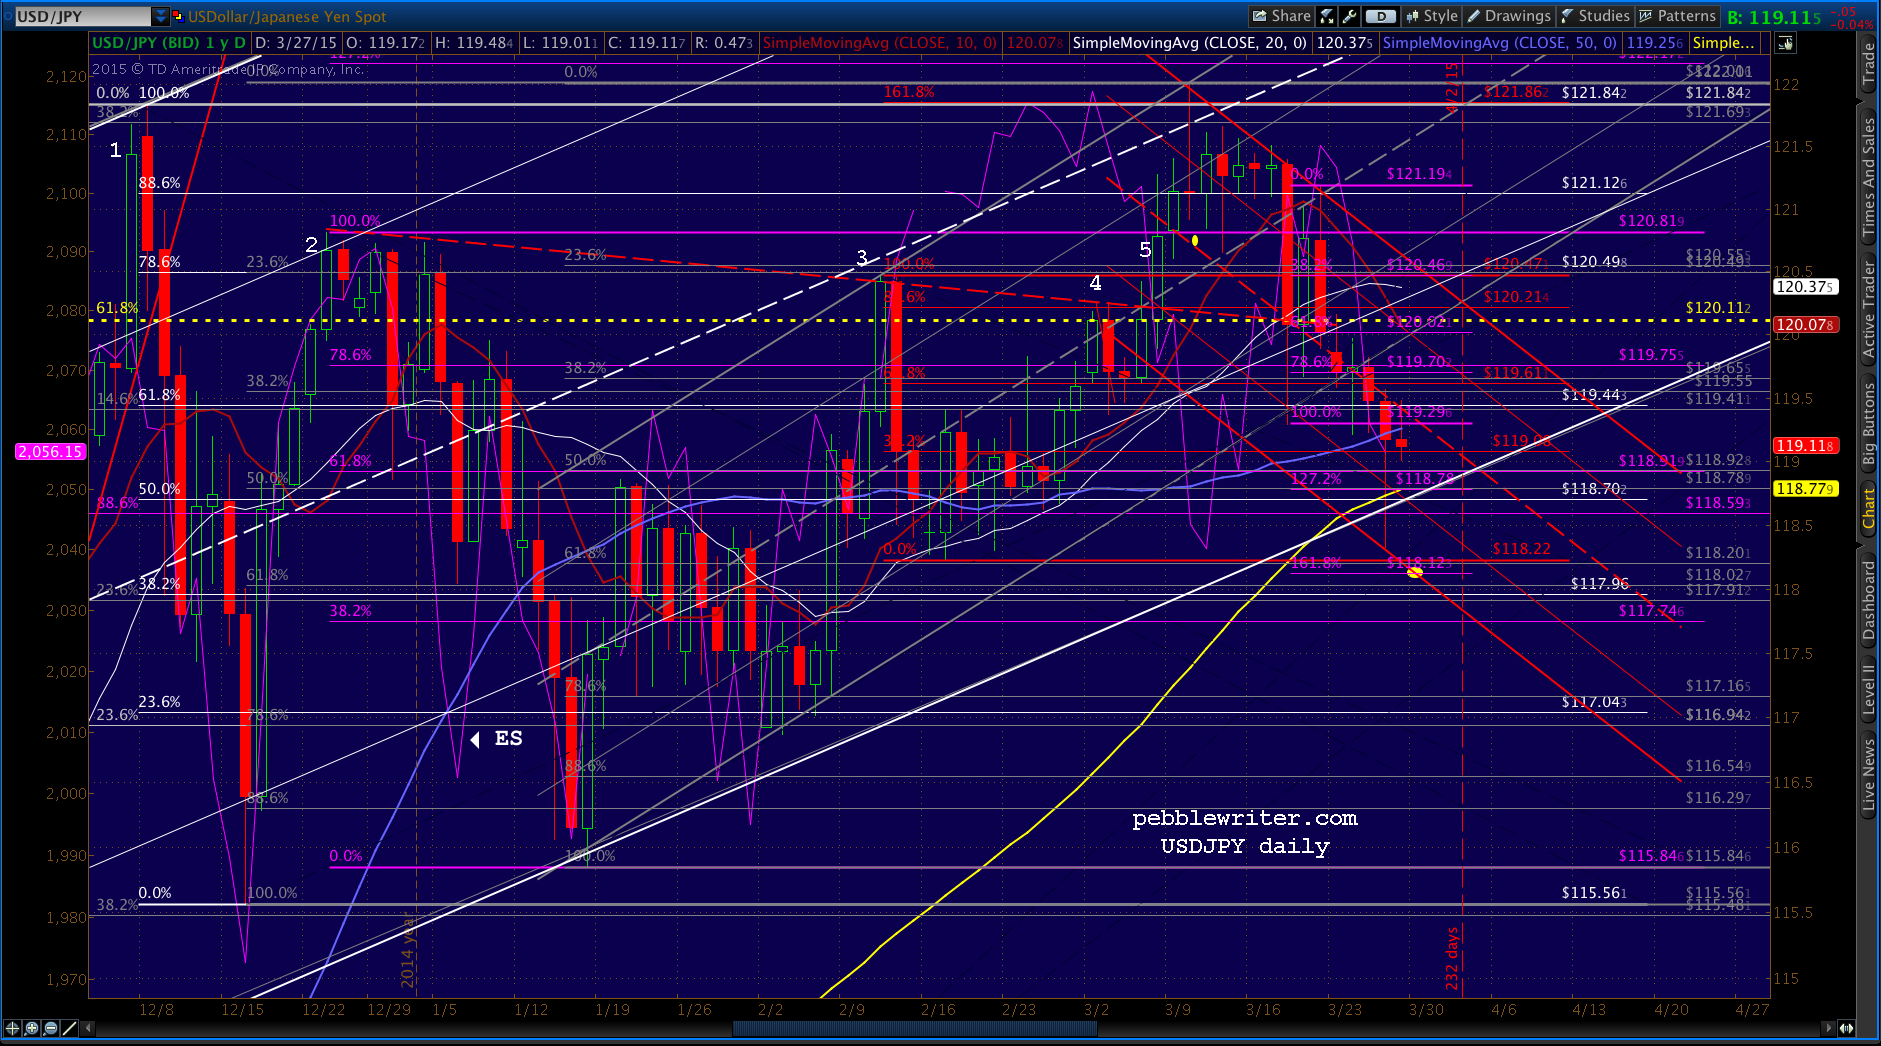
    2015-03-31-EURUSD 60 0707USDJPY, having enabled SPX to break trend yesterday, ran out of steam at the .618 as expected.  It should hang around current levels — at least until after the month/quarter end today.  2015-03-31-USDJPY daily 0639Our analog remains in force. For complete details and the forecast through July 2015, see yesterday’s wrap up: New Analog: Part II.  For more on analogs in general, CLICK HERE.

    continued for members(more…)

  • Turning Points

    We had a particularly good run in 2012, successfully identifying each of the major tops and bottoms with a combination of Harmonics, Chart Patterns and Analogs.

    2012 tops-and-bottomsLinks to the actual posts discussing and identifying each turning point can be found below.

    ♦   ♦   ♦

    April 2 top, posted in All The Pretty Butterflies:

    Butterfly #3 — my personal favorite — begins at 1347 and Point B ((at an intra-day high of 1292) is 4 points above its ideal of 1288.74.  The closing price of 1284 was 4 points below.   This particular pattern completes at 1421.05 — just 1.90 from the Mar 27 high of 1419.15. Could 1419 have been the end of this wave?  You bet.

    June 1 bottom, posted in Why I’m Buying:

    …it doesn’t hurt that we just completed a bullish Crab pattern at the bottom of a pretty convincing looking falling wedge with the SMA 200 just below current prices at 1284.56.  So, I not only lifted my remaining stops as the market fell this morning, I am buying more here at 1287.

    September 14 top, posted in The World According to Ben:

    Meanwhile, SPX is nearing our 1472 target. I will ease some stops into the equation as we approach it, as I’d like to remain long for as long as possible.  This is a 35 point gain since we went long yesterday at 1437 with the Fed’s announcement… Going ahead and pulling the plug on my longs here at 1474.

    November 16 bottom, posted in Charts I’m Watching, Nov 16:

    And, there it is.  We just tagged both targets 1344 and 1346 in one fell swoop.  If you’re not already, it’s time to get long. I’m back in with both feet this time, stops at 1339.99 wouldn’t be a bad idea.

    December 18 top, posted in Charts I’m Watching, Dec 18:

    SPX just tagged the .786 mentioned above, pushing just beyond 1446.44.  I’m closing my intra-day longs (again) here at 1447.


  • A New Analog: Part II

    We left off Friday [see: A New Analog] discussing the role USDJPY played during the severe 2011 correction, and the way it subsequently provided an assist whenever necessary during SPX’s recovery.

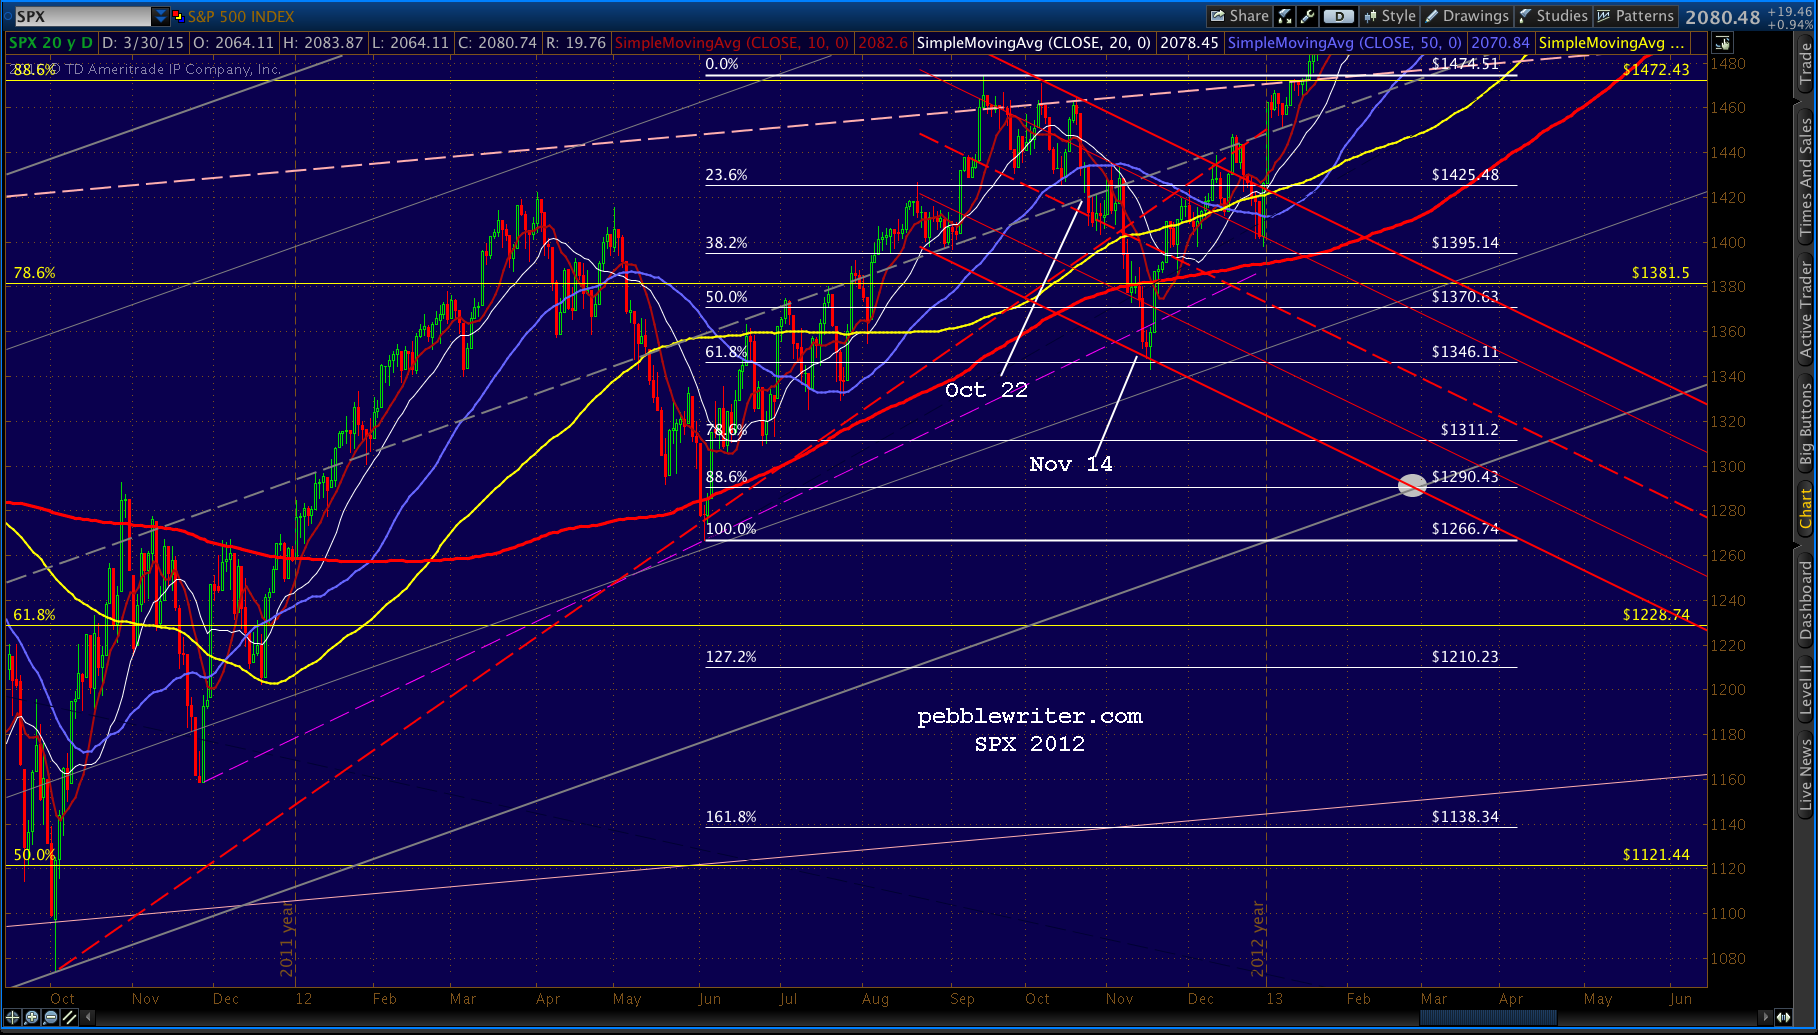
    2015-03-27-USDJPY saves worldUSDJPY’s first break above the SMA100/200 on October 22 was almost enough to keep SPX’s trend (red, below) from Oct 2011 alive.  Two weeks later, when USDJPY dipped back below the SMA200, SPX broke down further — falling below the purple TL of support.

    If left to its own devices, the S&P500 would surely test the gray channel .236 or even bottom — which meant posting a loss for the year.  It was the last thing Wall Street needed.

    The second push above the SMA200 on Nov 14 did the trick.  Having reached a .618 retracement, SPX popped back through all its broken moving averages and scampered back up to the gray channel midline — which it then backtested before falling off in the final week of the year.

    At this point, it looked likely to head down after the first of the year and complete a Gartley or Bat Pattern at 1311 or 1290.  After all, it never tested the channel bottom or even .236 line following that bearish plunge in October/November.

    2015-03-30 SPX 2012 MAsAnd, it probably would have if USDJPY hadn’t gone on a tear over the low-volume holidays — gapping higher on Dec 26 after topping both the Mar 2012 and then the Apr 2011 highs, and gaining 4.2% in only a week.

    SPX, in turn, shot up 64 points (4.6%) in two days (Dec 31 and Jan 2.)  USDJPY kept the pressure on until the gray channel midline and then the 1474 high from Sep 14 were broken.

    To anyone with any charting experience, that Nov 16 low looked as phony as a three-dollar bill, as did ramping SPX up through major resistance on the lowest volume days of the year.

    But, it left an interesting opportunity for the bulls.

    continued for members(more…)

  • Charts I’m Watching: Mar 30, 2015

    CL moved slightly beyond our target at the bottom of the rising channel to test the trend line from 1998.  It got a bounce there, but hasn’t broken above the LT falling red channel midline.  We’ll look to see whether or not it holds at backtesting the broken red channel bottom.2015-03-30 CL v DX 60 0600Meanwhile, EURUSD’s rising channel has broken down again.  The first resulted in the falling red midline being back tested — a net positive — so the bulls need a quick reversal here if the uptrend is to continue.

    2015-03-30 EURUSD v ES 60 0600USDJPY continued its bounce off the SMA100, but only got as far as backtesting the broken gray channel just shy of the yellow .618 at 120.11.

    2015-03-30 USDJPY daily 0600DX is strengthening as EUR and JPY fall off, and has almost reached Friday’s target.  It looks like too little, too late at this point.  2015-03-30 DX v ES 60 0600

    With the futures up 11 points, it appears likely to continue the white channel lower.  But, with the other currencies poised for a reversal, I’m not so sure.  It’s a good setup for a pop and drop for equities this morning.  But, then again, tomorrow’s the last day of the month/quarter…

    continued for members(more…)

  • A New Analog: Mar 27, 2015

    Part I of a two-part post.  Continued in Part II HERE.

    *  *  *  *  *

    SPX held our initial downside target of 2048.26 yesterday.  But, as we detailed in the members’ section of The Middle East Heats Up, the trend should continue lower.   CL helped overnight by backing off the .786 Fib line as well as the purple channel midline.2015-03-27-CL 60 0600And, USDJPY, while it rebounded strongly off an important channel bottom, isn’t done with its decline.

    But, our most important charting yesterday involved moving averages.  Several were tagged yesterday, which led me to discover an analog that, should it play out in the coming days, could lead to some significant downside.

    It was the discovery of an analog that allowed me to accurately forecast the 22% correction between July and October 2011 to the very day and dollar [see: Why do Analogs Work?]  So, analogs are always interesting to me.

    First, both SPX and ES closed below their 100-day moving averages (SMA100.)

    2015-03-27-ES daily 0621And, USDJPY tagged its SMA100 for the first time in over seven months.

    2015-03-27-USDJPY daily 0621Which led me to discover some very interesting coincidences.  As long-time readers know, I don’t believe in coincidences.

    continued for members…
    (more…)

  • The Middle East Heats Up: Mar 26, 2015

    After officially entering the Yemen conflict, Saudi Arabia has blockaded of the Red Sea Strait. Oil has officially left the falling white channel, but reversed at the .786 Fib…2015-0326 CL v DX 0639…and DX’s response has been just as muted — so far.  But, it’s going to have to rise appreciably if they’re going to stuff oil back in the box where they need it. — which, for now, means in a range between 44.45 and 52.48.

    The falling white channel .786 line should do, with the channel top (where it intersects with the rising purple channel .786 at 98.5ish?) available if needed.  Remember, the purple channel is the more dominant, dating back to Aug 2014 when USDJPY broke out.

    The problem TPTB face is that they’ve used algos that incorporate the occasional bounces in oil to drive stocks higher for the past several months. Witness the many instances we’ve documented where prices shot up during the session, only to be reset overnight.

    We’ve discussed the need to delink SPX and oil now that it’s in a desirable sweet spot.  The Middle East situation might just do the trick, since higher oil prices will now be linked to a increased risk.

    For a discussion of the rationale behind all of this, see: Those Wacky Central Bankers.  Just slip on a tin foil hat, first.  And, remember, just because they’re manipulating the “markets,” it doesn’t mean you’re not paranoid.

    2015-0326 DX 60 0619The S&P futures were off as many as 23 points overnight, but are currently back to the SMA100 at 2044.

    2015-0326 ES daily 0619Yesterday’s action saw SPX plunge through each of our downside targets in fairly quick succession, finally landing precisely at the one that left traders in the biggest quandary.  From yesterday’s members section:

    The most irritating target would be the TL off the Oct 15 low — currently around 2060.3.  It also stopped the Feb 2 and Mar 13 declines, and would be a stick in the eye to everyone who considered Bullard’s October 16 stick save dirty pool.

    Yesterday’s downside targets remain in place.

    continued for members(more…)

  • Charts I’m Watching: Mar 25, 2015

    Fascinating interplay between the yen, the euro and the dollar today.  Biggest problem for bulls continues to be the broken rising white channel.

    2015-0325 USDJPY 60 0855Look for any more downside to be relegated as much as possible to the after-hours to offset the likely overnight decline in CL, which is ramping like crazy to try and stop SPX’s plunge.  There’s a nice backtest available at the close where the red midline crosses the white channel bottom at 119.80.

    They had to run CL up through two channel tops — one of them from Jun 2014!  Same thing happened on Mar 5, and they had to ramp USDJPY back above the .618 at 120.11 to cover CL’s retreat.

    2015-0325 CL ES 60 1113

    SPX tagged our downside target [see: Mar 20 Update] of 2089 early this morning.  A meager bounce saw it slide through support at the SMA50 to within a point of our final target of the day: 2066-2068.2015-0325 SPX 15 min 1054The EURUSD is lending a hand as best it can, but badly needs a breather.

    2015-0325 EURUSD 60 1113

    Breaking the TL from Mar 12 definitely did some damage.  What does it do to our forecast?

    continued for members(more…)

  • Update on EURJPY: Mar 25, 2015

    Since we spend so much time looking at the yen and the euro compared to the US dollar, it made sense to compare the two to one another.  The yen has been the primary driver of rising stock prices for several years, now.

    Will the ECB’s much heralded entry of the euro into currencies’ “race to the bottom” change the equation?

    2015-0325 EURJPY wkly 0600As seen above, the pair has bounced back and forth in a very broad channel ever since the euro’s inception.  In the early years of 95-98, the euro gained at the yen’s expense as SPX enjoyed an extended bull market.

    When EURJPY topped out in 1998, SPX fell almost 20% over the next month, but recovered to make new highs 18 months later in Mar 2000.  This began a period of inverse correlation that would last until Oct 2002, when SPX finally hit bottom after falling nearly 50%.

    Quick note to SPX watchers: the index just tagged our 2089 target. If it doesn’t hold, the next downside target is 2081.72 and, below that, 2066-2068.  Otherwise, yesterday’s forecast (members’ section) remains intact.

    Once it did, a strong positive correlation resumed until EURJPY peaked again in 2007.  This time, stocks peaked at about the same time.  As SPX neared a 300-pt decline, EURJPY shot up to a slightly higher level before joining in the crash.

    2015-0325 EURJPY wkly CU 0600EURJPY bottomed out in Jan 2009, SPX in March. The correlation stayed fairly positive except that EURJPY’s two waves lower were matched by much smaller corrections in SPX — which was beginning to feel the full effects of the Fed’s QE.

    2015-0325 EURJPY daily 0730When SPX (along with USDJPY) bottomed out in Oct 2011, it touched off a run of extremely strong positive correlation that lasted until December 2013.  EURJPY topped out and began a steady decline that lasted into September, while SPX ratcheted ever higher.

    Finally, on Sept 19, EURJPY reversed at the top of a triangle (below, in yellow) that had been forming since Dec 2013.  Only, this time, it didn’t stop at 136 as it had several times before.2015-0325 EURJPY daily 0915

    That momentary lapse, that brief bout of yen strengthening, was enough to send SPX 200 points lower by Oct 15 — a collapse that was only arrested by the announcement on Oct 31 that the Bank of Japan would extend and greatly expand its QQE and triple its stock buying.

    EURJPY shot up almost 12% over the next seven weeks — which was all stocks needed in order to rally into the end of the year.  Since mid-December, however, it’s been a different story.

    The ECB officially got into the currency debasement game. A weaker euro sent EURJPY tumbling by nearly 15% by Mar 13, following the steep falling red channel shown in detail below.2015-0325 EURJPY daily 0915 CUEURJPY’s four bounces have produced bounces in SPX of 120, 71, 124 and 69 points.  But, one gets the feeling that the rubber band is becoming rather stretched.  In the past, SPX has eventually “caught down” with a plunging EURJPY.  That falling red channel portends more of the same.

    The USDJPY has already broken down from a very well-defined channel that dates back to Jan 13 — signalling a strengthening yen.2015-0325 USDJPY 60 0855And, though EURUSD experienced a very fortuitous bounce after having fallen through the bottom of two channels of its own, the ECB is working to cheapen the common currency even further.  The next major support is almost 10% lower.

    2015-0325 EURUSD daily 0940In other words, there’s little reason to think that EURJPY will do anything other than continue its freefall in the falling red channel.  How much longer can the divergence between it and SPX go on?  Time will tell whether we’re in a 2000 or 2007-style bubble.  Though, currency manipulation isn’t the only tool at central bankers’ disposal.2015-0325 EURJPY daily 1000The rising red channel midline is still below at around 125.47.  And, just underneath that, the white .500 Fib line at 121.93 might offer some support.

    Below that, however, the next major support isn’t until the white Fib crosses the falling purple channel midline and rising red channel line at around 115.36 in late April/early May.  And, the biggest target is down around 106 later this summer.

    It should be an interesting summer.


    continuing

  • Charts I’m Watching: Mar 24, 2015

    Note:  RUT and COMP charts were updated last night.  Check them out.

    *  *  *  *  *

    Since reaching  our Mar 17 upside target and generating a sell signal last Friday, SPX had gone virtually nowhere  — until the last few minutes of yesterday’s session, when it suddenly gave up 8 points or so.2015-0324-SPX 60 0600It was a tug of war all day, with rising oil and EURUSD providing cover for a falling USDJPY.2015-0324-USDJPY 60 0618There are three troubling developments for bulls this morning.  As the chart above shows, USDJPY’s rising white channel has broken down — at least for the moment.  And, CL has reached the top of the falling white channel.

    2015-0324-CL daily 0622Last, DX is bouncing at our downside target.

    2015-0324-DX 60 0622The implications of all the above are bearish, and we should see some follow-through in SPX today.

    2015-0324-SPX daily SMAs CU 0600There are several potential targets. continued for members(more…)

  • Update on COMP: Mar 23, 2015

    When we last reviewed COMP on Oct 14, 2014, it had flouted so many chart patterns and Fibonacci retracements that the chart was as clear as mud.  Note from the comments that we had already taken to putting quotation marks around the word “market” — a very good indication of our frame of mind at the time.

    The close-up reveals the Sep highs didn’t quite reach the .886, and the latest low didn’t quite reach the .618.  Either could still be in play, depending on the overall “market’s” intentions.

    2014-10-14-COMP daily 1300

    This was nothing new.  The long-term chart contains many such breaks with charting convention.  Note the general absence of reversals at major Fib levels.

    2015-0323 COMP wkly 1300

    The last time it had done anything very conventional, it bounced at the SMA200 on Apr 15, 2014 — which happened to line up nicely with a trend line from the two previous lows.

    So, we paid attention when six months later — on Oct 13 — it closed beneath the SMA200.  We really sat up and paid attention when it continued to plunge below the SMA200 and the trend line from 2009.

    We weren’t the only ones.  Fed president Jim Bullard got a frantic call from someone who informed him of the bearish developments and suggested he get himself on TV pronto — which he did.

    At 1:30 into the clip above, he suggests the Fed might pause the taper if the “inflation expectations” — wink, wink — didn’t remain near their target.  That’s all the “market” needed to hear.

    2015-0323 COMP daily 1300Three sessions later, the plunge below the 5+ year TL was forgotten and COMP shot above the .886 to new highs.

    Since then, it has constructed a TL connecting four distinct highs that reaches the former all-time high around mid-April.  It has also tested the SMA100 four times, holding even when it closed below it.

    The rising wedge is fairly well-formed.  But, we wouldn’t bet on it playing out.  Consider that the last two highs have slightly exceeded a TL (solid red, above) connecting the much more important highs of 2004 and 2007.

    Of all the charts out there, COMP has been one of the most dysfunctional.  This might or might not change anytime soon.  It will depend completely on the extent to which Bullard and his central banking homies leave the “markets” alone — if ever.