

After officially entering the Yemen conflict, Saudi Arabia has blockaded of the Red Sea Strait. Oil has officially left the falling white channel, but reversed at the .786 Fib… …and DX’s response has been just as muted — so far. But, it’s going to have to rise appreciably if they’re going to stuff oil back in the box where they need it. — which, for now, means in a range between 44.45 and 52.48.
The falling white channel .786 line should do, with the channel top (where it intersects with the rising purple channel .786 at 98.5ish?) available if needed. Remember, the purple channel is the more dominant, dating back to Aug 2014 when USDJPY broke out.
The problem TPTB face is that they’ve used algos that incorporate the occasional bounces in oil to drive stocks higher for the past several months. Witness the many instances we’ve documented where prices shot up during the session, only to be reset overnight.
We’ve discussed the need to delink SPX and oil now that it’s in a desirable sweet spot. The Middle East situation might just do the trick, since higher oil prices will now be linked to a increased risk.
For a discussion of the rationale behind all of this, see: Those Wacky Central Bankers. Just slip on a tin foil hat, first. And, remember, just because they’re manipulating the “markets,” it doesn’t mean you’re not paranoid.
 The S&P futures were off as many as 23 points overnight, but are currently back to the SMA100 at 2044.
 Yesterday’s action saw SPX plunge through each of our downside targets in fairly quick succession, finally landing precisely at the one that left traders in the biggest quandary. From yesterday’s members section:
The most irritating target would be the TL off the Oct 15 low — currently around 2060.3. It also stopped the Feb 2 and Mar 13 declines, and would be a stick in the eye to everyone who considered Bullard’s October 16 stick save dirty pool.
Yesterday’s downside targets remain in place.
continued for members…
We should see support at the white .886 at 2048.26. But, should that break down, the red .618 at 2033.88 is the next target.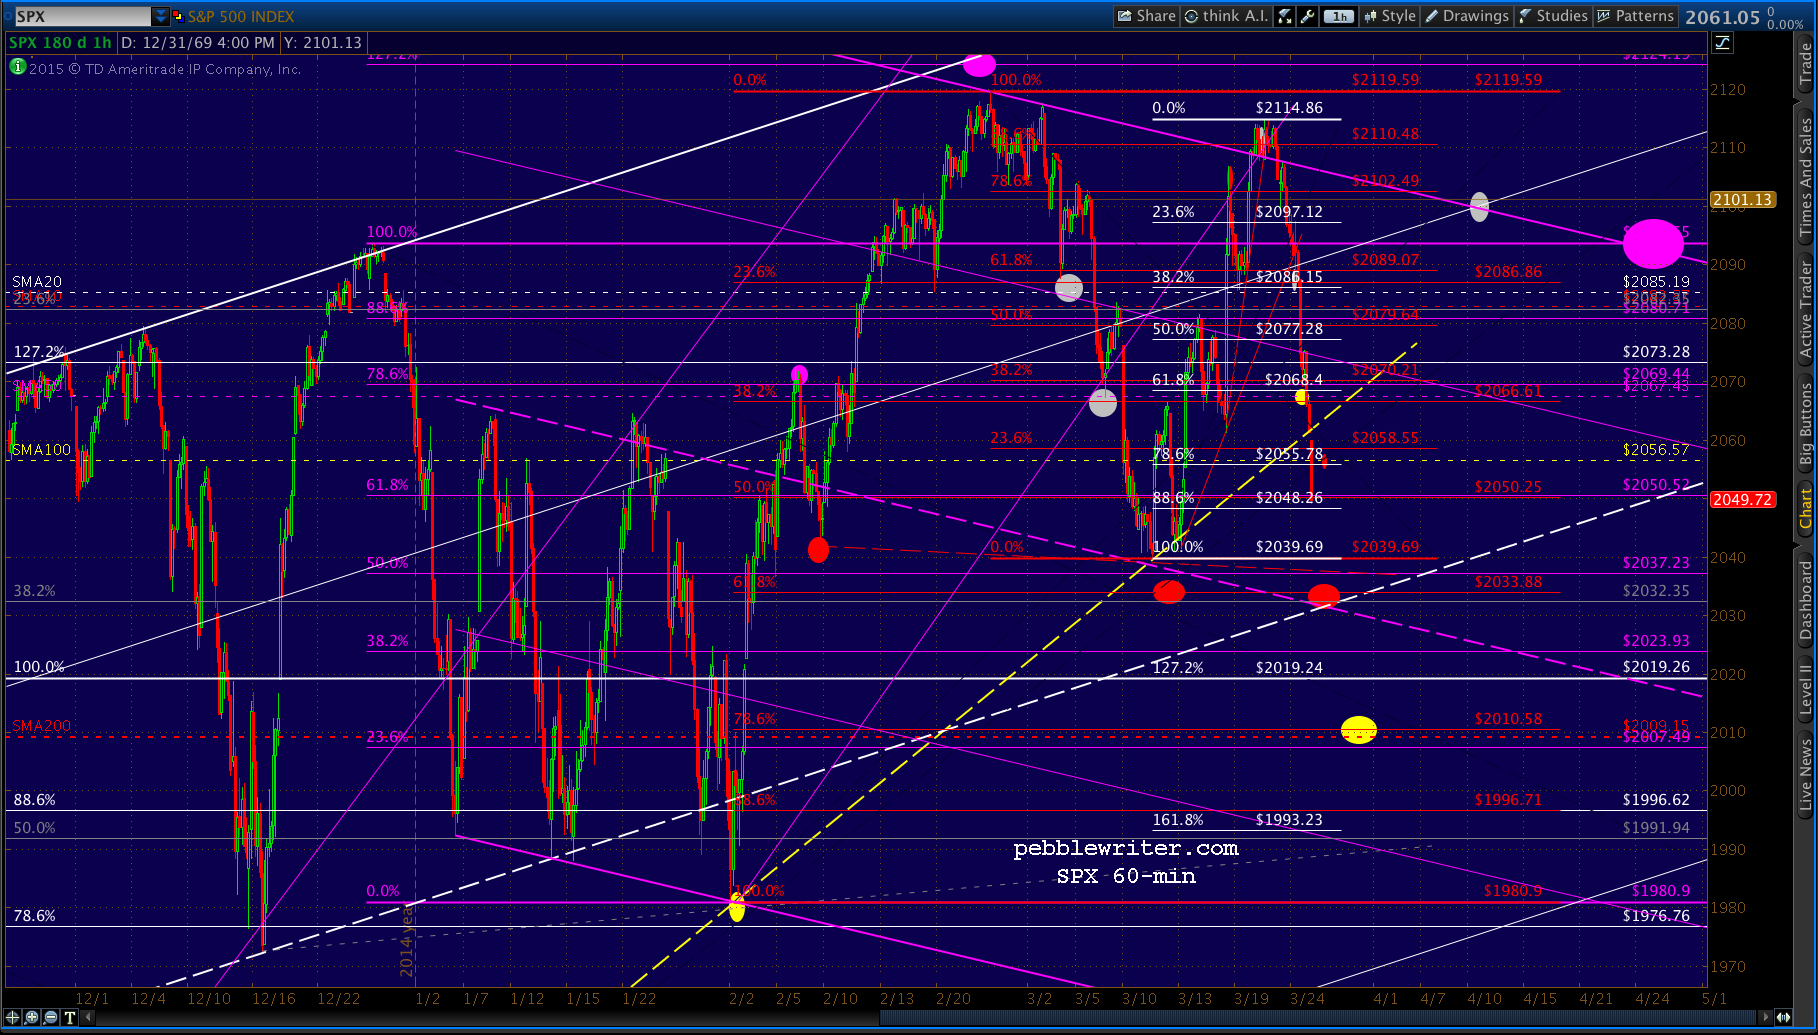 The plunge protection team is out in force today, trying to at least slow the descent. But, 2033 (red target) is a golden opportunity for more meaningful support going forward — the white midline.
As we discussed yesterday, it’s also the falling purple channel midline. And, if the decline isn’t arrested, it would be the purple channel guiding prices lower.
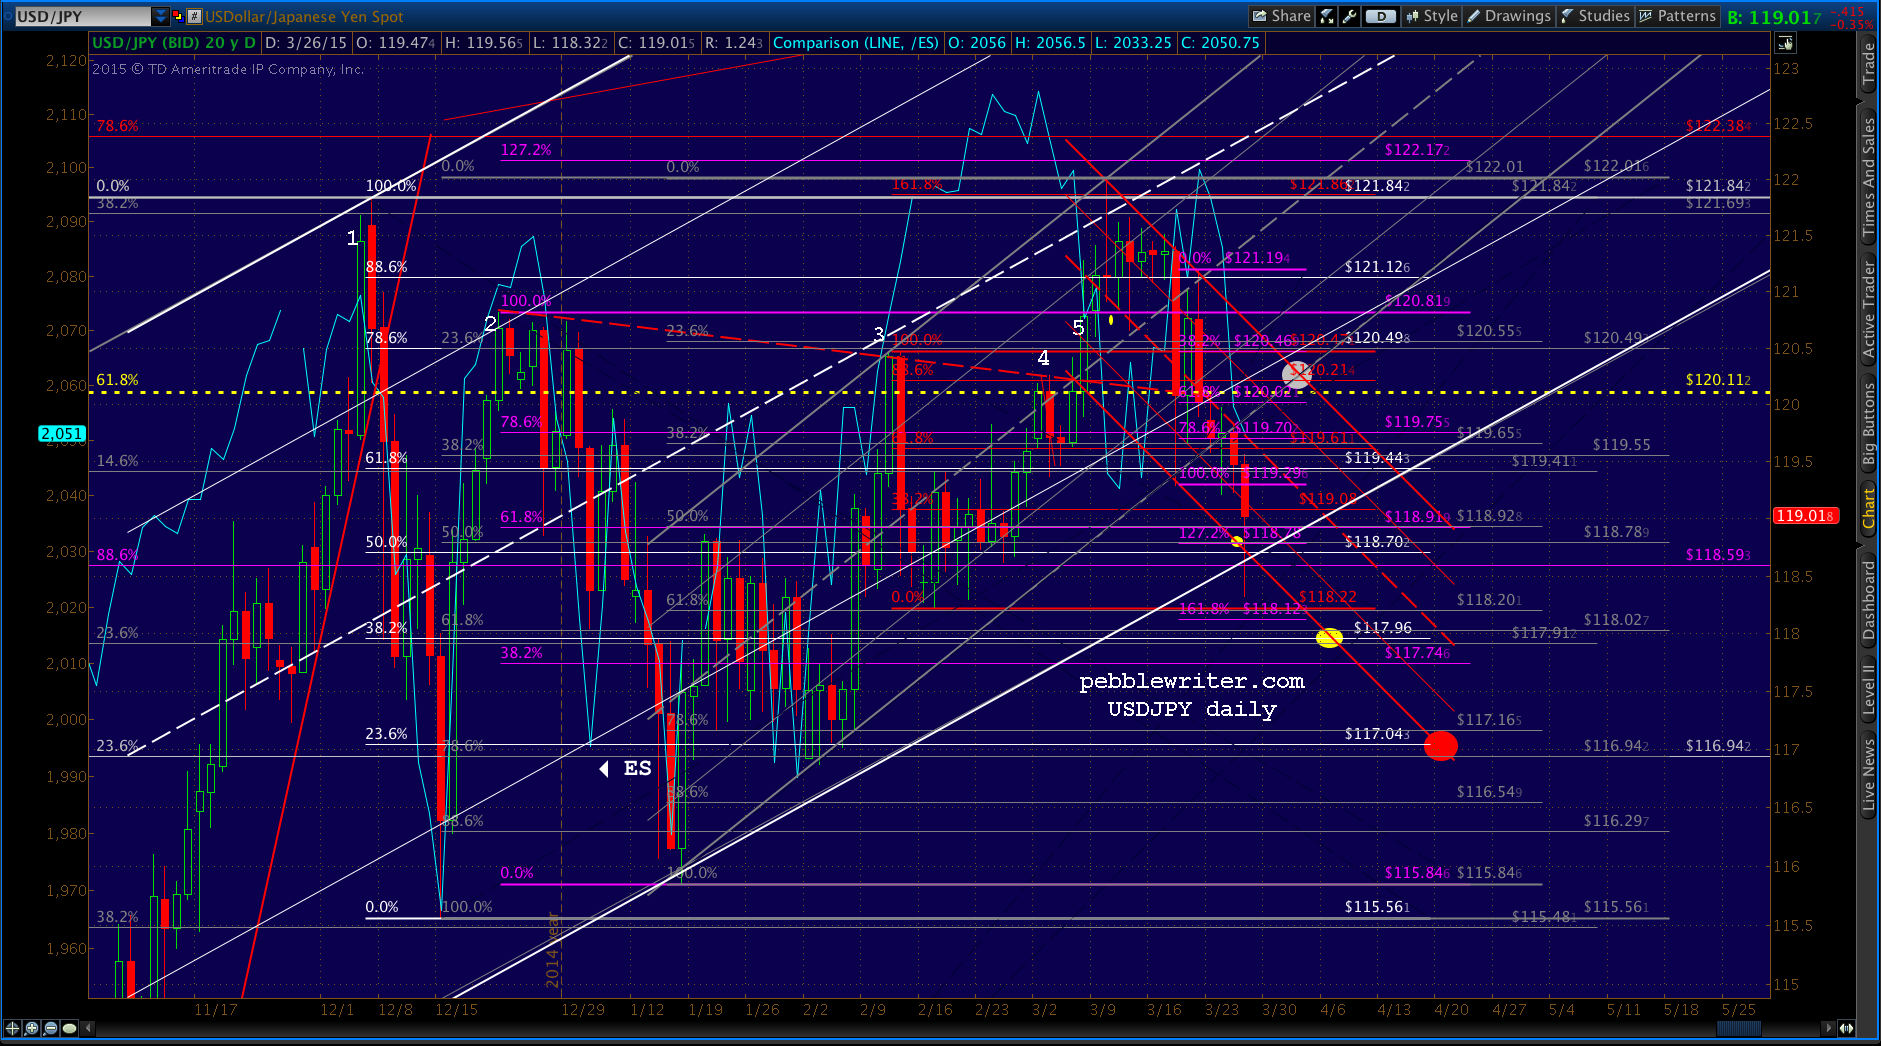
USDJPY almost reached a .618 retrace of the rise from Dec 16 before being pressed into service to prop up stocks.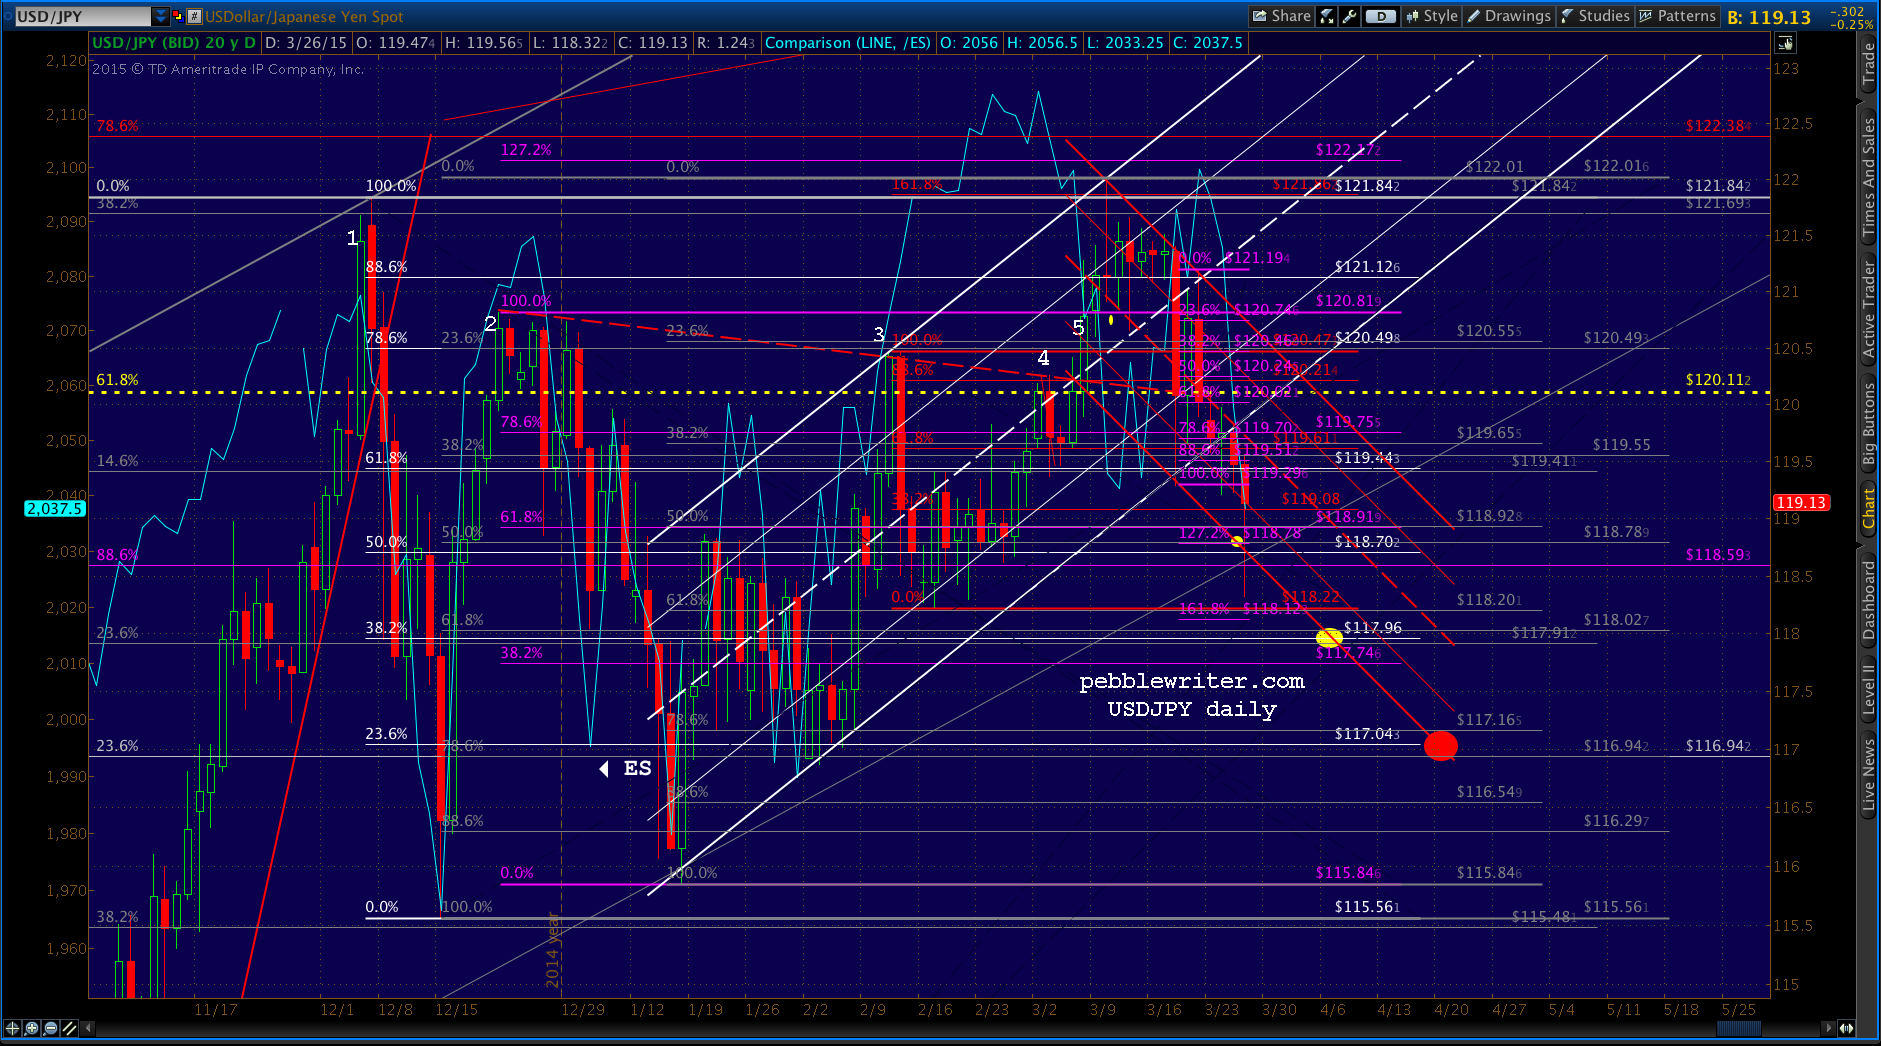 As can be seen on the bigger picture, this morning’s plunge tagged the .786 line of the (wholly untrustworthy) gray channel from 2012. I say untrustworthy due to the fact that its lines have been violated multiple times — the most recent being last summer just prior to the breakout that made SPX 2000 possible.
 The tricky thing about SPX 2033 is that it technically completes the potential H&S Pattern we identified a couple of weeks ago. The red neckline is still on the chart, though the right shoulder that was constructed (in order to avoid completing the pattern) makes the entire pattern fairly grotesque looking.
Looks like 2048 is holding for now, but don’t be surprised if they run SPX down to 2033 at the close in order to bounce it back up overnight when things are much more easily manipulated.
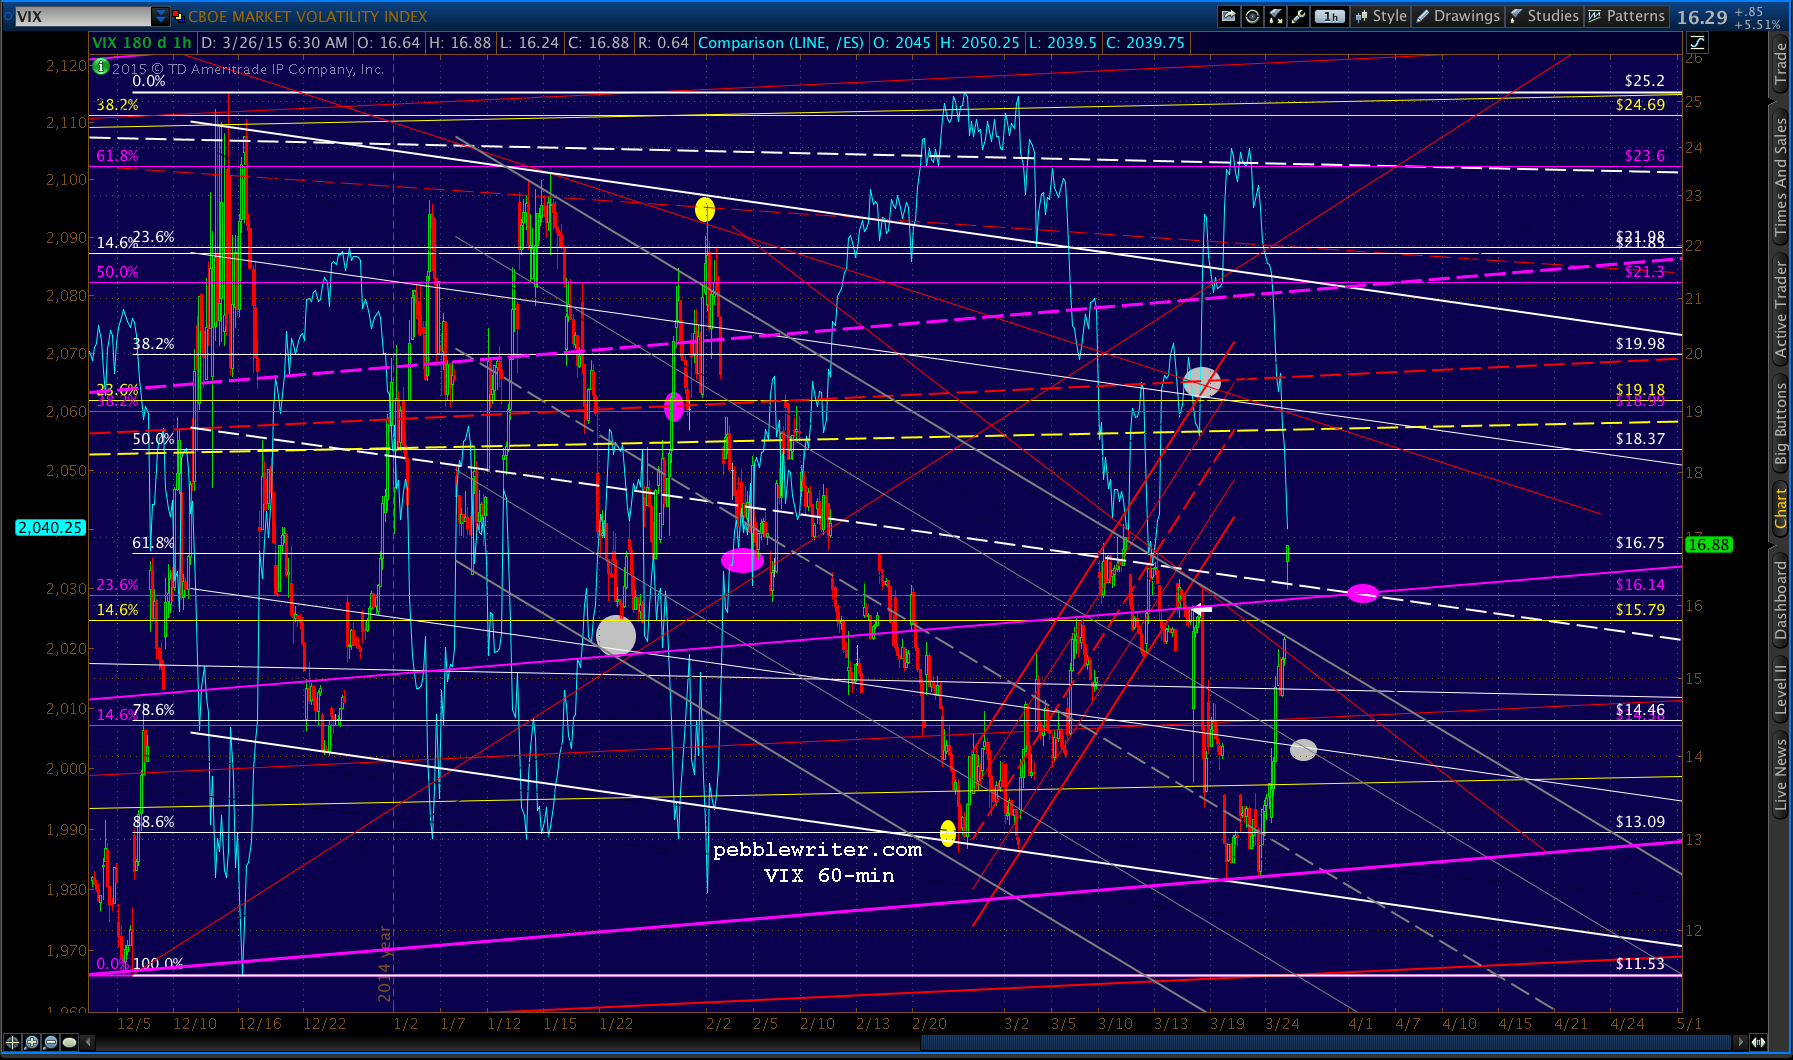
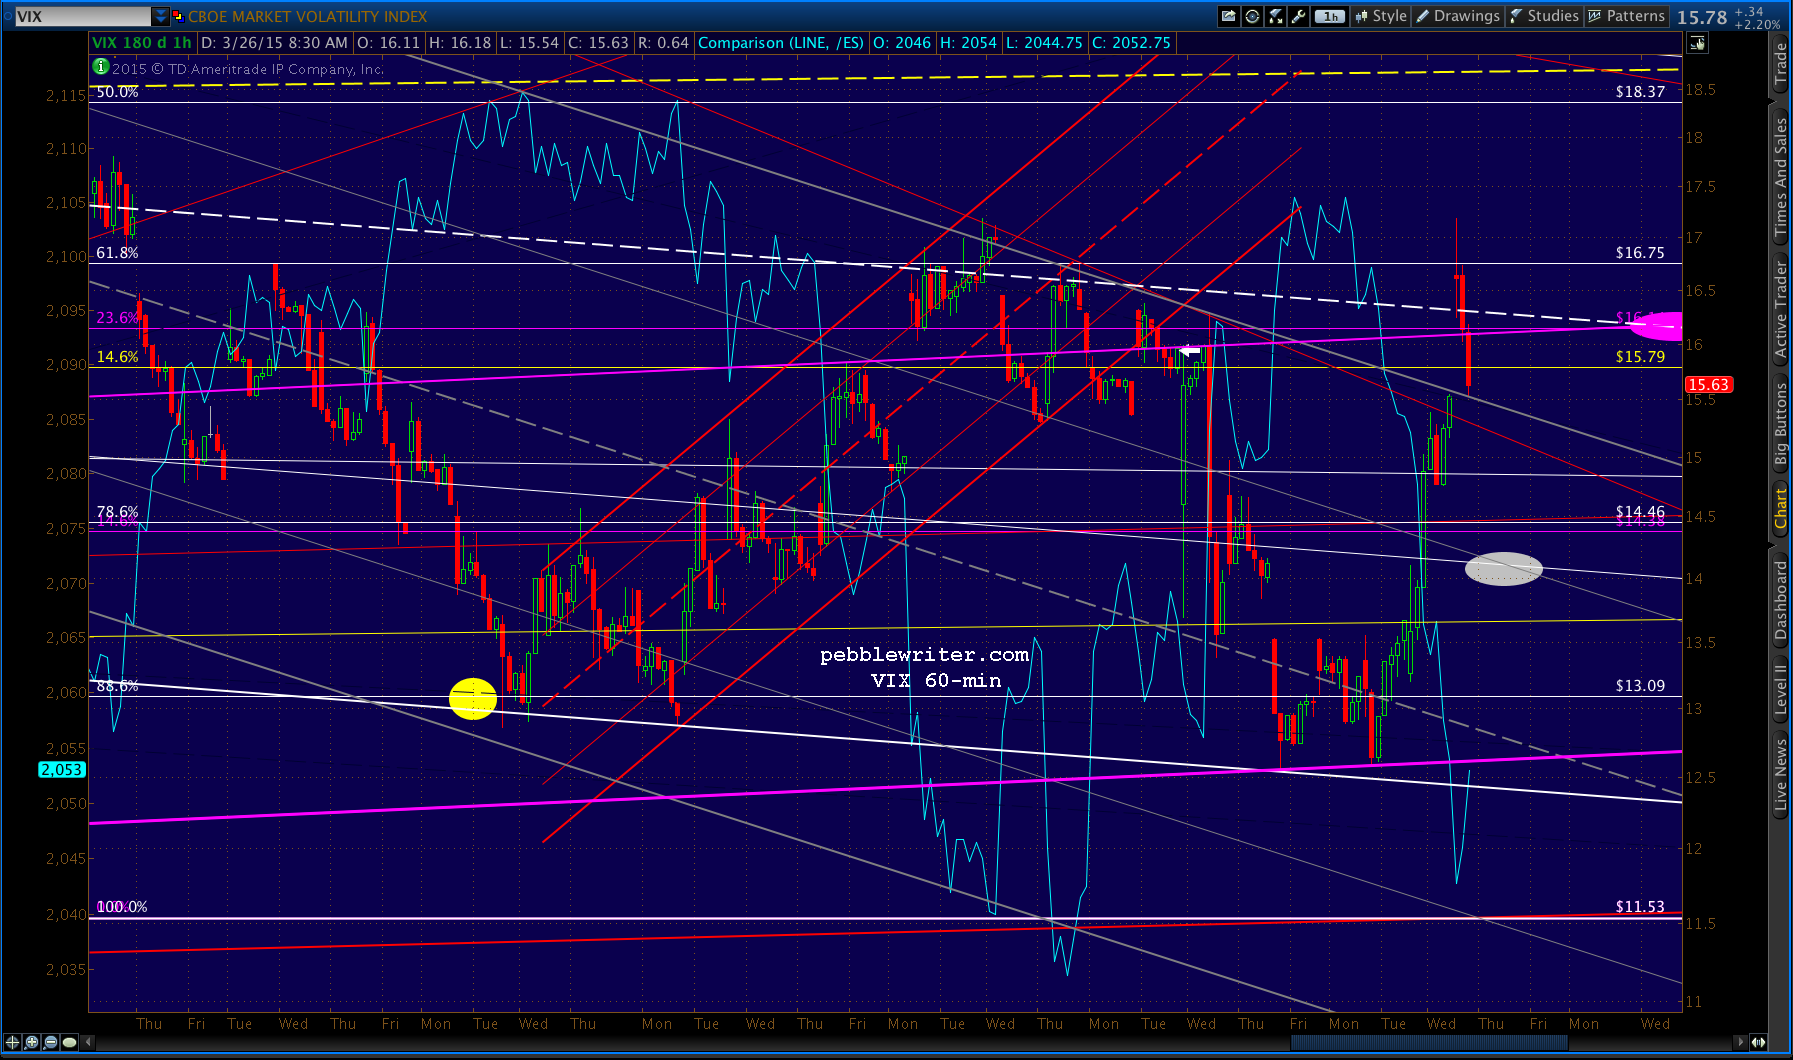
VIX is strongly suggesting more downside. Note it gapped up through the white channel midline this morning.
 UPDATE: 11:30 AM
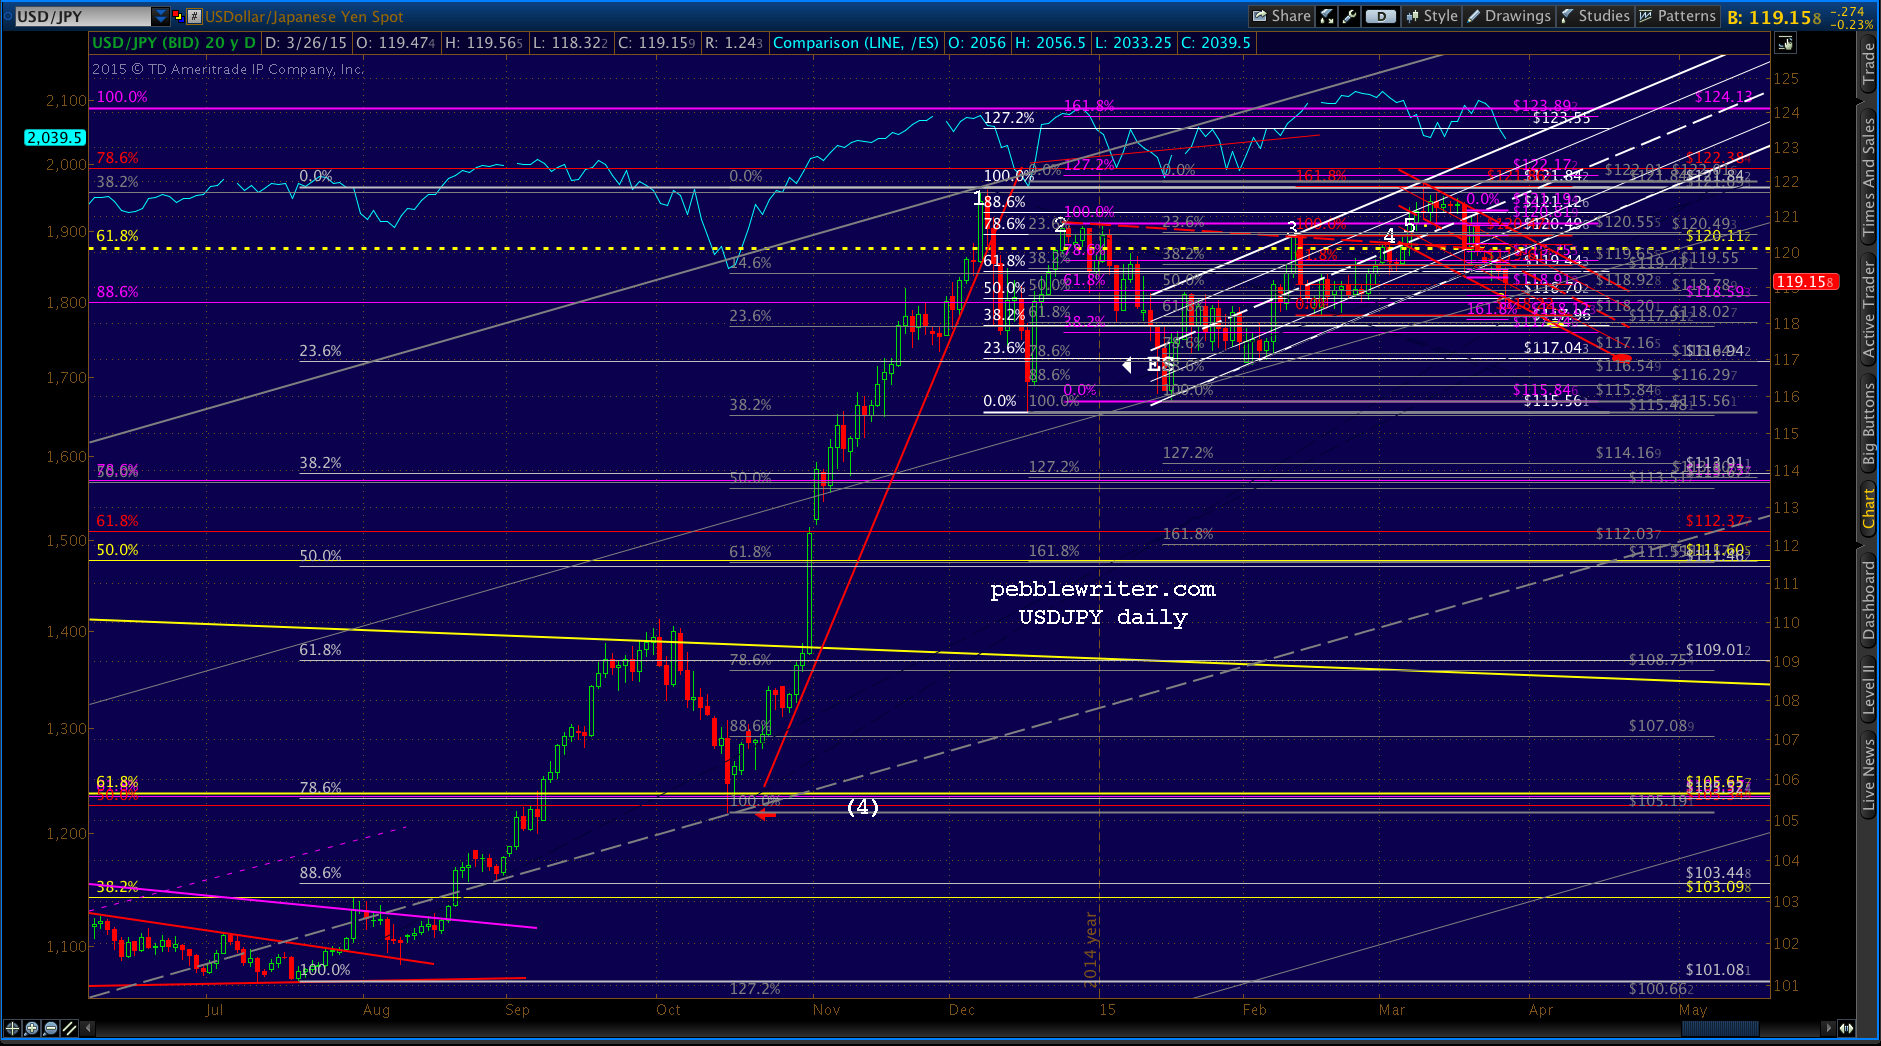
Nothing new, just the European close and an updated USDJPY chart. I inset a smaller channel between the top and .786 lines of the large channel from 2012. I’ve colored it white to reflect its likely primacy, and grayed out the white channel from Jan 16.
It seems to work pretty well — meaning they’ll probably try to hold on to the .786 in order to keep the rising tide that lifts all equity boats rising.
Come early May, they’ll have to decide between that channel line and the .618 at 120.11 — which the pair has closed below 4 sessions in a row. The bearish case would require that this white channel (and gray .786 line) break down at some point.
The bullish case involves staying in the white channel, with an appealing target of the white dot at 120.21 at month’s end. USDJPY would finish above the yellow .618, but wouldn’t be required to violate the red channel top (as sloppy as the red channel bottom is, the top is perfectly formed.)
 UPDATE: 12:00 PM
SPX just backtested the TL from October at 2062.48. It should head back down here if its going to.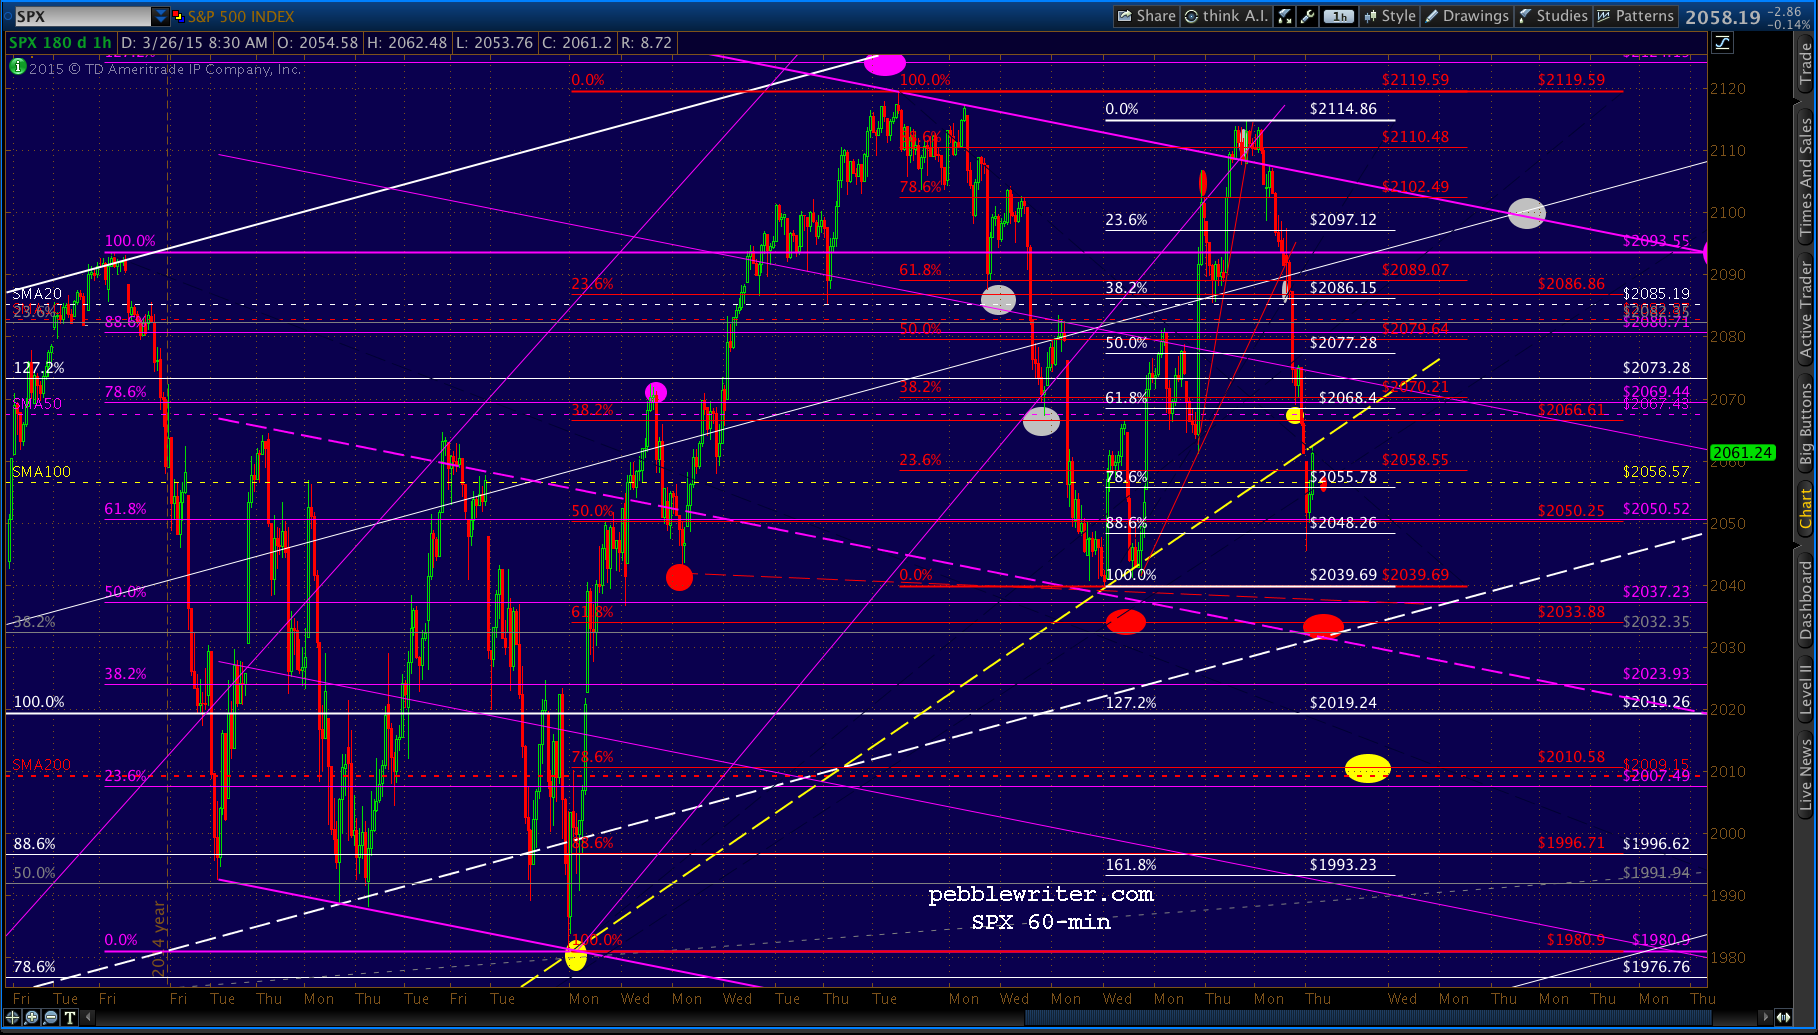 After exactly matching the Mar 11 high at 17.19, VIX has backtested the top of the falling gray channel — and, closed this morning’s gap. As signals go, it’s not airtight — but, it’s fairly reliable when it accompanies another significant chart signal such as SPX’s backtest.
 UPDATE: 3:10 PM
I don’t have all the details yet, but I’m working on a complicated, but very promising analog that suggest the market will break important support on Apr 10, and bottom out on Apr 14. In the past, the support consisted of both moving average and a channel bottom.
The SMA100 should peak on April 30, trough around May 11, and peak again on May 21. If SPX continues to struggle holding the SMA100 — currently at 2057.30 — then we could be talking about a dip to the SMA200. If not, then it might constitute the broken support on Apr 10.
It’s currently at 2010 and flattening out. By April 14 it should be around 2014 or so. It should peak around May 13, dip until May 27, and then peak again around Jul 9.
All things considered, swing traders might want to remain short through mid-April (OPEX is Apr 17) — though there will probably be some pretty exciting swings between here and there.
Short-term and day traders will want to pay attention to that yellow TL off the Oct lows. It has officially broken down, even on a daily chart, by virtue of this morning’s opening. But, a close back above would definitely gum up the works.
GLTA.