Month: March 2015

  • Update on RUT: Mar 23, 2015

    In our last major update on RUT, we noted that a rising channel from  had broken down.  But, we also noted, RUT had since bottomed out and was aggressively backtesting — climbing the underside of the broken channel.

    Now, backtests can and — in this rigged market — often do go on to exceed previous highs.  So, the current one could easily climb right on up the belly of the broken wedge to 1213 or higher.

    2014-11-20 RUT  daily 1300

    In fact, that’s exactly what happened — thanks to the Bank of Japan.

    2015-0323 RUT v SPX 1000 First, a little background.

    RUT’s drop through major support had drawn attention.  Even permabulls had noticed the glaring divergence between RUT and SPX.  And, they were starting to talk.

    continued for members(more…)

  • Charts I’m Watching: Mar 23, 2015

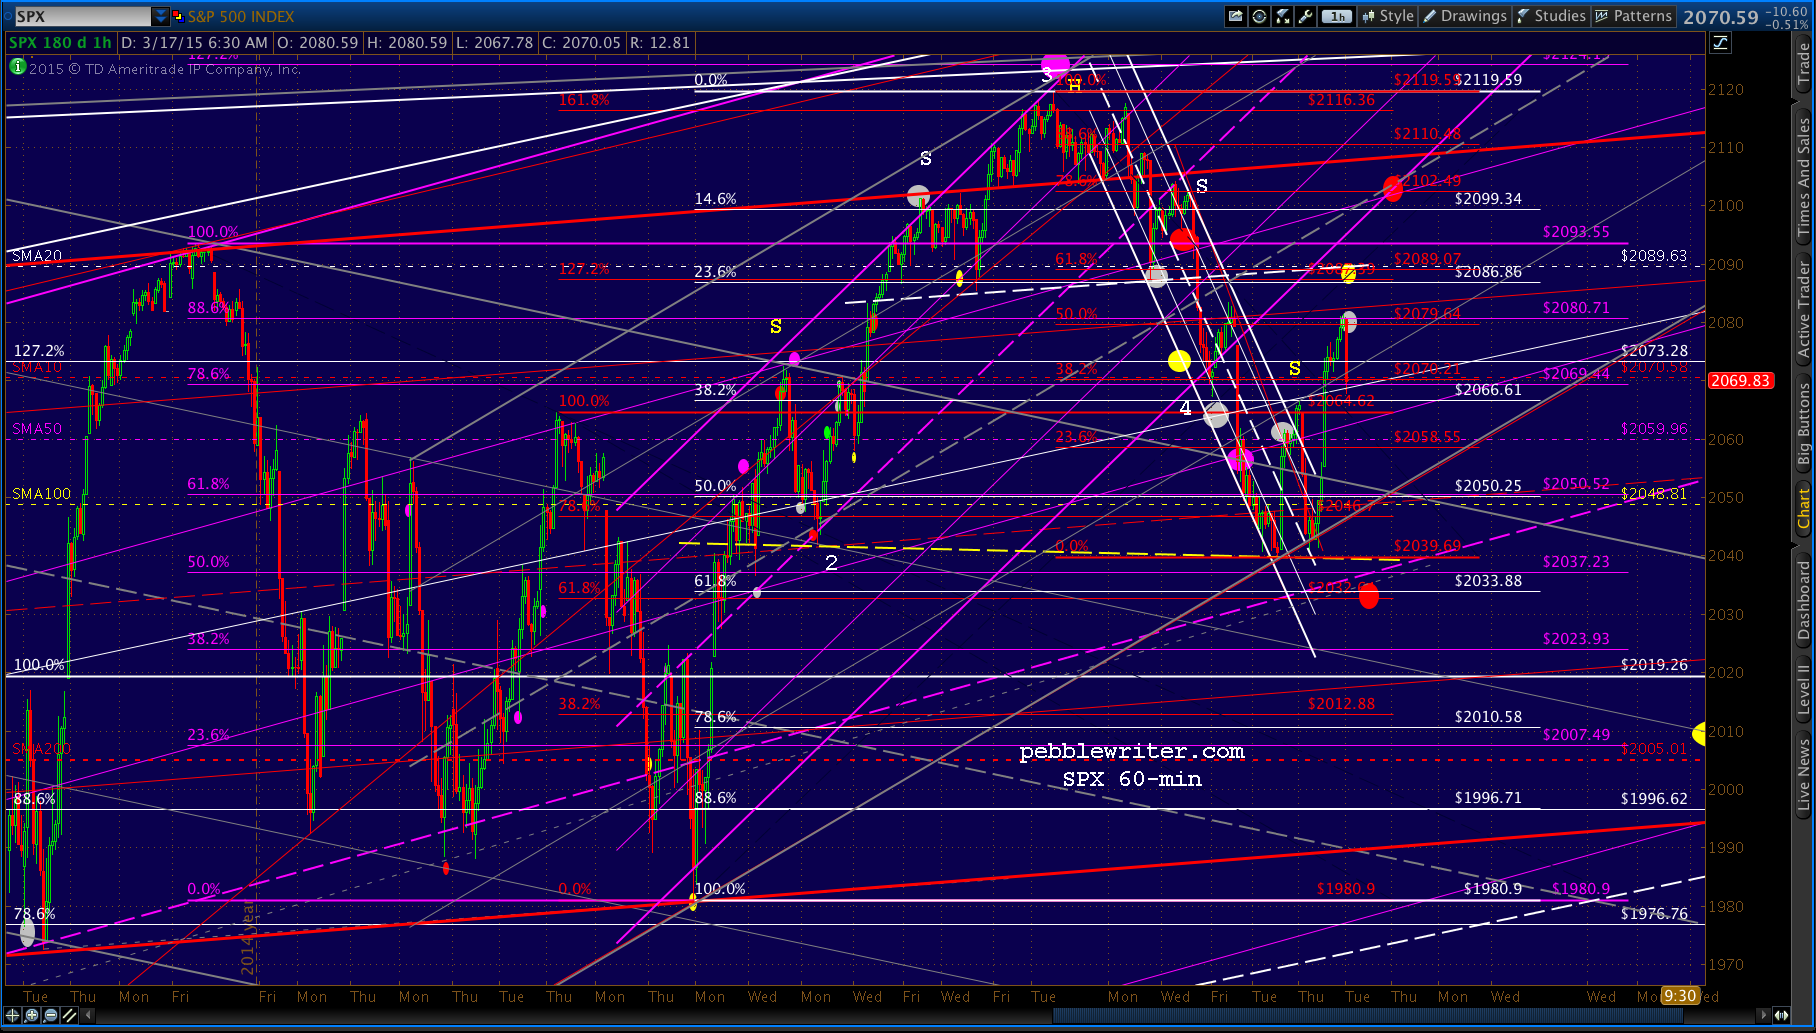
    SPX reached our secondary target at 2110.48 Friday — two sessions ahead of schedule.  Per our Mar 17 forecast (members’ section):

    Assuming SPX can get past the SMA20, the midline also intersects with the broken purple channel bottom for a backtest Thursday morning at the red .786 (or next Tuesday the 24th at the .886 at 2110.48.)

    2015-03-23 SPX 60 0650We recommended taking profits at this level Friday.  In addition to completing the small Bat Pattern, SPX has backtested the broken purple channel.  Of course, bulls would love nothing more than to barge right back into it as has been done with many V-shaped “recoveries” over the past year or two.

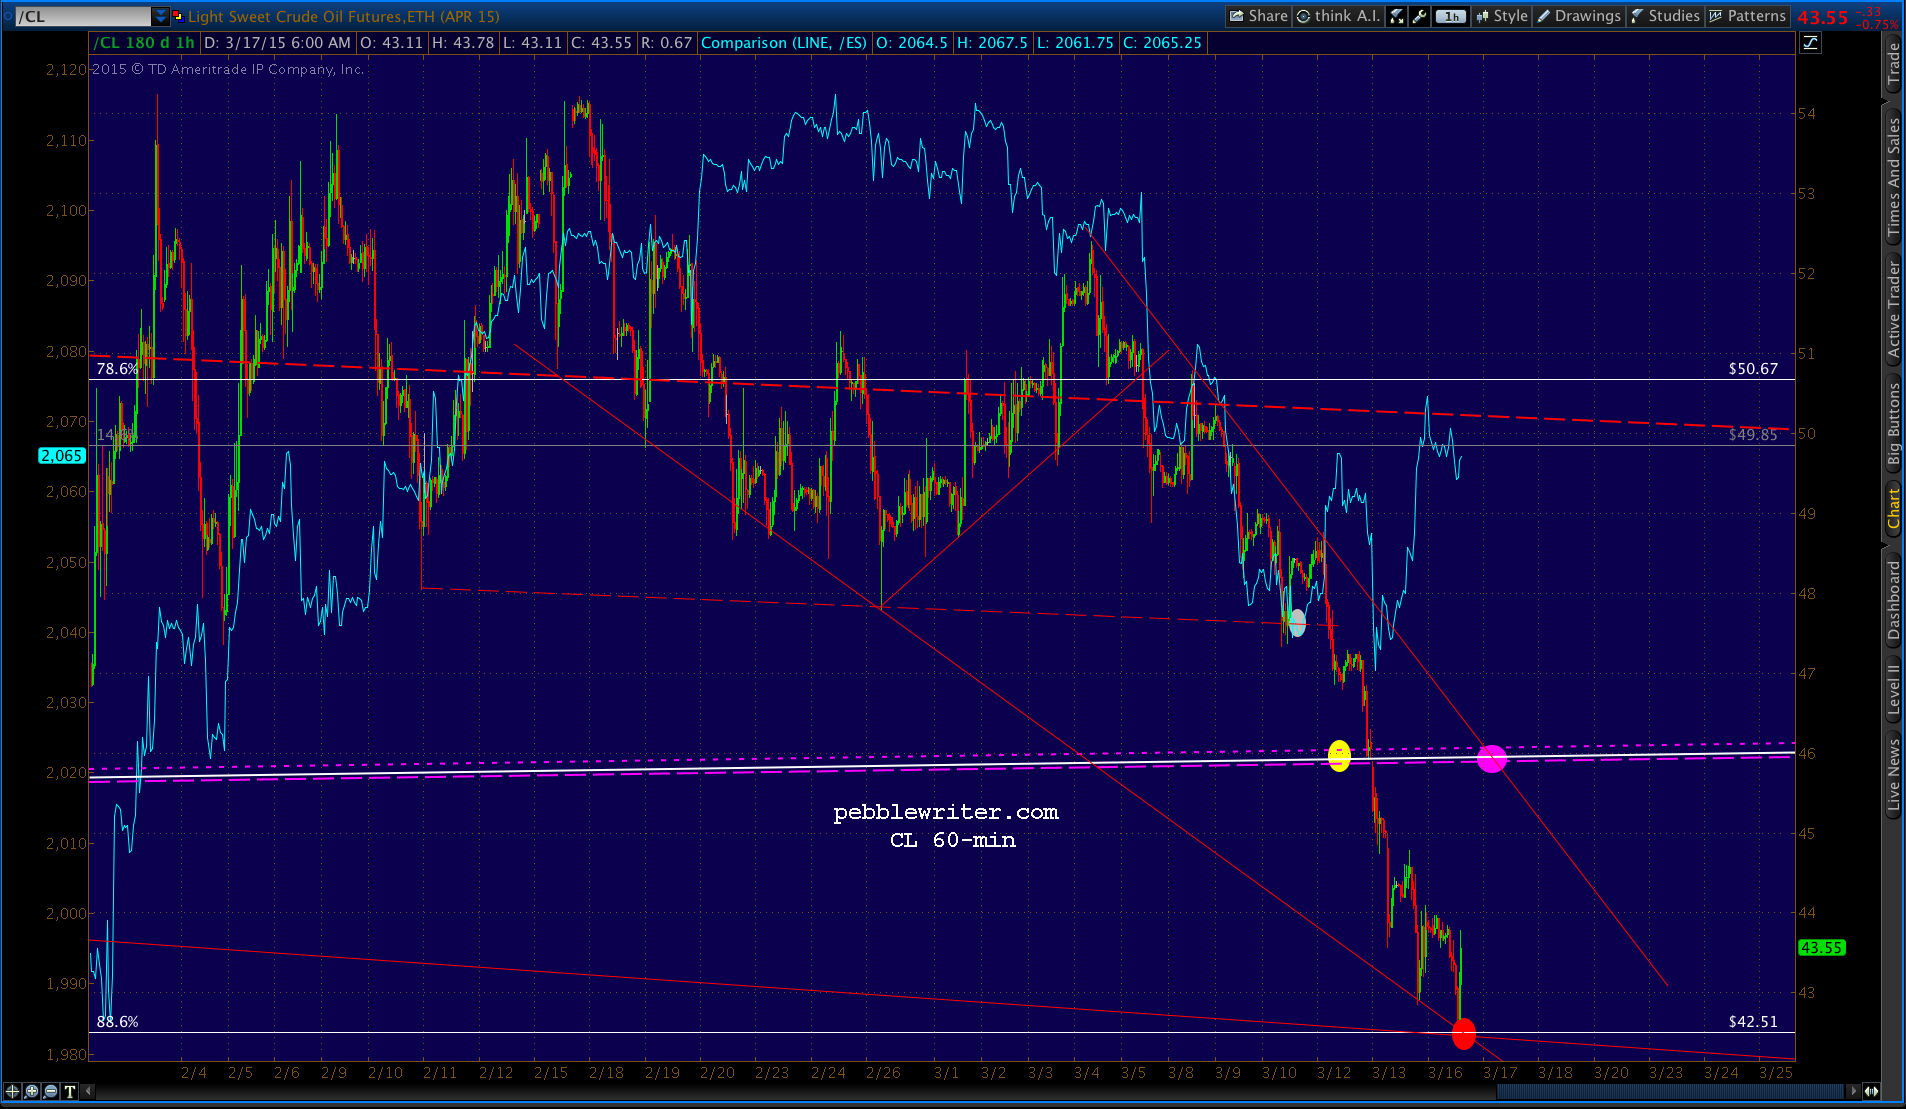
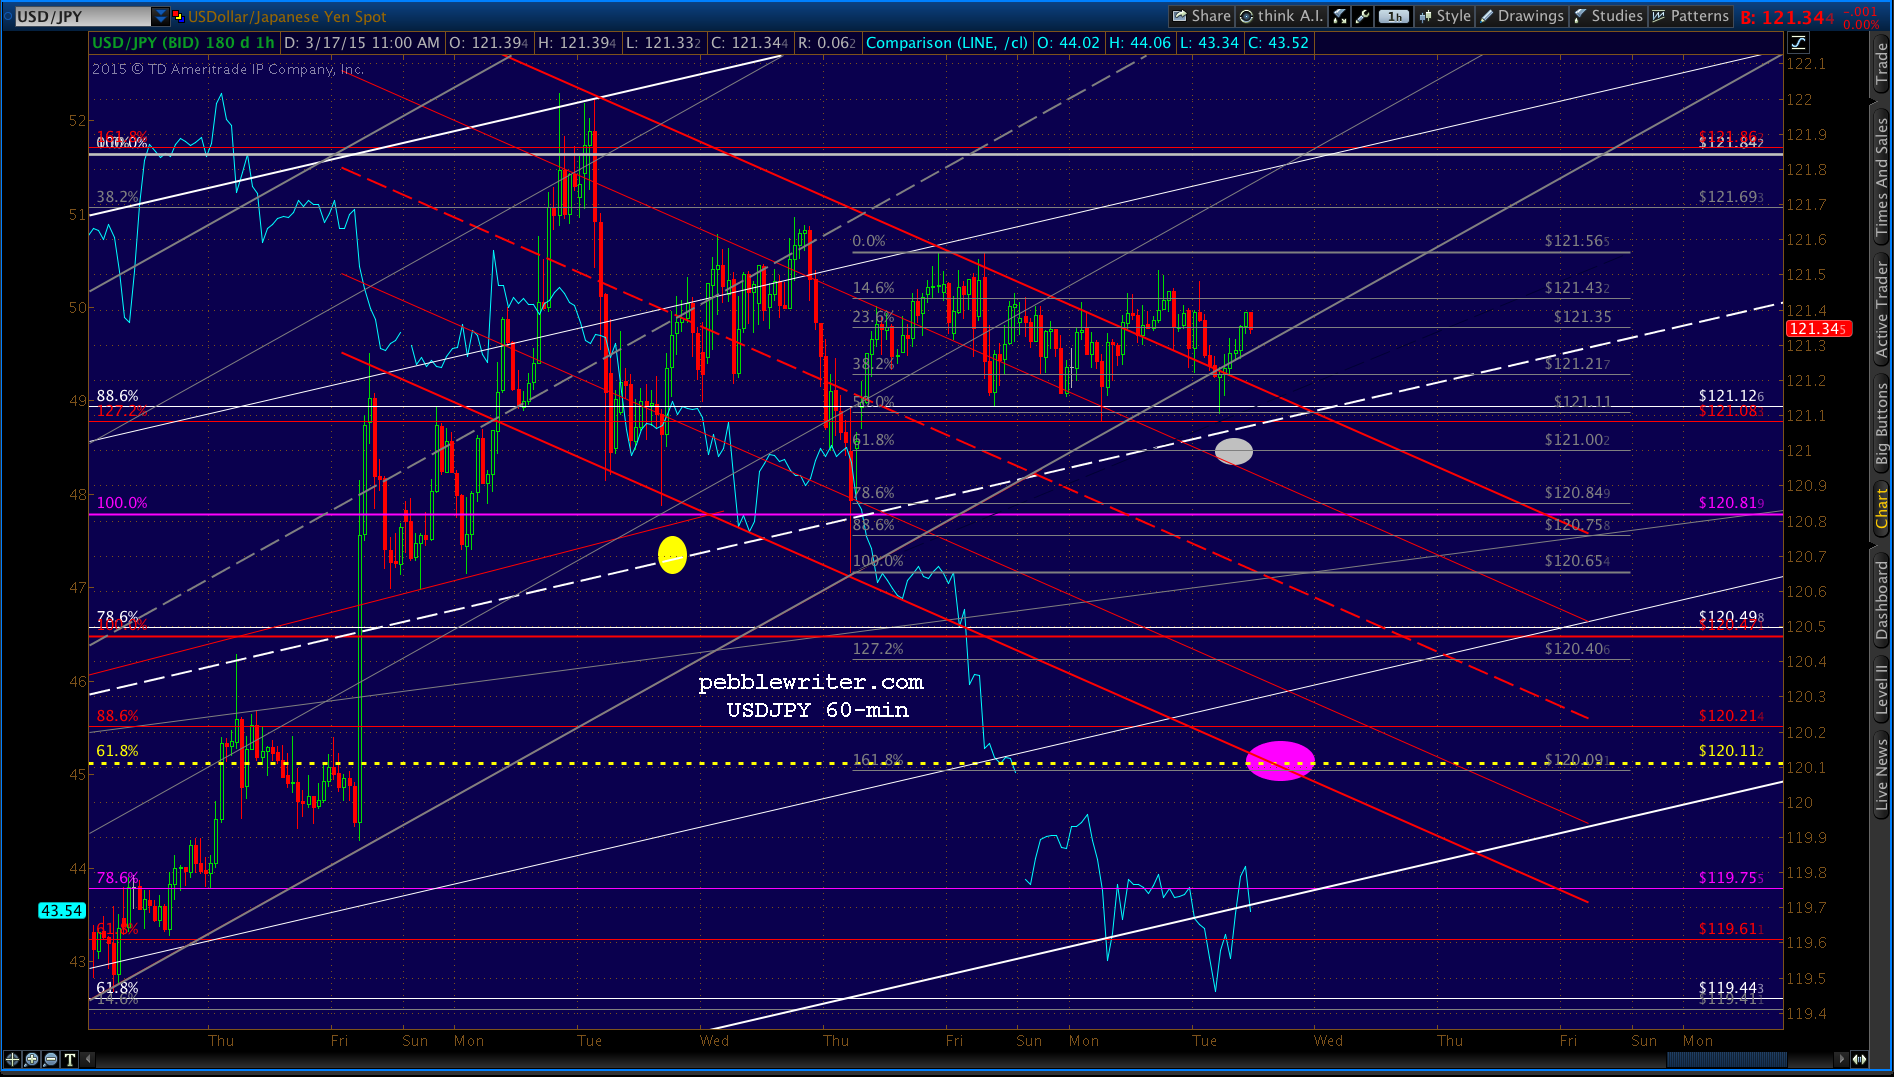
    This morning, USDJPY is nearing the white channel bottom with support around 119.61 (and secondary support at 119.44)…2015-03-23 USDJPY 60 0620…while CL was eased down overnight to its trend line support.2015-03-23 CL 60 0620The damage done to DX isn’t dinging stocks…

    2015-03-23 DX v ES 60 0635 …thanks to EURUSD’s continuing bounce.

    2015-03-23 EURUSD v ES 0640

    Note that EURUSD is nearing completion of a Gartley Pattern at 1.0949.  Regardless of whether it reverses, EURUSD’s strength since bottoming at 1.0462 on the 17th has to leave ECB easing fans wondering — if not worrying.

    DAX’s spectacular 28% run (from Jan 5) leveled off on Mar 16, when EURUSD’s slide was interrupted in order to save SPX from declining any further.  If the euro resumes falling, however, that task will revert to USDJPY and CL — both of which have managed to boost SPX during the day (sometimes taking turns) while resetting overnight.

    Thus, neither is really going anywhere.  But, the benefit to SPX is nevertheless positive.  It begs the question: “how long can this go on?”  The answer, as is often the case, lies in the past.

    continued for members(more…)

  • Charts I’m Watching: Mar 20, 2015

    Stocks topped out just north of our 2102.49 target on Wednesday [see: Mar 17 CIW] and spent most of Thursday backfilling and testing the SMA20.2015-03-20 SPX 60 0600Since USDJPY is back above the critical .618 Fib at 120.11, we’re meant to believe it is breaking out yet again (despite Paul Tudor Jones’ warning.)  But, as we point out in yesterday’s Update on USDJPY, this is the fifth time above 120.11 since December. 2015-03-20 USDJPY 4 0610

    Four of the previous times sent stocks reeling when USDJPY wasn’t able to break out:

    1.  a 107-pt drop from 2079 to 1972 in seven sessions.
    2.  fell 101 points in five sessions (and, marginally lower over the next two weeks)
    3.  gained 52-pts (on oil’s bounce) but tumbled as USDJPY failed a second try
    4.  a 30-pt slide on USDJPY’s pullback from the Fib and the red, dashed TL
    5.  a 64-pt drop (when oil’s bounce failed)

    Wednesday’s CL, USDJPY and DX takedown was discussed extensively in Algos Gone Wild.  It analyzes beat for beat the means by which the markets have been manipulated higher over the past three months through a combination of moves that supports the yen carry trade.

    It has been very effective and won’t stop working until USDJPY fails to hold 120.11, oil tumbles much further, or the dollar reverses sharply.  And, when the carry trade falters, there’s always the overnight ES ramp job, VIX manipulation, bond futures manipulation, etc.

    Last night, it was the DAX breaking through resistance combined with a nice bounce in oil that enabled ES to rally 14 points.  It’s backing off now, as that same oil bounce is causing DX to plummet, thus dinging USDJPY.

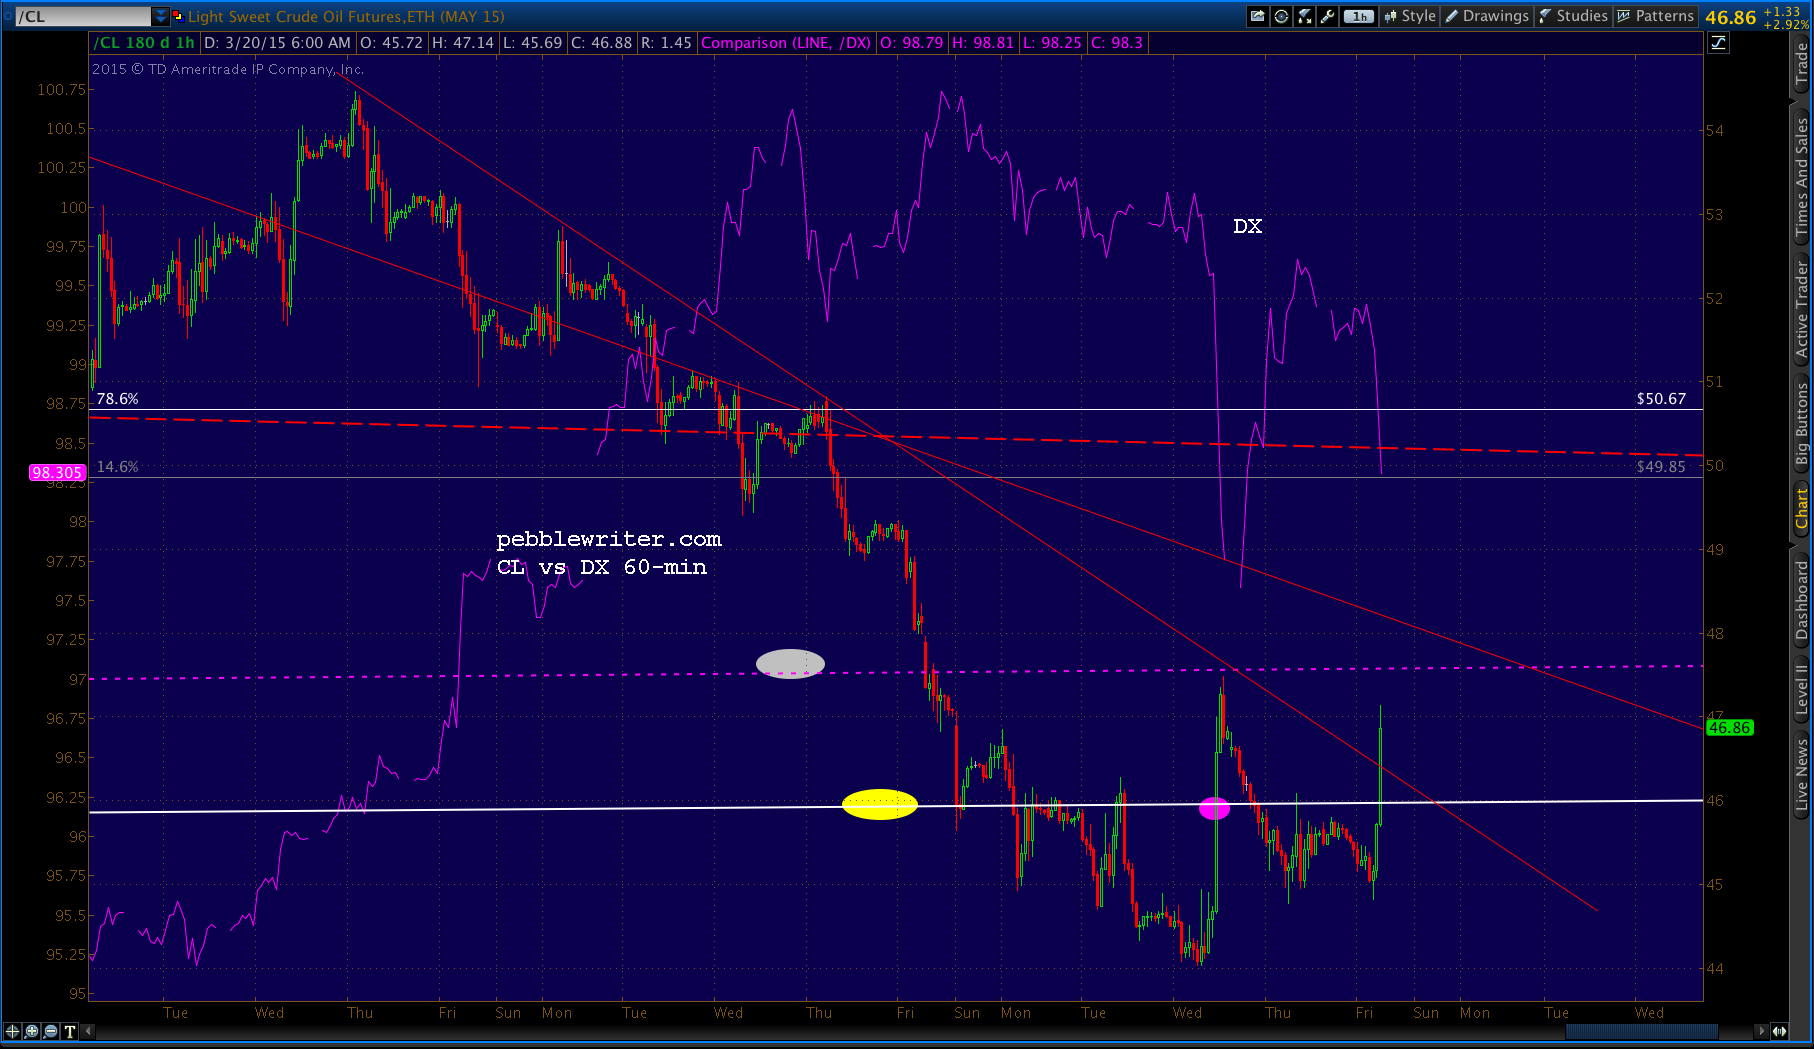
    2015-03-20 CL v DX 60 0628It’s the same set of circumstances that led to Wednesday afternoon’s turmoil.  It’ll be interesting to see how TPTB handles it today with CL clearly breaking above a two-week TL and the resultant hit to DX and USDJPY.

    Stock bulls will see this as bullish, even though it runs counter to the Fed’s objectives and will require corrective action that could undo SPX’s rally.  One possible way would be to take EURUSD down, potentially strengthening DX without as much impact on USDJPY.

    2015-03-20 CL EURUSD v ES daily 0651

    The less elegant, but often used, method is to wait until after the cash close.  Of course, this being a quad-witching day and with the futures already up so big, all they have to do is hold the opening spike.  We’ll have to wait and see.

    Overhead resistance is at 2102.49 today.  If SPX breaks through, our next upside targets remain intact.

    continued for members(more…)

  • Update on USDJPY: Mar 19, 2015

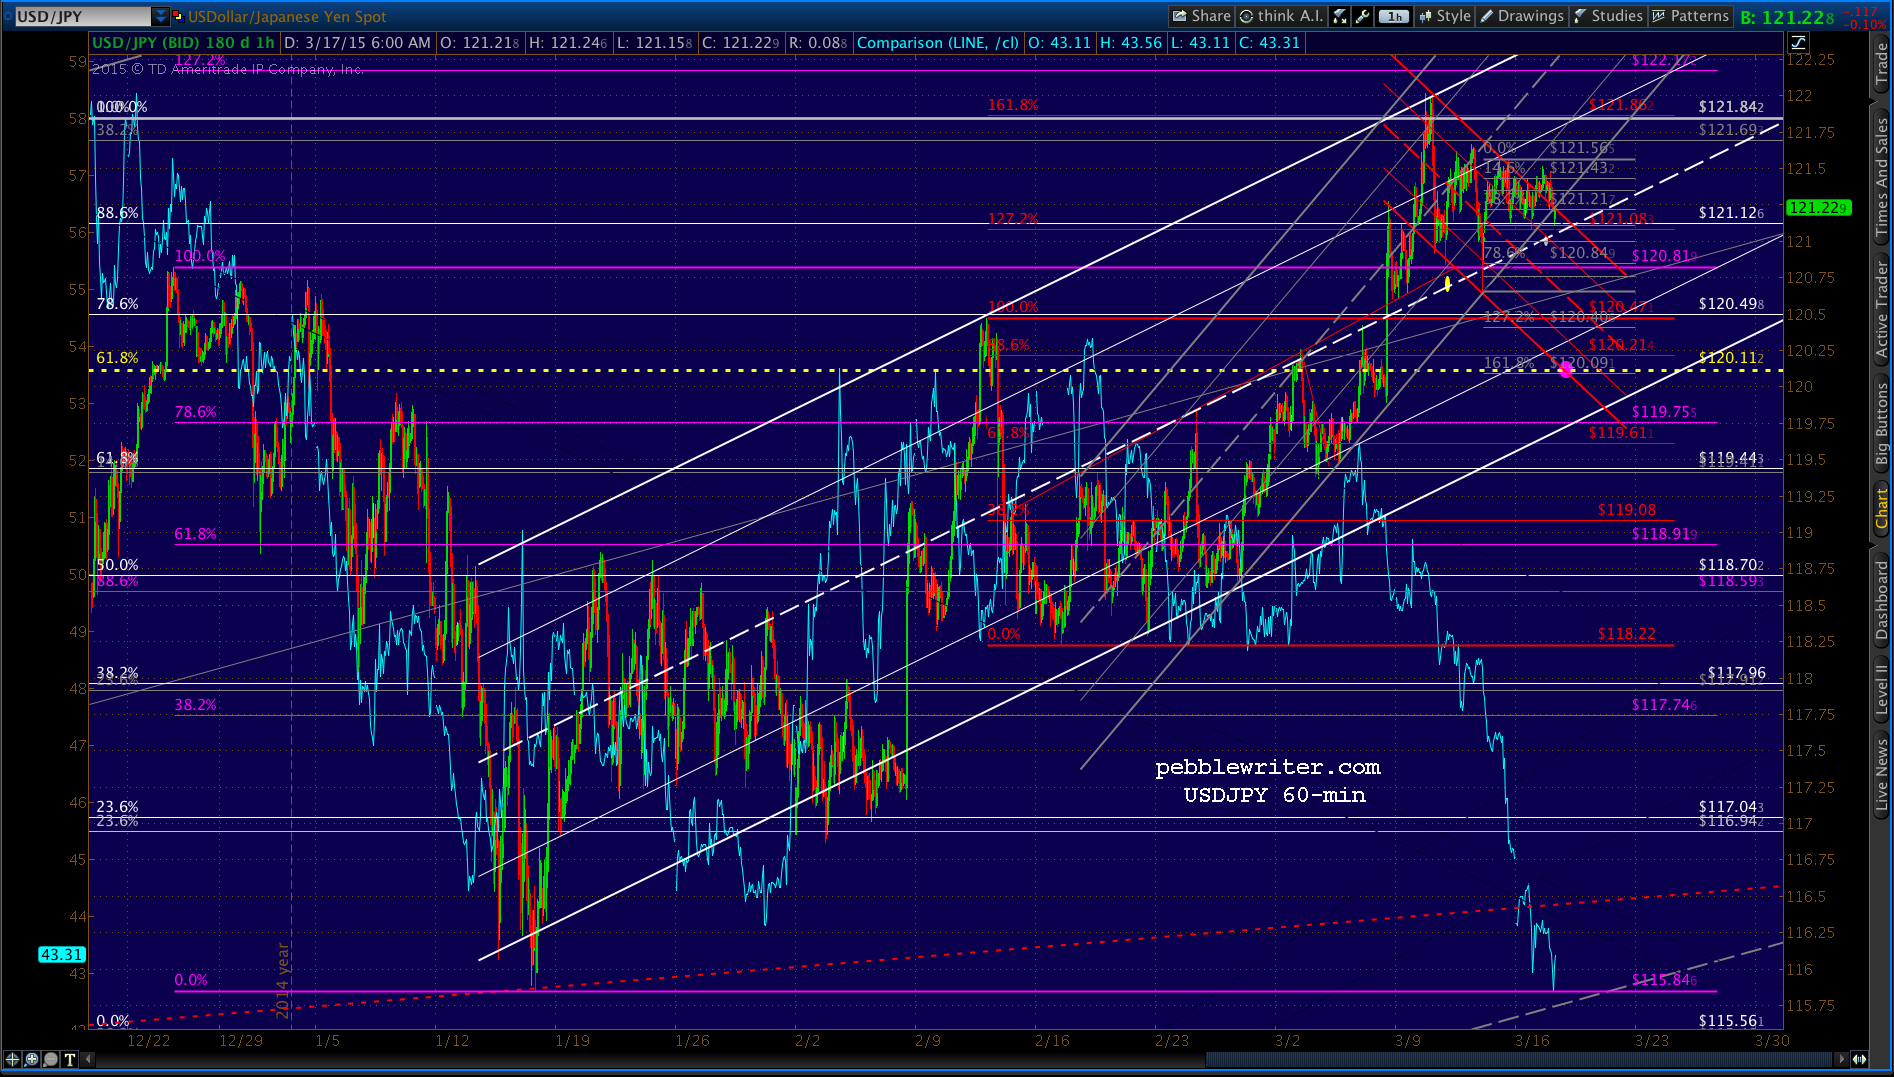
    We post daily and intra-day charts for USDJPY almost every day.  But, it’s been a while since our last look at the big picture.  Last December 4, we noted several approaching possible resistance levels.  The first was the approaching .618 Fib retracement of the drop from 147 to 75 between 1998 and 2011.

    2014-12-04 USDJPY v SPX weeklyWith USDJPY at 119.20 at the time, we’d know pretty quickly whether Leonardo Fibonacci’s observations would hold any sway.  We wrote:

    With the end of the year coming up, I suspect we’ll see USDJPY barely pause at 120.11, but instead come back to backtest it — maybe even slipping below in the backtest.  Whether they can keep the scam alive after year-end, I can’t say.  But, there is little in the way of resistance [after 120.11] other than the top of the tight, white rising acceleration channel the pair has been in since early November.

    Since then, USDJPY has pushed through 120.11 five separate times.  All but one of those times — the most recent — it fell back below, sending stocks scrambling for cover.

    2015-03-19-USDJPY daily 2050Oddly enough, the first came on Dec 5, the day after that post.  USDJPY shot up almost 2% through 120.11, closing at 121.44.  Over the next seven sessions, however, it fell 4.9% to 115.56. SPX followed suit with a 107-pt plunge that was then miraculously erased by USDJPY just in time for new all-time highs by year-end.

    It was a sign of things to come.  The impact that each rise above 120.11 had on SPX:

    1.  a 107-pt drop from 2079 to 1972 in seven sessions.
    2.  fell 101 points in five sessions (and, marginally lower over the next two weeks)
    3.  gained 52-pts (on oil’s bounce) but tumbled as USDJPY failed a second try
    4.  a 30-pt slide on USDJPY’s pullback from the Fib and the red, dashed TL
    5.  a 64-pt drop (when oil’s bounce failed)

    This most recent push above 120.11 was arguably the most interesting.  With CL plunging back below the long-term trend line from 1998, it was only USDJPY’s spike higher that initially saved stocks from tumbling.

    USDJPY even registered a new high on Mar 10.  But, it took seven sessions of closing above the white .886 Fib at 121.12 for SPX to believe it was for real and begin its latest recovery.  Yesterday, being an FOMC algo announcement day, USDJPY was used as a blunt force object to bludgeon oil prices back down.

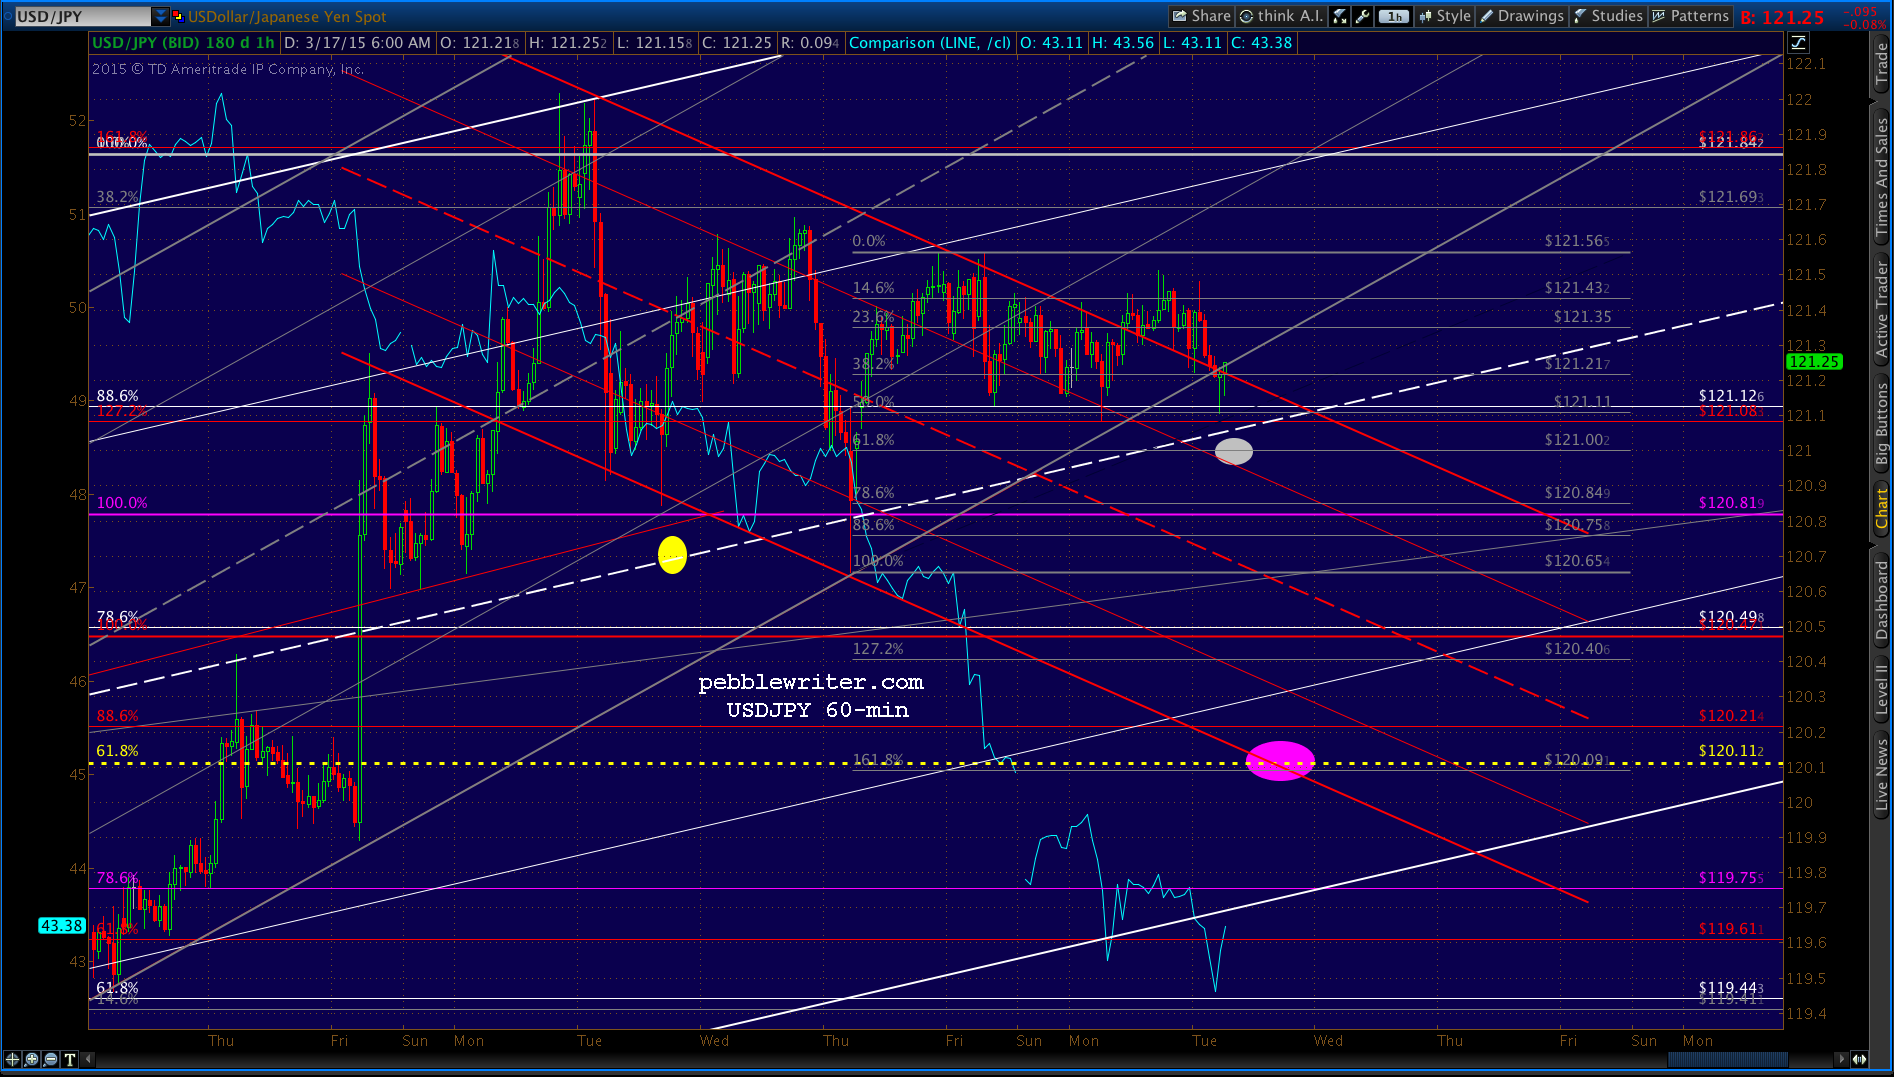
    When all the dust settled, USDJPY had fleshed out the bottom of its rising channel and managed to close back near 120.11.

    2015-03-19-USDJPY 60 2050Note that it closed today back above 120.11 — but, is running into potential resistance at the white channel midline.  Clearly, The Powers That Be understand the influence USDJPY — and, that .618 Fib in particular — have on stock prices.  As we detailed in Those Wacky Central Bankers, the yen’s demise has been essential to stocks’ rise since 2011.

    We don’t know whether SPX can continue to notch new highs, because we don’t know how much pain the BOJ et al. are willing to inflict on the Japanese people.

    They’re already reeling from tax hikes that are somehow expected to help revive an economy that’s been circling the drain for years.  If oil prices recover in the least, the “low inflation” deceit will be exposed for all to see.  What then?

    The latest brainstorm out of Tokyo stems from the fact that, at the current pace of ¥3 trillion in annual purchases, the BOJ will have exhausted the entire supply of Japanese ETFs by YE 2017 (it already purchases all the bonds the government issues.)  Will they go so far as to buy up individual stocks, too?  And, will that be enough to sustain the carry trade?

    Stay tuned.

  • Update on AUDJPY: Mar 19, 2015

    Long-term trend looking pretty solid…

    2015-03-19-AUDJPY wkly 1754…but, the bounce is running into resistance from the falling purple channel midline and the rising white channel’s .146 (shown in red.)

    2015-03-19-AUDJPY daily 1754Downside targets favor the purple .786 Fib at 90.39, while the upside opens up above the purple midline and, of course, 94.18.


  • Algos Gone Wild!

    man_behind_curtain_smallOver the past year, as headlines (if not reality) began to support the narrative of an improving economy, the Fed found itself in a position where they needed to either raise interest rates or change the narrative.  With over $18 trillion in debt, raising rates is not an option.

    Crashing oil prices and a soaring dollar was the only solution [see: Those Wacky Central Bankers] that enabled them to keep both interest rates and inflation under control while preserving the yen carry trade.

    But, there was a limit.  If oil prices got too low, the damage to banks who are heavily exposed to the industry would be too great.  And, the dollar was also getting to the point where even Yellen admitted it might be problematic.

    The chart below shows the relationship between crude light (red) and the US dollar (purple) over the years.  It has historically shown a strong inverse correlation.

    2015-03-19-CL v DX wkly 0600Yesterday’s fedspeak and market manipulation were designed to stabilize oil, the dollar and interest rates — all in one.  And, things were going pretty much according to plan — until the algos got a little out of control.  Actually, make that a lot out of control.

    In the process of levitating stocks (to illustrate how wise and beneficial the Fed’s actions were) they forgot to put a lid on oil. Having already bottomed out as we expected two days ago [see: Update on Oil Mar 17] CL popped up through the trend line from 1998, threatening to undo all that nifty price control that got it down to an acceptable level in the first place.

    2015-03-18 CL 60 1219This presented a quandary to the guys pulling the levers and pushing the buttons: how to kill off oil’s rally without also killing stocks?  Because oil and the dollar are so strongly inversely correlated, they needed to quickly ramp up the dollar.

    But, the dollar and stocks have been strongly positively correlated lately.  Oil’s occasional ramp jobs have been a big part of algo trading ever since CL first stabilized in January.  So, ramping the dollar would add fuel to stocks and, hence, also oil.

    The only solution was to use the yen to bring SPX and, thus, CL back under control.  As we wrote at 3:20 in the members section:

    Gotta crash USDJPY (at least until after the close when it can all be reset.)  Maybe CL can be hammered back down then, too.

    A cratering yen has been critical to the all-important carry trade which has fueled most of stocks’ rise since 2012.  The movement of USDJPY is the single most important contributor to stock price swings on not only a daily basis, but moment-to-moment as well.  We document its very high positive correlation with SPX on these pages almost every day.

    Since mid-January, USDJPY has been advancing within a broad, white channel.  Together with CL (in purple below), is has driven SPX to all-time highs.

    2015-03-19- USDJPY v ES 30 0700In mid-February, when stocks were faltering, USDJPY began constructing a new, steeper channel within the white channel (in gray, above.)  In fact, just two days ago (Mar 17), USDJPY broke out of a perfect little falling red channel above in order to arrest stocks’ sharp decline that day.

    By crushing USDJPY (stronger yen, weaker dollar) they could bring stocks and oil back down.  It would mean also crashing the dollar which, as we mentioned above, generally benefits oil.  But, if executed correctly, it would have the necessary effect.

    That gray channel had to go — but, preferably in such a way that stocks’ rally wouldn’t suffer any irreparable damage.  The key was timing.

    USDJPY had dropped through the gray channel bottom the night before, and the white channel midline shortly after the session opened.  It bounced back above it as Yellen started her double-talk; but, when CL spiked through its overhead resistance, USDJPY was decisively crushed.

    2015-03-19- USDJPY v ES 0700It had an immediate effect on stocks, which had just backtested the broken purple channel as we had expected.  We posted the chart below in Tuesday morning’s members section, along with the commentary:

    Assuming SPX can get past the SMA20, the midline also intersects with the broken purple channel bottom for a backtest Thursday morning at the red .786 at 2102.49 (or next Tuesday the 24th at the .886 at 2110.48.)

    2015-03-17-SPX 60 0715The algos ramped SPX up to 2102 (where we recommended taking profits) and then some.  It had reached 2106.85 before the USDJPY crash finally caught its attention.  It backed off to 2096 by the closing bell, and was threatening more — especially, given the carnage going on with USDJPY, which had just dropped below a critical Fib line.

    2015-03-19-SPX 60 0600The white arrow on the USDJPY chart below marks the final 5 minutes of the session, when the pair dropped below 120.11 — the critical .618 Fib retracement of the pair’s decline from its 1998 high of 147 to its low of 75 in 2012.

    This was a particularly bad omen for stocks, as previous dips below this line have led to large declines in SPX if they occur during market hours (after-hours, it’s easy to prop up ES in the much lighter volume.)

    2015-03-19- USDJPY 5 0834DX traders took note of the reversal and the crash in USDJPY.  If stocks were going to crater, they certainly didn’t intend to be left holding the bag.

    The Fed was able to prop it up until the cash market closed at 4:00 (the white arrow below.  By then, it had fallen back to the purple channel top it had broken out of on Mar 10 (when USDJPY ramped higher to arrest SPX’s plunge.)

    After the cash market closed, however, all bets were off.

    2015-03-19- DX v ES 1 0845Stunned by USDJPY’s continuing plunge (it didn’t bottom out until 4:04) and the likelihood that stocks would follow suit, the dollar flash crashed.  It plunged through our initial target at 98.82 and even through our primary target at 96.17 [see: Update on the Dollar Mar 13].

    Finally, when it had reached the February lows, the Fed pulled out all the stops to support it.  It bottomed at 4:06, two minutes after USDJPY.  That it miraculously recovered overnight and is now pushing above the purple channel top again (in order to arrest this morning’s sell-off) is no coincidence.

    2015-03-19-DX v ES 60 0900That the USDJPY found support at the white channel bottom is not a coincidence. That EURUSD briefly popped above the midline of a 12-year old channel is not a coincidence.  That CL is suddenly back below the long-term trend line from 1998 (yes, hammered back down overnight) is most definitely not a coincidence.

    2015-03-19-CL v DX 60 0600

    In fact, there is very little in the way of coincidences in the “market” anymore.  Most of the time, the day-to-day moves are carefully scripted by central banks and the algos and HFT traders that capitalize on their continuing largesse.

    The folks writing the script may tell us to pay no attention to “those algos behind the curtain.”  But, as events such as Black Monday, the LTCM debacle, the 2010 Flash Crash and the 2011 US credit downgrade taught us, they are a dangerous and destructive force that is always present — just waiting for the right conditions.

    So, every once in a while — particularly when narratives need changing or correlations need resetting — things will get out of control.  As human beings increasingly yield the trading floor to machines, we believe the resulting lower volume and lack of rationale oversight will result in more such events.

    Good luck to all.



  • Charts I’m Watching: Mar 18, 2015

    About an hour before the cash markets opened yesterday, we observed that crude light was closing in on our long-held 42.51 target.  It bounced at 42.63 and was on its way higher when stocks opened trading, prompting us to write:

    The bounce has begun, even though CL came up a few cents shy of 42.51. Stops are advised, as a premature bounce sometimes means one last leg down.

    We also noted how much of CL’s decline had been conducted in the after-hours, so as not to disturb stocks’ continuing rally.  Guess what?

    2015-03-18-CL 5 0600CL did post another leg down.  And, it happened right after the close — passing through 42.51 in the very minute before the futures also closed.  The 60-min chart:

    2015-03-18-CL 60 0600We also noted as the market opened that USDJPY had dipped below the gray channel bottom for the first time since Feb 26.  The degree to which is was allowed to reset would depend on how stocks reacted to CL’s decline and subsequent bounce.

    A strong response would allow USDJPY to decline during market hours; a weak or lackluster response would require it to wait until tonight or, as we discussed yesterday, a reaction to the Fed’s statement tomorrow.

    2015-03-18-USDJPY 60 0600Stocks started to falter, so USDJPY was brought right back into the gray channel — and, the falling red channel was broken — for the remainder of the cash session.  USDJPY was not allowed to decline to the white channel midline until after stocks had closed for the day.

    If the above aren’t grounds for suspicion (if not proof) that these are the most heavily manipulated markets in memory, how about VIX’s actions this morning?

    A 4-point SPX decline in the opening minutes was enough to prompt the Fed’s traders to push the panic button, sending VIX plunging from yesterday’s 15.96 close to 13.69 in the first three minutes of “trading.”

    2015-03-18 VIX 1 0645It broke the perfect little rising red channel, sending a loud and clear message that significant declines would not be tolerated.  Not today, with the Fed release coming up at 2pm.

    2015-03-18 VIX 60 0630Oil’s decline has been a godsend for the Fed, which has been struggling to find a way to keep inflation and thus interest rates low in the face of improving headlines.  But, it isn’t without repercussions.

    The very banks whose bidding the Fed does on a daily basis are rather exposed to oil’s fortunes.  So, we rather expect that CL has reached a sweet spot and, like USDJPY, EURUSD, VIX, ZN, etc., will be utilized when needed to nudge the “market” in one direction or the other.

    For more, see yesterday’s Update on Oil.  And, for how it fits in with the bigger picture including currencies, interest rates and inflation, see Those Wacky Central Bankers.

    This being a FOMC announcement and press conference day, we don’t advise trading.  SPX typically follows a pattern of consolidation, putting in a triangle of some sort before a very brief and sharp correction, which is then followed by aggressive USDJPY ramping and VIX monkey-hammering that erases all losses and leaves it higher for the day.

    But, as we’ve already seen, there is a great deal of manipulation that occurs on these days.  That doesn’t mean, however, that we won’t offer some thoughts on likely moves.

    continued for members(more…)

  • Charts I’m Watching: Mar 17, 2015

    With CL pennies from reaching our price objective [see: Update on Oil, Mar 17] this morning…2015-03-17-CL 60 523am…USDJPY should have a chance to reset.  It has already begun, with the first (tiny) slip beneath the gray channel bottom since Feb 26.

    2015-03-17-USDJPY 60 0623Whether it completes a backtest of the .618 Fib at 120.11 will be determined by how well equities respond to oil’s bounce or lack thereof.

    2015-03-17-USDJPY 60 0630A strong response would allow USDJPY to decline during market hours; a weak or lackluster response would require it to wait until tonight or, as we discussed yesterday, a reaction to the Fed’s statement tomorrow.

    UPDATE:  9:40 AM

    The bounce has begun, even though CL came up a few cents shy of 42.51. Stops are advised, as a premature bounce sometimes means one last leg down.

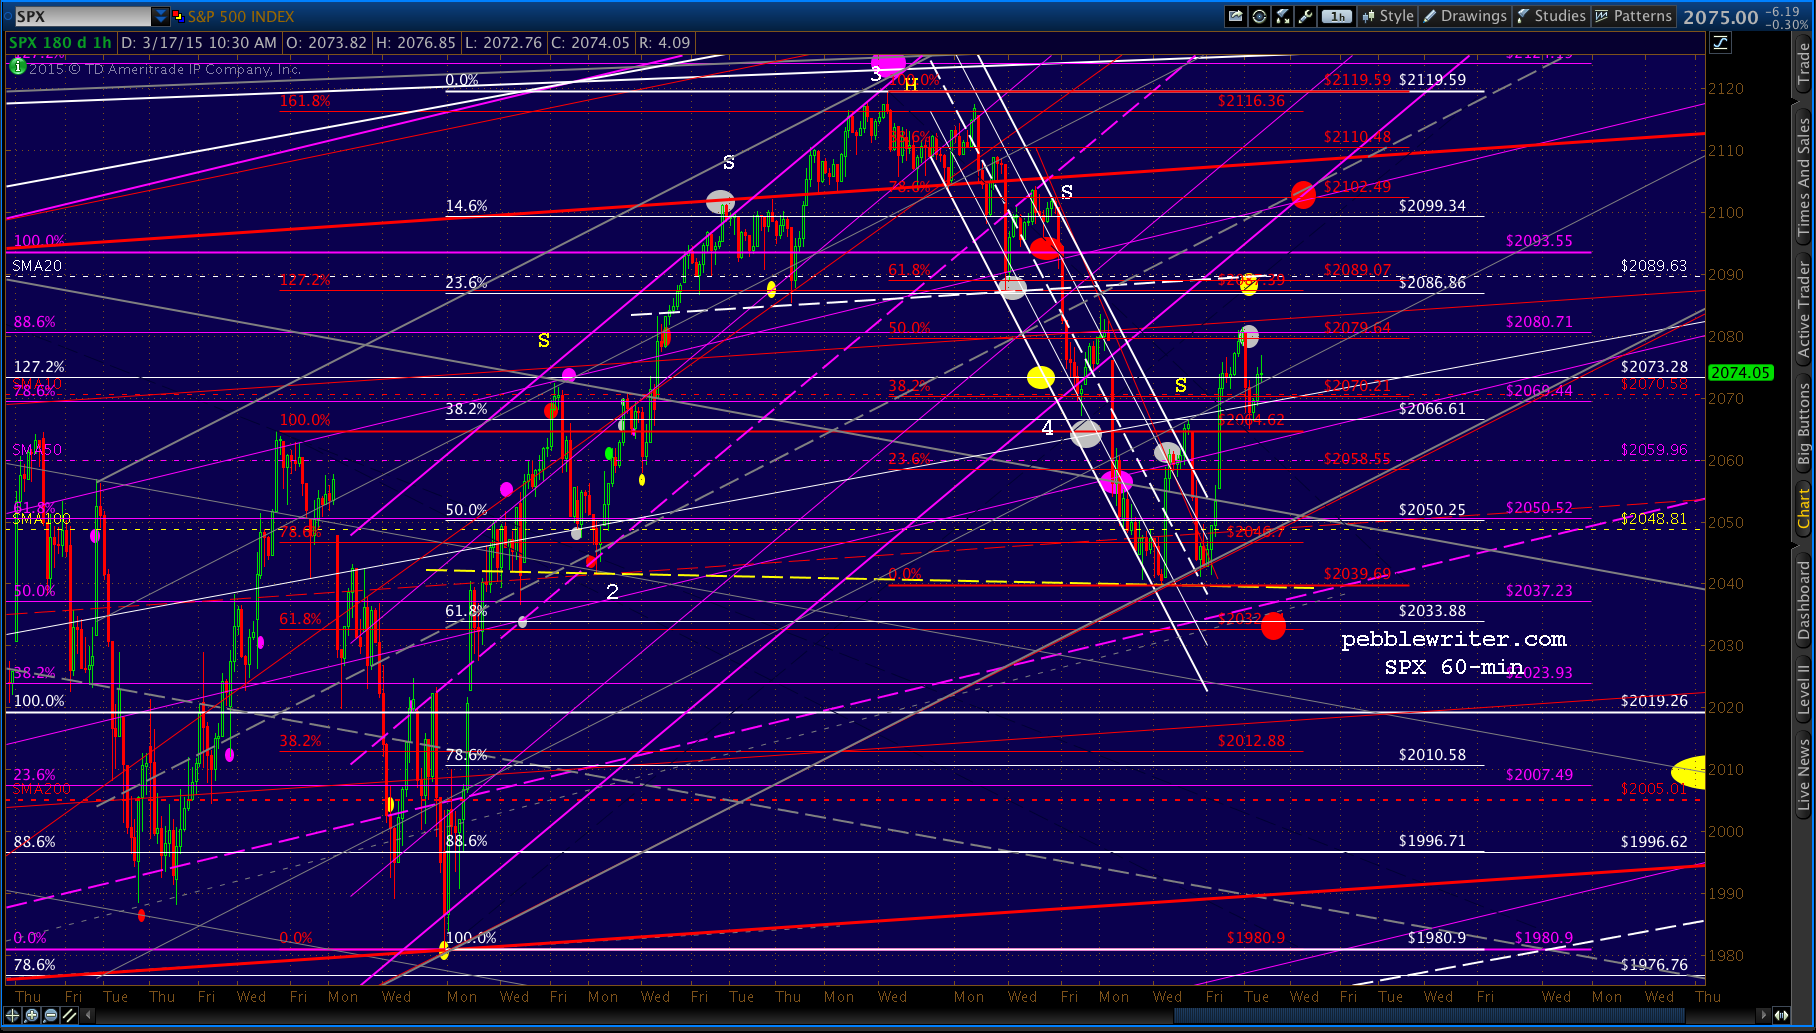
    The optimal timing for USDJPY to reach 120.11 and CL to reach 46 would be around midnight tonight (EDT.)  But, we’ll have to wait and see what TPTB have in mind, and how the “market” responds.2015-03-17-CL 609 0640Bulls should try to hold the line for SPX at the SMA10 of 2070.58.

    UPDATE:  10:15 AM

    The SMA10 is hanging on.  Note this is also the .786 channel line of the large rising white channel.  It was backtested on Mar 12, but broken in yesterday’s ramp job.

    2015-03-17-SPX 60 0715Forecast coming up.

    continued for members...

    Note the gray channel I’ve added in the mix.  I don’t expect this to hold, but we might find it a useful reference point in terms of the scenario that’s being suggested.  The bottom overlays the TL from mid-October, and I’ve placed the top such that the midline captures several past reversals.

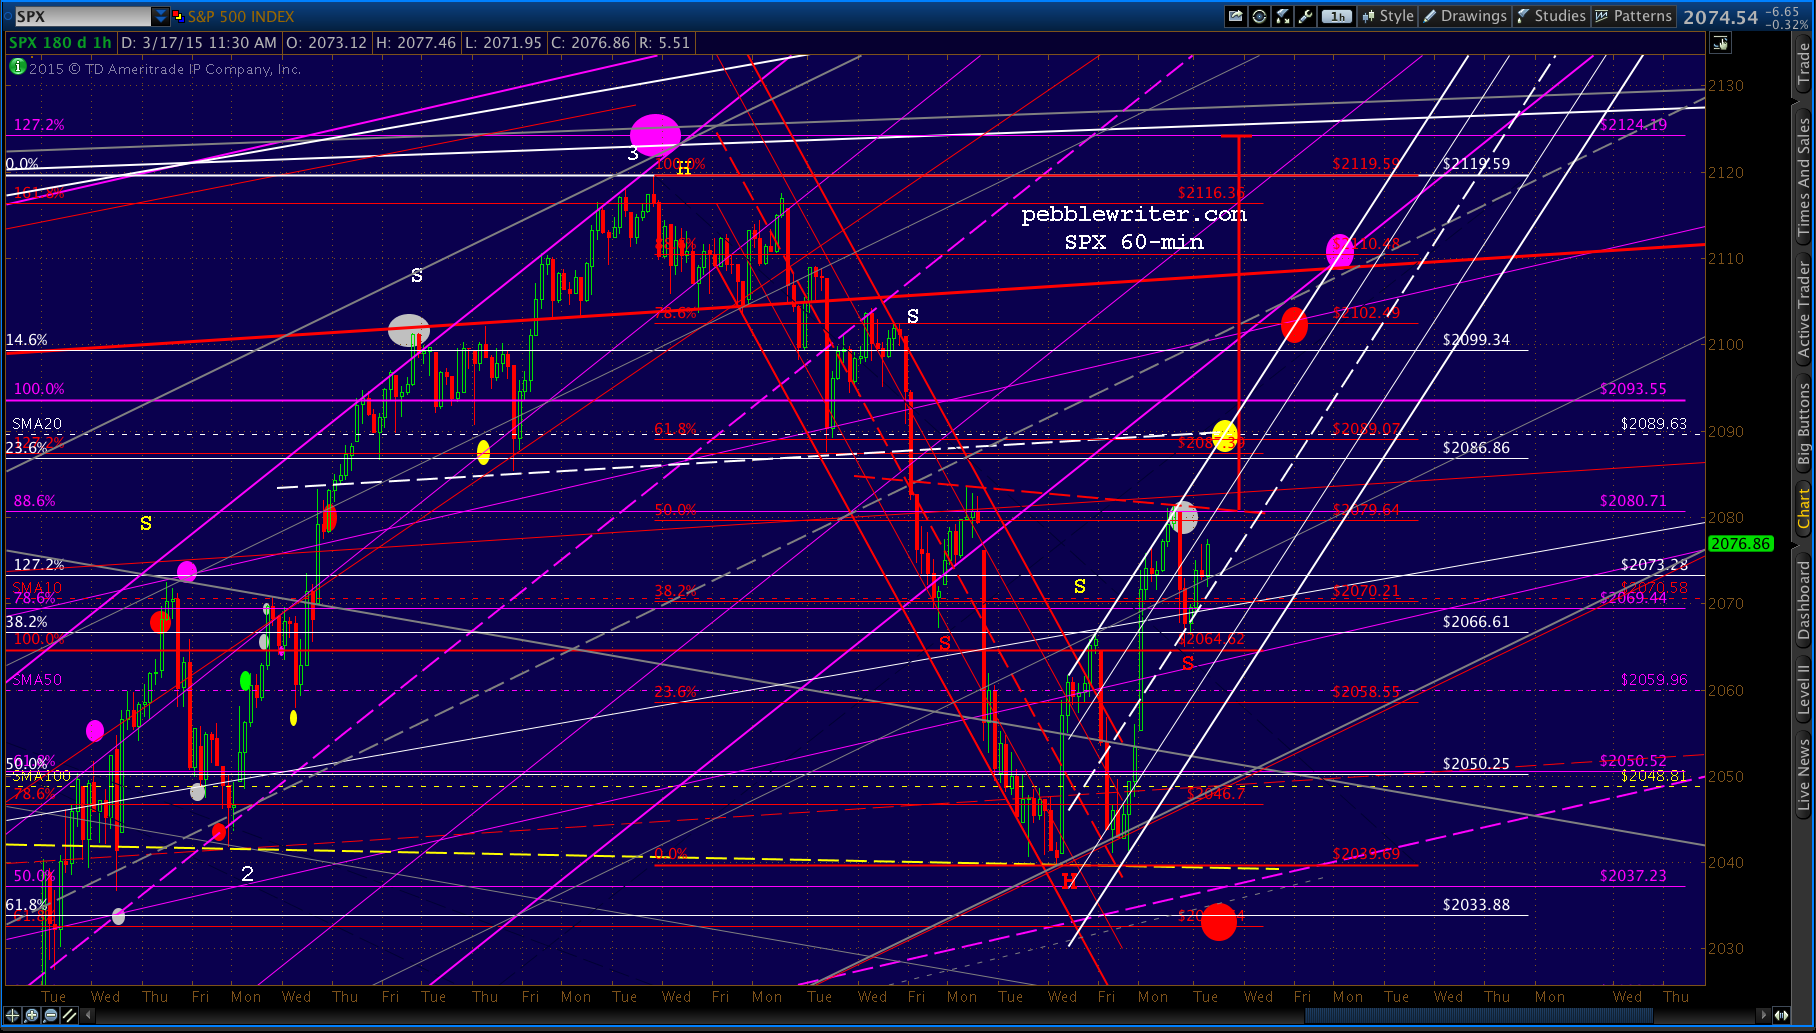
    Assuming SPX can get past the SMA20, the midline also intersects with the broken purple channel bottom for a backtest Thursday morning at the red .786 (or next Tuesday the 24th at the .886 at 2110.48.)

    The downside case (yes, there still is one) remains the white .618 at 2033.  The move up from 2039 to 2080 did avoid completing the H&S Pattern.  But, it also might have constructed a 4th wave of a 5-wave 61.8% retracement from 2124.

    Remember how we commented about VIX being a good indicator of what they really have in mind?  And, how the small red channel’s breakdown yesterday might be a head fake?  Check it out this morning:

    2015-03-17-VIX 60 0804All of the above is pure conjecture, and will  of course depend on whether oil really did hit bottom this morning and what the FOMC tells us tomorrow.

    Personally, I don’t expect a rate increase or a promise of a rate increase — for reasons that we’ve discussed many times.  The US can’t afford one any more than it can afford a higher dollar.

    UPDATE:  2:25 PM

    All I can say is “wow!”   The TPTB are so terrified that the “market” won’t be able to hold its own that they had to once again ramp USDJPY up out of the obvious direction it was heading.

    2015-03-17-USDJPY 60 1122Or, perhaps the brief breakdown through the gray channel bottom was just a head-fake.  I don’t know.  All I know is they succeeded in pushing SPX back above the SMA10.

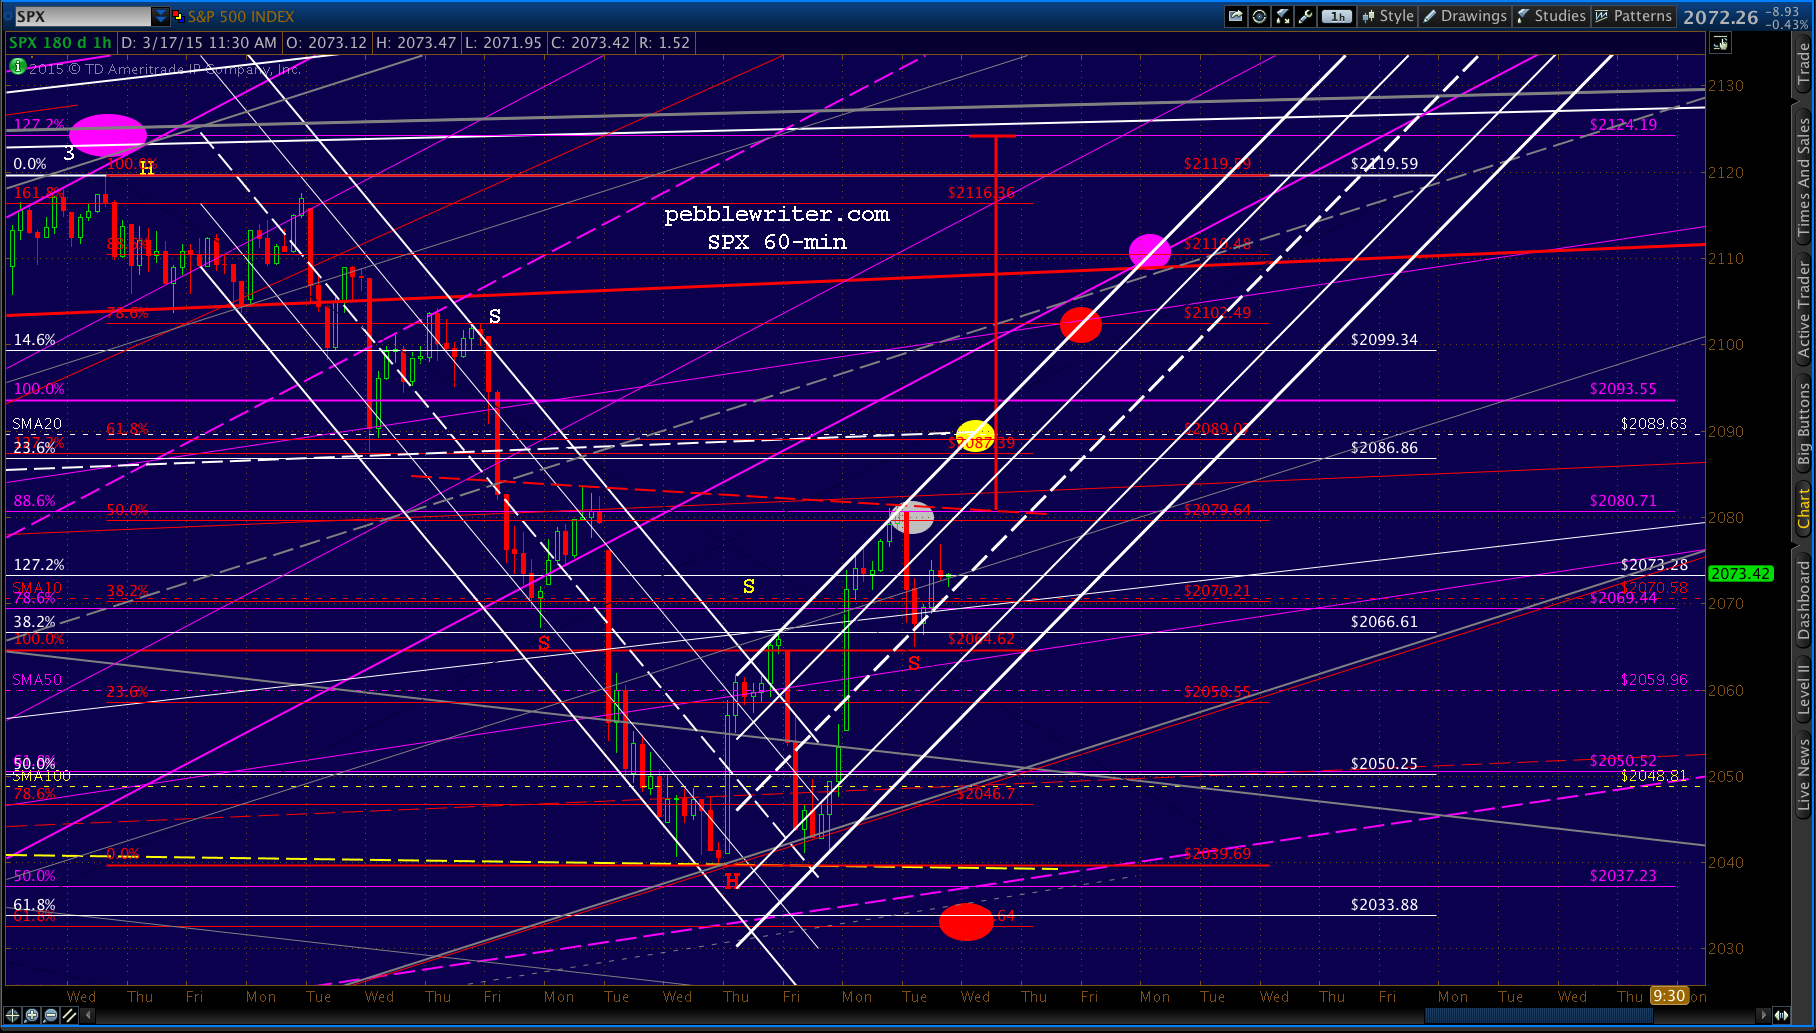
    2015-03-17-SPX 60 1122In light of this development, it’s worth noting that SPX is 7 points away from completing an IH&S (at 2080.80) that targets 2124.14.  If that’s the next stop, the rising white channel below would reach the yellow dot tomorrow morning and the red dot Friday morning.  The purple dot looks more like Monday morning.

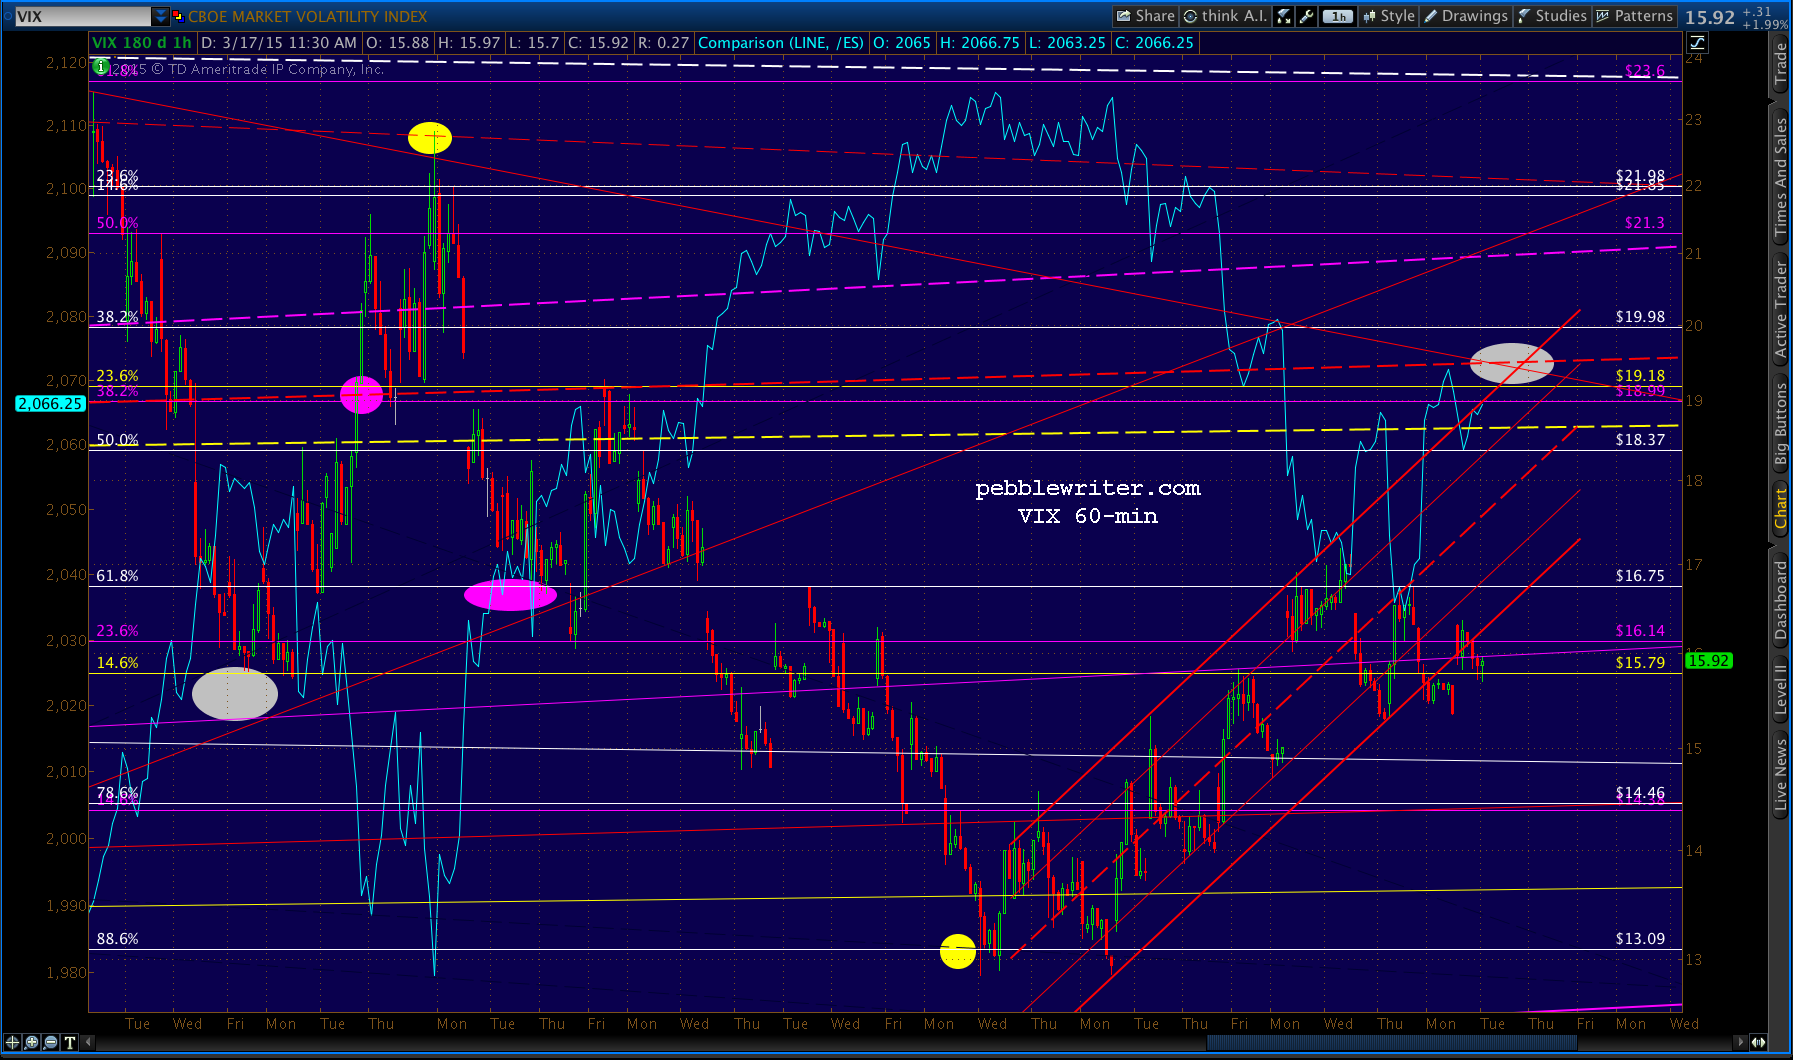
    2015-03-17-SPX 60 1154VIX’s earlier promising signal has petered out, falling back out of the rising red channel at this time…

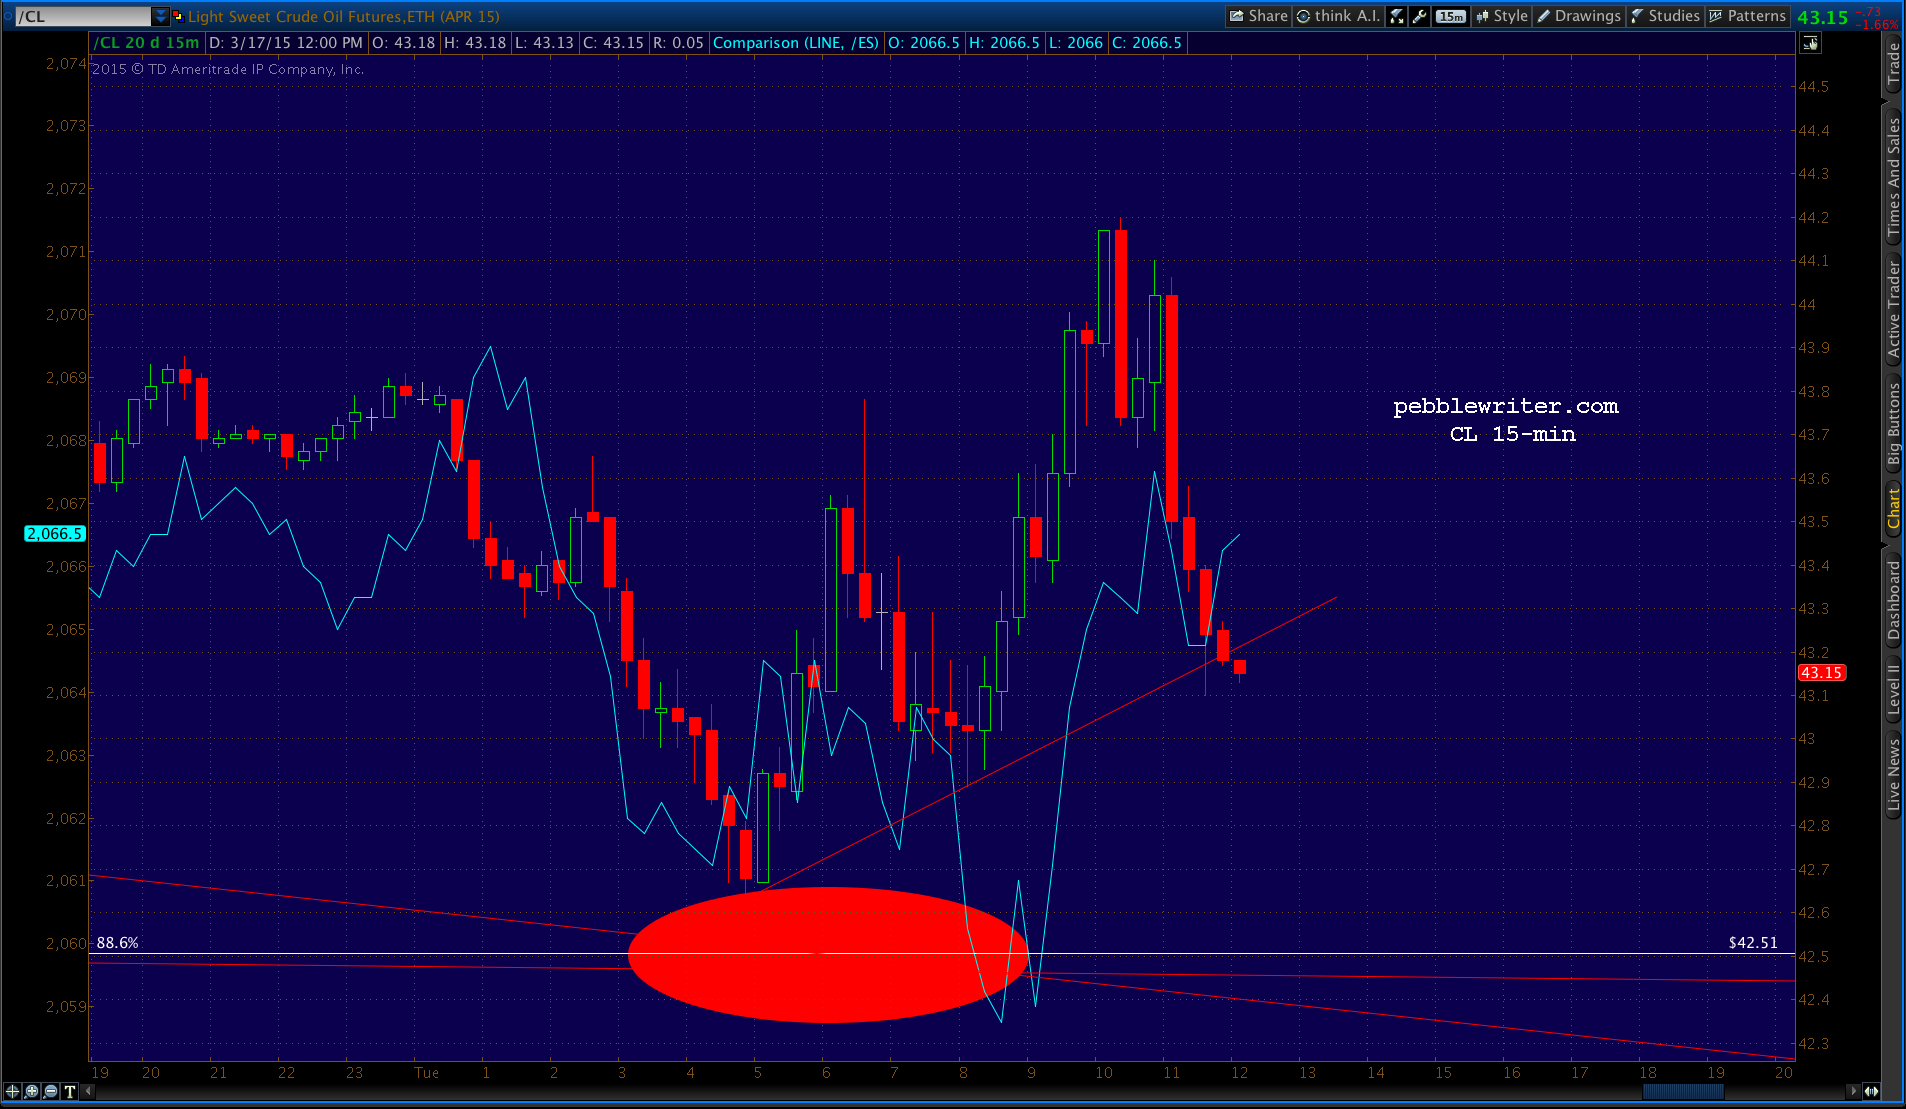
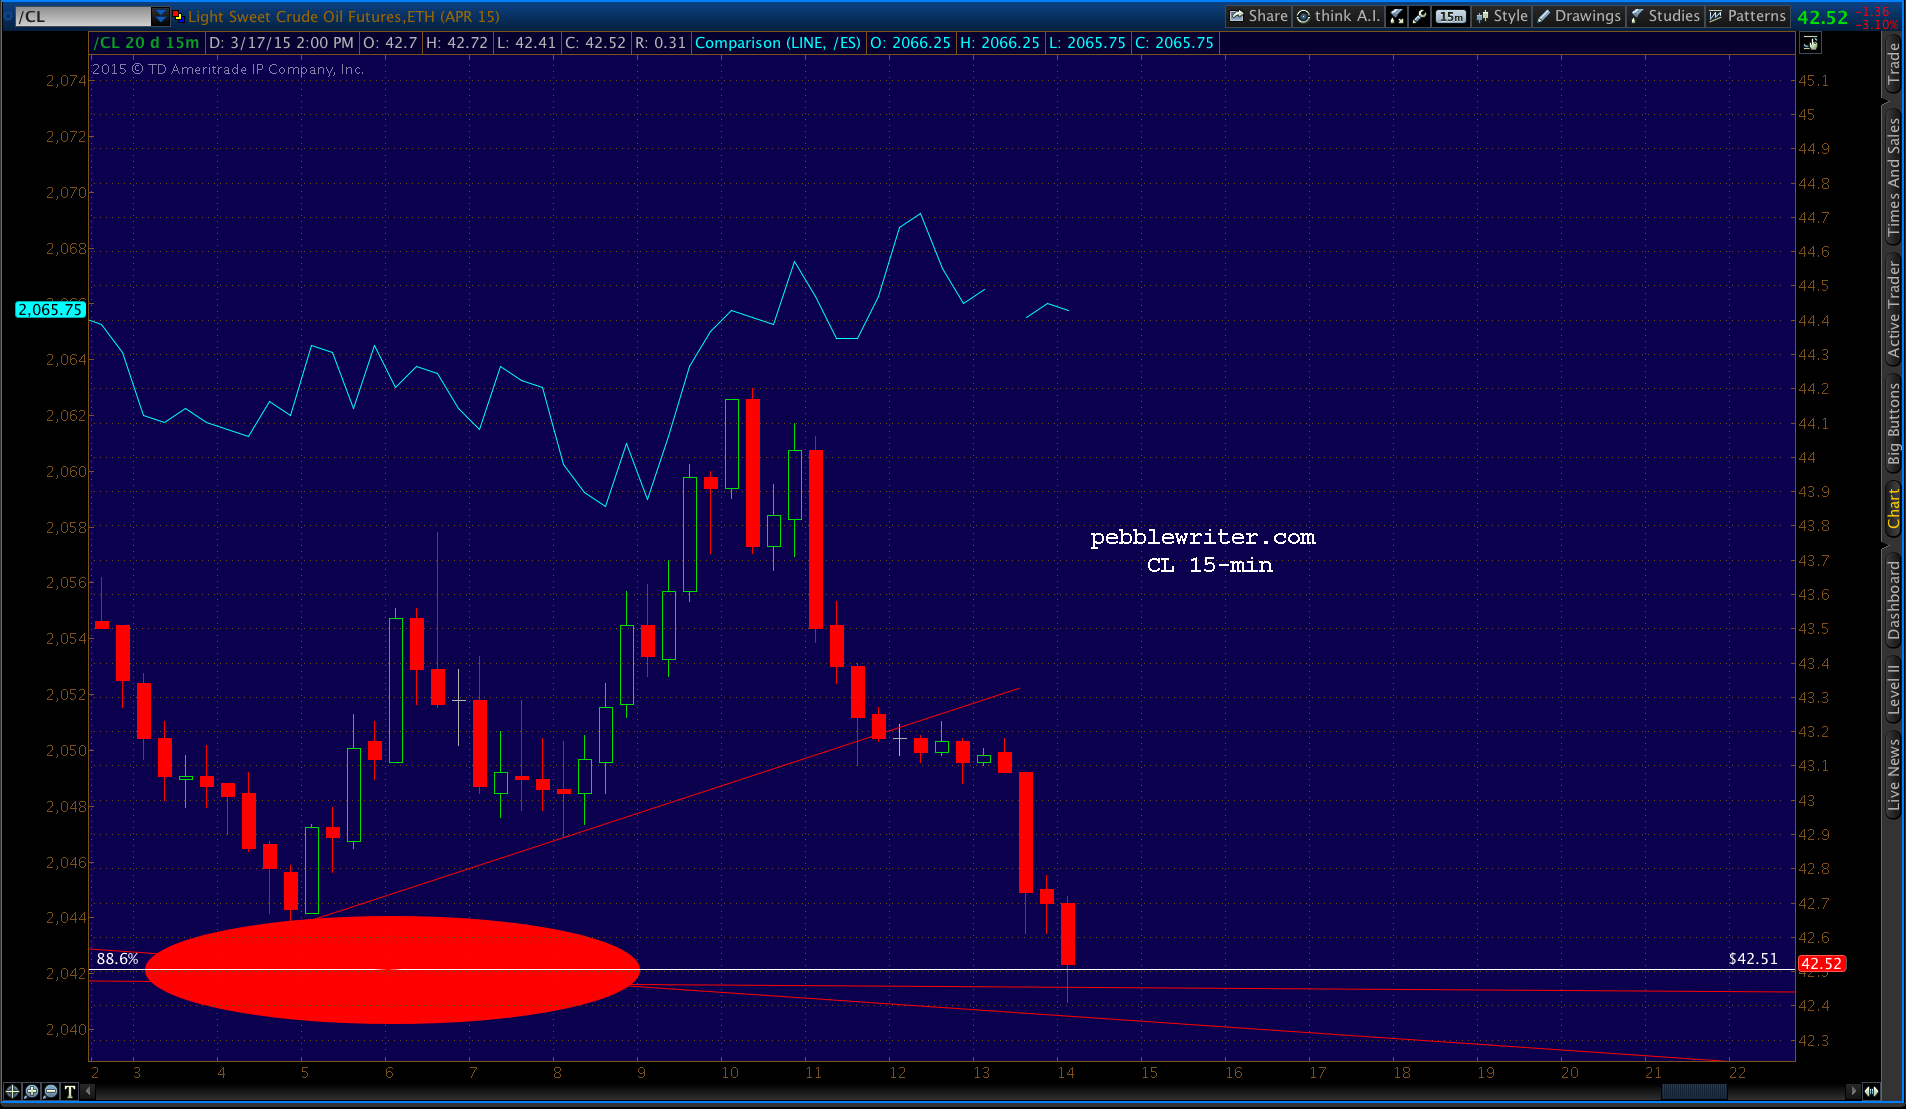
    2015-03-17-VIX 60 1154…as CL dips below the TL off this morning’s lows.  With an hour to go, will we have a repeat of yesterday’s ramp job transitioning into an after-hours reset?  Or, maybe a breakdown in the final hour to actually tag 42.51?  Stay tuned.

    2015-03-17-CL 15 1154UPDATE:  3:15 PM

    Here’s a better look at the SPX chart showing the 2124 IH&S target.  Note that it would just about tag the rising white channel top at the purple 1.272.  2015-03-17-SPX 60 1216

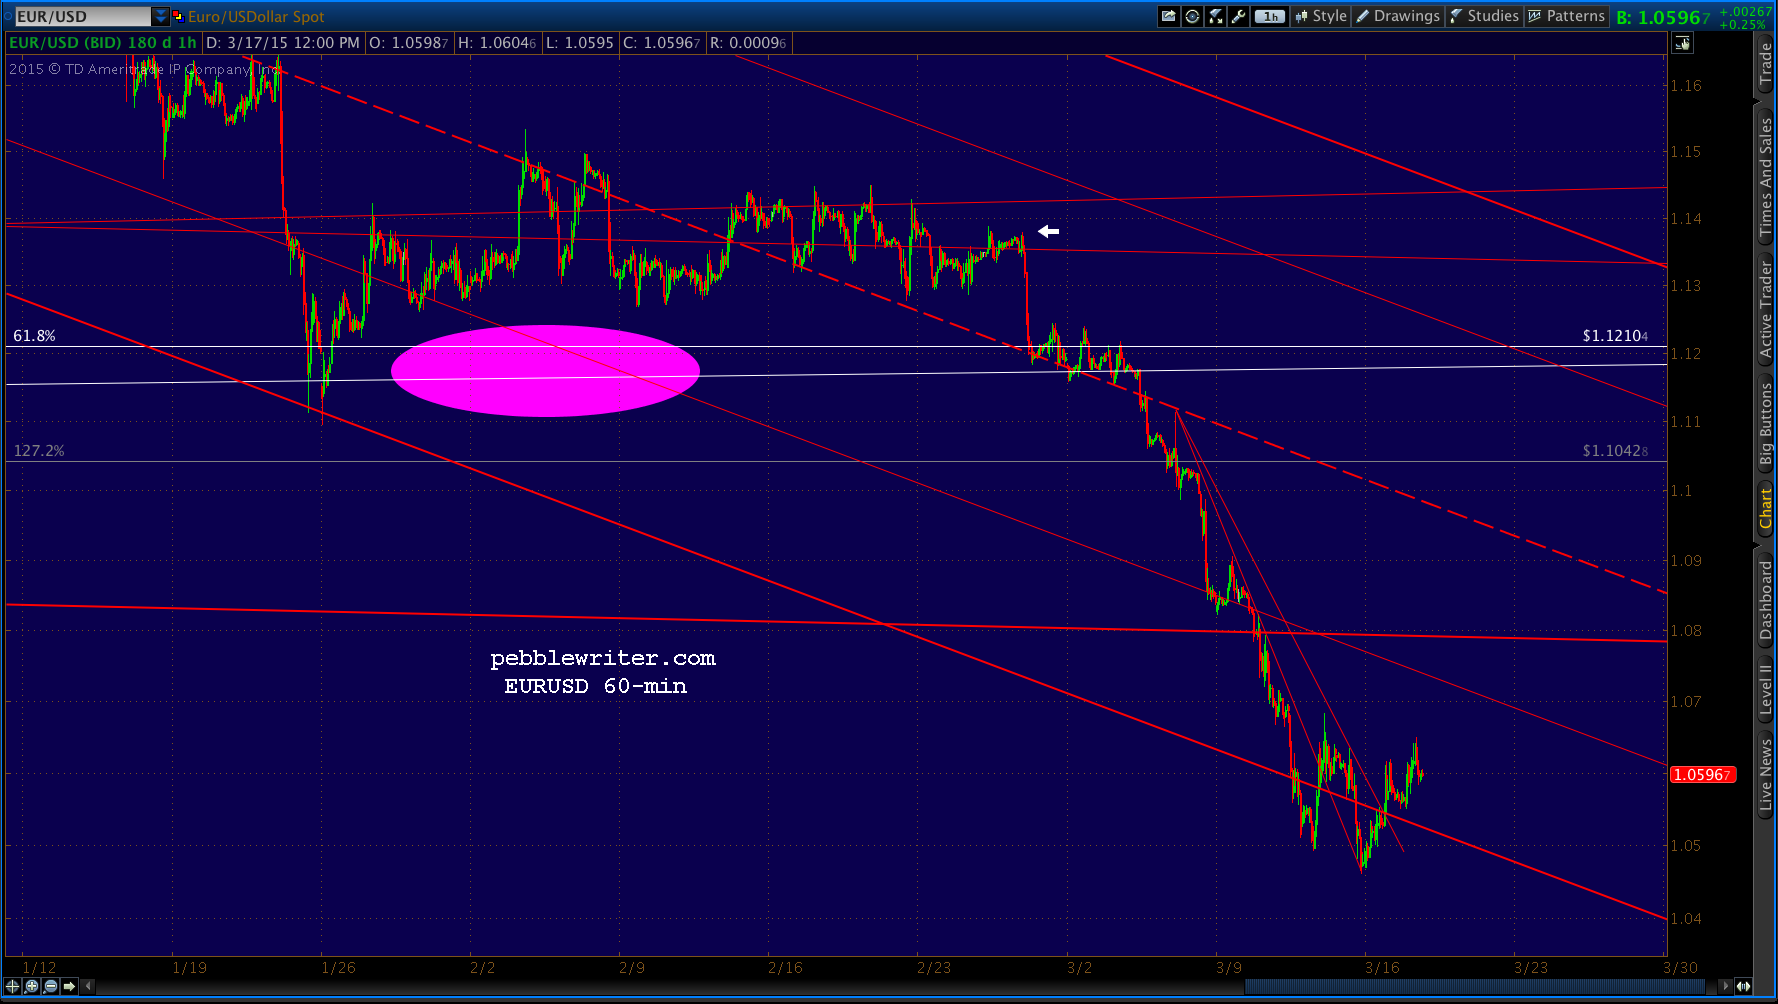
    This was the target back on Feb 25.  It looked awfully darn certain until the euro decided to collapse.  The white arrow below corresponds with SPX’s 2119.59 top.

    2015-03-17-EURUSD 60 1215UPDATE:  5:40 PM

    Lovely…

    2015-03-17-CL 15 1415

  • Update on Oil: Mar 17, 2015

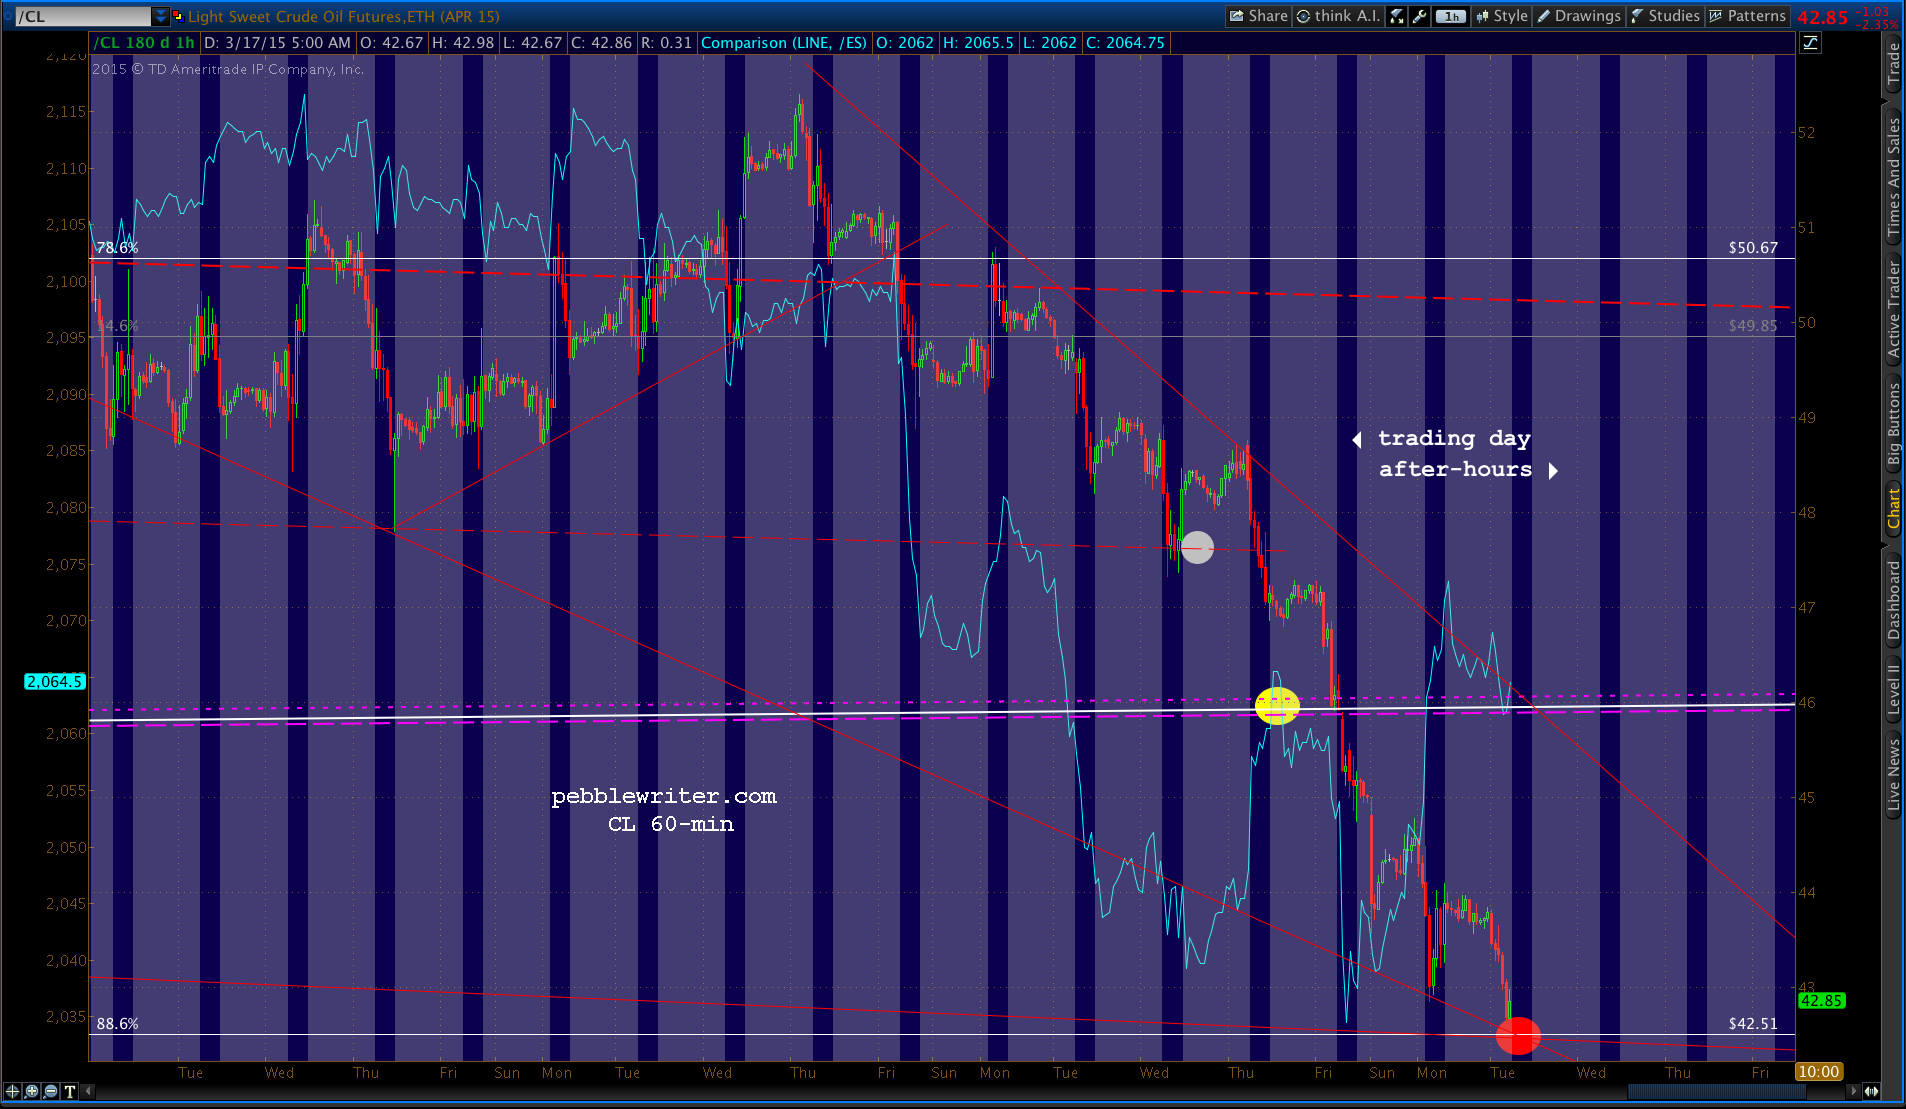
    Crude light (CL) is about to tag our 42.51 target — completing a Bat Pattern at the 88.6% retracement of the rise from 33.20 in Jan 2009 to the peak of 114.83 in May 2011.  We’re looking for a significant bounce.

    2015-03-17-CL wkly 523amClose-up on the 60-min chart:

    2015-03-17-CL 60 450amIn our last dedicated update [see: Jan 6 Update] we noted the trend line connecting the Dec 12, 1998 and Jan 15, 2009 lows:

    We discussed the bleak channel and TL standpoint.  From a price Fibonacci standpoint, the next major support is another 13% lower — the white .886 at 41.49 [note: now 42.51 due to price adjustments for contract changes.]

    Since CL broke through the trend line a few days ago, we have been expecting this drop.  Also as expected, it occurred during the after-hours (lighter color in the chart below), so as not to upset equity markets which are much more easily propped up in light volume.

    2015-03-17-CL 60 523am As we discussed about a week ago [see: Those Wacky Central Bankers,] oil’s massive price decline is both a reflection of and perfectly suits the US’ needs:

    – strong dollar
    – low inflation
    – low interest rates
    – continuation of the yen carry trade
    – penalties for our “enemies”

    In fact, oil’s decline was quite possibly the only major economic event which could have satisfied all of those critical needs — leading me to believe it was a deliberate take-down.

    From a chart pattern standpoint, failure of a 17-year trend line is a big deal.  But, so is completion of a Bat Pattern.

    2015-03-17-CL wkly ES divergSo, it’s going to be very interesting to see whether oil will rebound here as it normally would for technical reasons or continue to fall (or, at least flatline) because that’s the corner into which central banks have painted us.

    My gut tells me we’ll get a decent bounce that boosts stocks and allows USDJPY to reset (or, at least backtests the .618 at 120.11.)  A typical bounce after completing a Bat Pattern would be to the .618 Fib which, in this case, is 64.38 — so, we’ll put a pin in it. Though, that high a bounce could undo many of the benefits from this latest plunge.

    Stay tuned.

  • Charts I’m Watching: Mar 16, 2015

    The big story in the markets overnight is crude’s near collapse below the trend line from 1998 to test its Feb lows.

    2015-03-16-CL 60 0600The long-term chart:

    2015-03-16-CL weekly 0710But, USDJPY came to the rescue yet again, popping up to test (5th time) the falling red TL upper bound with a threatened breakout…

    2015-03-16-USDJPY 60 0600…and sending ES scurrying higher overnight.  It’s currently showing a 12.75 gain and backtesting the .382.

    2015-03-16-ES 60 min 0600The stage is set for SPX to pop and drop. But, the ramp job should get it up over the SMA50 at 2059.27 in the opening minutes.  So, it’ll be interesting to see whether it takes the bait.

    Note that USDJPY has backed off the channel top, and is signalling a retest of the white channel midline or lower — but, not until it’s done providing cover for oil

    2015-03-16-USDJPY 60 0630It now appears more likely that the backtest of the yellow .618 at 120.11 might wait until Wednesday — perhaps as the initial kneejerk reaction to the Fed announcement.

    continued for members(more…)