Month: March 2015

  • Update on the Dollar: Mar 13, 2015

    In October 2013, after the dollar had reached our long-held 79.60 target, we naively opined:

    The dollar finally reached our 79.60 target [see: Sep 20 Update] overnight and should see a bit of a technical bounce here at a large scale .886 (white) and medium scale 1.618 (purple.)

    It wasn’t a completely ridiculous call — just naive.  DX had recently broken down through a long-term channel bottom (red below) and an even longer-term channel midline (in white.)

    https://pebblewriter.com/wp-content/uploads/2013/10/2013-10-18-DX-since-May-2011.png

    We observed that a declining dollar in the US — a net importer — usually leads to an increase in CPI.  This was troubling, as it seemed the dollar was due to fall further at a time when inflation had already bounced off long-term lows.

    I suppose someone in the central planning control room was thinking the same thing.  Because, they put a floor (dashed yellow line) under the dollar right then and there.

    2015-03-13 DX wkly 1500The yen plummeted from 100 to 122 to the dollar (its high earlier this week) and the euro plummeted from 1.39 to about 1.05 USD.

    As we discussed yesterday [see: Those Wacky Central Bankers] this was not a random occurrence.  Along with oil’s take down, it was a carefully orchestrated exercise that — among other goals — would shift inflation from the US (which wasn’t prepared for it) to Japan and the eurozone.

    By keeping inflation under control, interest rates could also be kept at a manageable level — an important issue when a return to historical norms would triple the country’s annual debt service.

    Equally important, a plunging yen would keep the yen carry trade alive and stock prices on an upward slope. For details on the BOJs role in inflating markets, see: Invasion of the Market Snatchers — a 3-part series which began today.

    Nothing lasts forever, as they say.  And, the dollar is approaching its next major hurdle.

    continued for members(more…)

  • Update on EURUSD: Mar 13, 2015

    When we last examined EURUSD [see: Jan 23 update] it had just reached our Dec 3 target at the .618 Fib level of 1.12.

    2015-01-23 EURUSD wkly 1000

    We were looking for a bounce, but its magnitude was a big question mark.

    The degree of any technical bounce is a bit tricky.  It would take a lot of short covering to effect a meaningful retracement.  After all, the ECB is officially trashing the euro to the tune of 1 trillion bucks.

    The widely held expectation is that the Fed will “soon” be raising US interest rates, and therefore strengthening the USD — a viewpoint we don’t share, by the way.  If we’re right, and US rates remain low or trend even lower, this will put pressure on the dollar and, in return, strengthen EURUSD.

    We speculated about whether our next downside target of .9898 might not arrive until later in the year, and left readers with the admonition:

    Keep an eye on this critical support here at 1.1210.

    That support has since been crushed underfoot by the thundering herd scrambling for the exits.  The bounce off the .618 never got above 1.1533 and lasted only 22 sessions.

    2015-03-13 EURUSD daily 1300What’s worse, it now’s now in danger of losing all support all-together.  continued for members... (more…)

  • Invasion of the Market Snatchers

    The Wall Street Journal recently reported that, over the past two years, the Bank of Japan has purchased stocks on 96% of the days when the market opened lower or closed lower after initially opening higher.  In this two-part series, we’ll pick up where the Journal left off and examine how this activity by the BOJ — now the single biggest owner of Japanese stocks — has led to a bigger stock market bubble than in 2000 or 2007.

    *  *  *  *  *

    pods
    “Looks harmless enough. I’ll just give it a little poke and… hey, what the–!?”

    What do you call it when it looks like a market, walks like a market, sometimes even quacks like a market… but it’s not like any market ever before seen on this earth?

    One of the more interesting articles I’ve seen in quite a while is this Wall Street Journal article published Wednesday that discusses how, for the past five years, the Bank of Japan has been — and, you should probably sit down for this — manipulating the markets!   I know, I know.  Shocking, right?

    This is hardly news to pebblewriter members.  We’ve lamented it ad nauseum for years.  But, the article caught my eye because it’s one of those rare few mainstream media articles that openly discusses a practice which many investors regard as conspiracy theorist delusions.

    The Prologue

    The BOJ first obtained approval to buy ETFs and REITs back in 2010.  Like the S&P 500, the Nikkei 225 had tumbled about 60% during the crash.  Unlike SPX, which didn’t bottom out until March 2009, NKD hit bottom (7425) in October 2008.  And, in a remarkable coincidence, again in March 2009 (yes, exactly 7425.)

    Also unlike SPX — which regained a Fibonacci 61.8% of its losses by April 2010 — NKD regained only 38.2% (also a Fib) of its losses.  On the way to there, it dipped to 9490 — not once, but twice.

    So, when it dipped a third time (yes, to exactly 9490) it set up what we chartists call a Head & Shoulder Pattern.  The chart below shows each of the two shoulders marked with a red “S” and head with an “H.”

    2015-03-13 NKD daily 2009-10The only thing necessary to complete the pattern was a substantial bounce and a subsequent drop below that dashed red line (the “neckline”) at 9490 — which was delivered on August 24, 2010.

    The completed pattern targeted 7095 — a huge 25% decline.  The Japanese needed a 25% correction like they needed a 9.0 earthquake.

    Enter the Bank of Japan, which had plenty of experience with quantitative easing (QE) of the government bond buying and currency manipulation variety.  Maybe, just maybe, they could help out on the stock market front as well.  From the WSJ:

    BOJ officials used to be cautious about purchasing ETFs, worried that it could distort market activities and put the central bank’s own financial health at risk.  But, under pressure from politicians following the global financial crisis, the bank changed its stance in late 2010.

    “We led the cows to water, but they didn’t drink it, even though we told them it tasted good,” Miyako Suda, who was a board member then, wrote in a a 2014 book discussing monetary easing at that time.  “So we thought we should drink it ourselves, showing them it was tasty.”

    The BOJ rushed through a plan to purchase ¥76 trillion (then, about $1 trillion USD) in “tasty” financial assets that included ETFs and REITs.  From the Principle Terms and Conditions:

    Screen Shot 2015-03-12 at 11.17.38 PMThe rumors that the BOJ would actually be buying stocks — trillions of yen in stocks — were, alone, enough to send the Nikkei scampering back above that neckline.  By the time the program was actually instituted, NKD put 9490 in its rear view mirror for good.

    2015-03-12 NKD daily 2009-2010Or, so everyone thought.

    next: the pods open…


  • Charts I’m Watching: Mar 13, 2015

    SPX broke out of the falling white channel yesterday… 2015-03-13 SPX 60 0615…largely on the back of USDJPY, which rallied sharply…

    2015-03-13 USDJPY 60 0615…to offset CL, which tumbled to our target — in the after-hours, of course.  When it comes to manipulating prices higher, it’s important to backfill at night, when the e-mini volume is light enough to prop it up cheaply.

    2015-03-13 CL 60 0615Now that the cash markets are open, let the spoofing begin!

    continued for members(more…)

  • Charts I’m Watching: Mar 12, 2015

    SPX reached the SMA100 yesterday, less than six points from our target of 2033.88 — but, couldn’t quite punch through.  The target remains unchanged from Mar 4.

    2015-03-12 SPX 60 0600We’re watching to see whether or not the overnight ramp job can hold, with futures currently up about 7.50.  2015-03-12 ES 60 0610USDJPY is being rather coy — bouncing off the easy initial red TL support after reaching our first downside target: the white channel midline.  Had it happened during trading hours, SPX would have bagged 2033 by now.  We’re still looking for 120.11.2015-03-12 USDJPY 60 0615 0600And, CL — which reached our 47.66 target yesterday — is back in the rising purple channel (for now.)  If it’s going to break down and tag our 45.86 target, today really is the day.

    2015-03-12 CL 60 0610The two most interesting charts are DX and EURUSD.  Both are showing a bit of a reversal, which — when it occurs for real — will be the biggest potential game changer around.

    continued for members(more…)

  • Those Wacky Central Bankers!

    The euromess continues to have everyone on edge. The genius of Mario Draghi is that he trashed the euro and took interest rates below zero without having to do much besides flapping his gums.

    2015-03-11-EURUSD daily 0620The idiocy of Mario Draghi is that the euro and eurozone interest rates have sunk so low, no one knows whether or how they’re going to stabilize now that QE has finally begun.

    The global markets have risen to stratospheric heights on the back of dollar strength and yen/euro weakness, plain and simple. We’ll take a fresh look at the current state of the carry trade in the next few days.  But, even the White House admits that dollar strength is becoming a fundamental problem.

    And, while some believe the yen will fall further (140 is tossed around quite a lot), there is increasing pushback by the Japanese consumer and businessman alike (see: HERE.)  If not for the plunge in the price of oil (which is trying to find support here, by the way) Japan would have way more inflation than it can manage.

    2015-03-11-CL 60 0711Contrary to Abe’s fairy tale figures, overall inflation reached 4.4% last May, and has since backed off to 2.8% thanks to energy.  But, fresh food prices are up 15% since November. And if, as I suspect, oil has bottomed out for now, Japan Inc. will be hard pressed to flog the yen any further without deepening the death spiral in which it already finds itself.

    20140902_citi3We’ve speculated as to whether the ECB can (let alone should) accomplish the same results as the BOJ.  The eurozone has a definite deflation problem.  So, to the (very questionable) extent that QE could solve that problem, buying up €1.1 trillion in bonds might seem like a good thing.  The “markets” would certainly appreciate the injection of cash.

    But, where to put €1.1 trillion?  As the research shows, there just aren’t enough attractive, eligible bonds laying around.  And many of them already feature negative yields.  Buying them at current prices already guarantees an investor will lose money.  Can the fractious eurozone support such an endeavor, especially when voters come to realize they won’t benefit one iota?

    Then, there’s the dollar.  If the euro and the yen continue getting cheaper, it would obviously continue to rise in value.  US consumers are happy as clams pumping cheaper gas into their cheaper Toyotas and Mercedes. But, the handful of exporters still kicking in the US are hurting.

    And, there’s that elephant in the room: how to take central bankers’ big, fat feet off the gas without reversing all those carry trades and crashing the global economy (along with stock markets everywhere?)

    The last time oil prices plunged like this, stocks reflected the concurrent economic weakness.  This time, they haven’t — at least, not yet.

    2015-03-11-CL v SPX wklyIs it because economic conditions aren’t all that bad, and the oil price decline is out of sync?  Or, perhaps the economy is in big trouble, as oil accurately reflects; and, stocks are being driven higher by unrelated factors.

    We think the actual answer involves a little of each.  Let’s summarize:

    JAPAN

    1. Japan’s economy is circling the drain.  It has gone all-in on QQE in order to stay alive.
    2. Japan’s plummeting yen has fueled the carry trade, driving stocks everywhere higher.
    3. Japan’s plummeting yen was crippling consumers and businesses — until oil plunged.
    4. The BOJ is officially monetizing the Japanese gov’t (and increasingly its stock “market.”)
    5. If inflation remains under control, the yen could be trashed even further.

    EUROZONE

    1. The EZ’s economy is circling the drain.  It just instituted QE in order to stay alive.
    2. The plunging euro has also helped fuel the carry trade.
    3. The plunging euro has not impacted consumers yet — again, thanks to low oil prices.
    4. The ECB is indirectly monetizing eurozone governments.
    5. Deflation is a huge and real concern.

    UNITED STATES

    1. The US economy has seemed fine on the surface; in reality, it’s faltering badly.
    2. The soaring dollar has helped fuel the carry trade.
    3. The soaring dollar has helped consumers due to lower oil and other import prices.
    4. The Fed has ended QE (for now), but has zero desire to see interest rates rise.
    5. Inflation is under control (for now), but could soar if the dollar plunged in value.


    How do all these factors explain the current state of affairs? Let’s put it all together.

    The driving force is the US, which desperately needs inflation and interest rates to remain under control. Otherwise, the nation’s debt service payments would get out of hand, the bond bubble would burst and equities would plummet. It also needs consumers to increase borrowing and spending.

    One key element is lower oil prices, which are largely a factor of a strong dollar and increased domestic production.

    While oil and gas capital expenditures total about 10% of US CAPEX, they represent only about 1% of US GDP. In other words, the US can weather the price decline without much damage to the average American or to GDP (employment is another matter.)

    Keeping oil prices low allows Japan to maintain its QQE and incentivizes the ECB to increase its QE — thus supporting the carry trade and continuing stock “market” expansion.  It also offers the side “benefit” of punishing Russia for its actions in the Ukraine.

    If oil prices were to rise and/or the yen fall much further, Japan’s will to support the carry trade might falter.  The eurozone, on the other hand, is ostensibly open to higher oil prices in order to increase inflation.  It’s an idiotic bold experiment that is likely to end in failure as it did in Japan.  But, that’s a crisis the next crop of kleptocrats can deal with.

    How about our Middle East “friends” and the good folks at Big Oil?  OPEC doesn’t seem too alarmed by falling oil prices.  It’s the (temporary) cost of stifling shale oil & gas production in the US, not to mention chipping away at ISIS oil revenues which have been estimated at $3 million/day.

    And, Big Oil — while taking a beating on last quarter’s earnings — is likely licking its chops at the cheap reserves that will come available as more highly leveraged and less stable companies go belly up.  We wouldn’t be surprised if the majors were not only well aware of the decline, but helped orchestrate it, too.

    So, yes (in case you were wondering), we suspect oil’s abrupt decline was scripted — engineered in order to meet the otherwise conflicting needs of the G7 for low interest rates, low inflation and rising stock prices in the face of a global economic slowdown.

    Will it work? Absolutely! *


    (* until it doesn’t)



  • Charts I’m Watching: Mar 11, 2015

    SPX hit our purple target yesterday, bounced to the first level of resistance at the SMA50, and continued toward the red target.  The purple target was first suggested on Mar 4:

    If the H&S should play out, it would target around 2060 — which is coincidentally (or not!) the SMA50 and might allow a backtest of the broken falling gray channel.

    We added the red target on Mar 6 [see: Is Good News Good?]

    2015-03-06 SPX 60 1040The white dot (2062-2066) would suffice, but an actual tag would be down around the purple dot at 2057.   If that should fail, then the red dot at the white .618/SMA100 intersection (2033ish) makes a great deal of sense.

    BTW, the white channel below is new, having been placed there to illustrate the proportion of the latest decline relative to the previous.  It’s a lame placement, but one that bulls might just latch on to (we know, never end a sentence with a preposition; but, doesn’t “a placement onto which bulls might just latch” sound silly?)

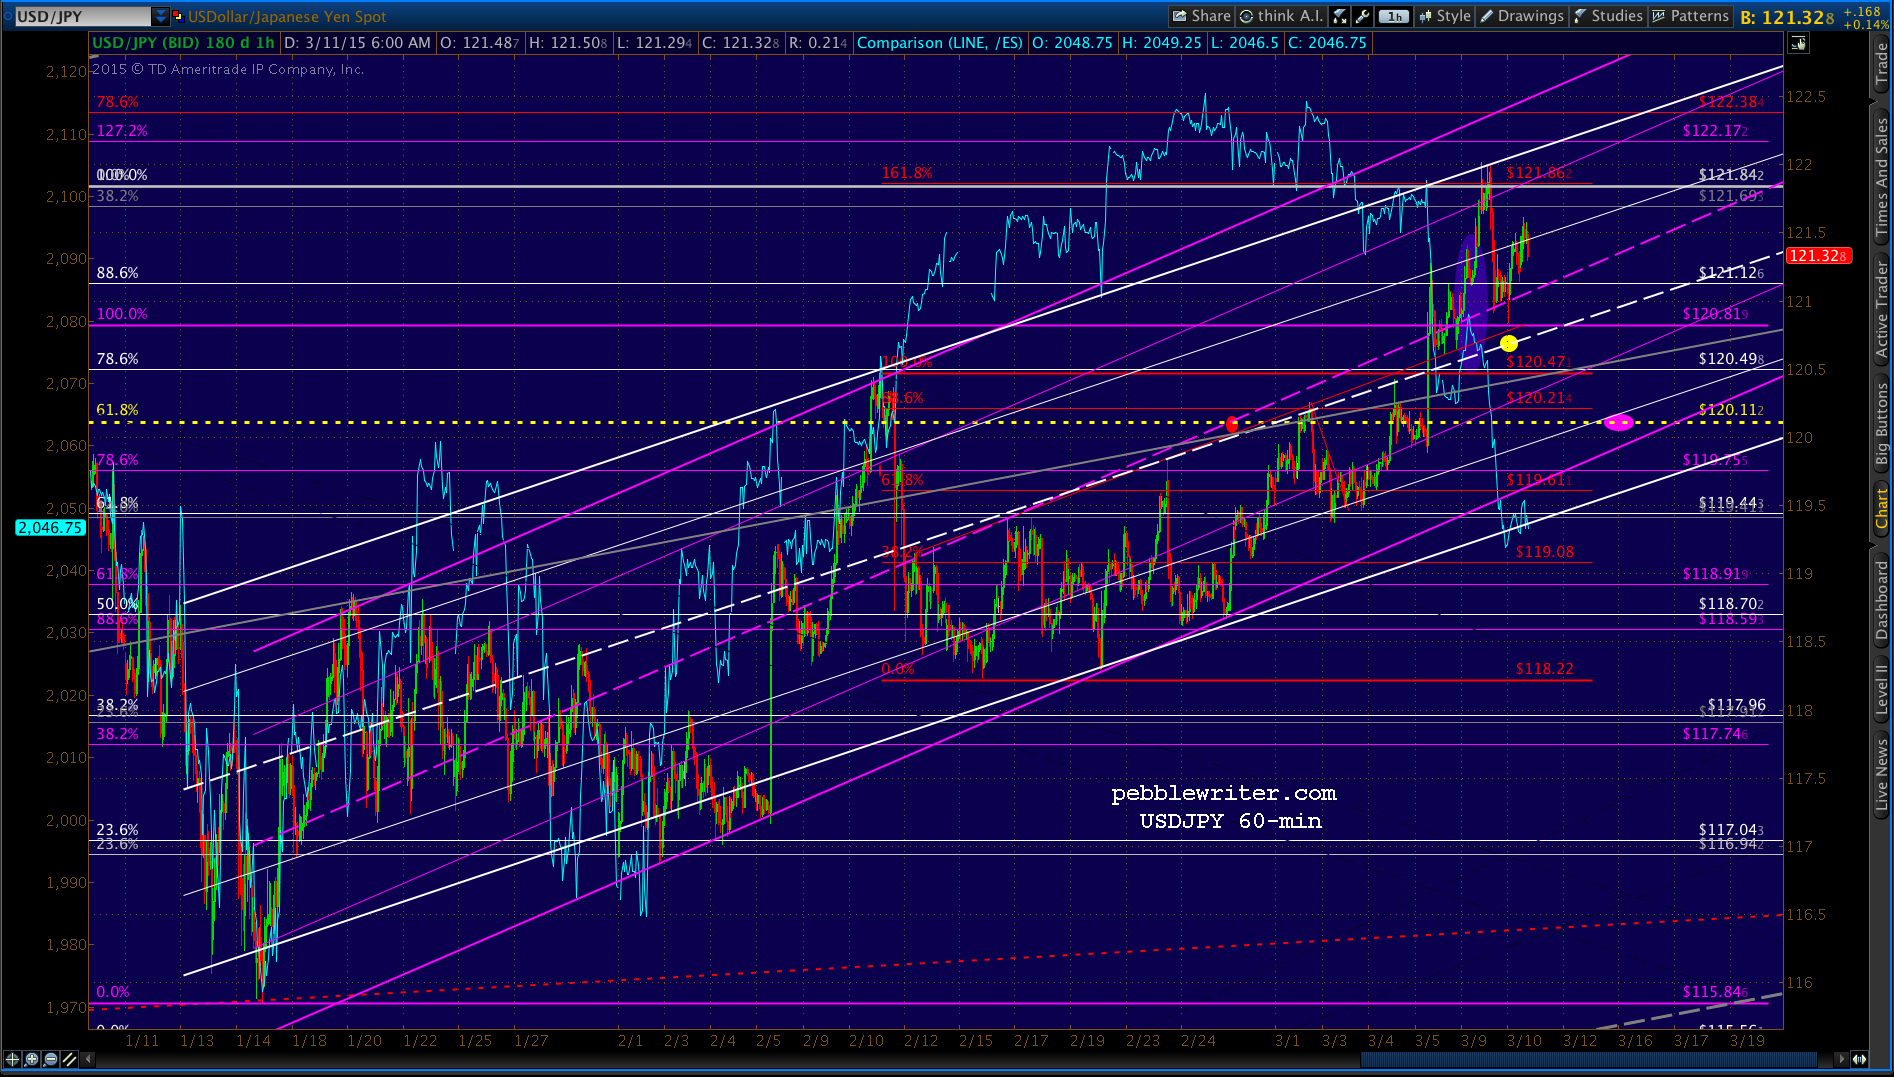
    2015-03-11-SPX 60 0621The futures are up about 5 points overnight due to the usual USDJPY antics.  Here, too, I’ve inserted a new channel.  The white one we’ve been using offered a well-defined top and midline and a messy bottom.

    The purple one we’ve inserted is a bad fit, but one that the bulls will pray is legitimate.  The way the BOJ sees it, any chart pattern is fine as long as it targets the moon.

    2015-03-11-USDJPY 60 0621Since so much is riding on USDJPY, EURUSD and CL at the moment, this post is continued at: Those Wacky Central Bankers.  There, we’ll try to make some sense of the plunge in oil prices, the euro and the yen in light of central bank objectives.

  • Charts I’m Watching: Mar 10, 2015

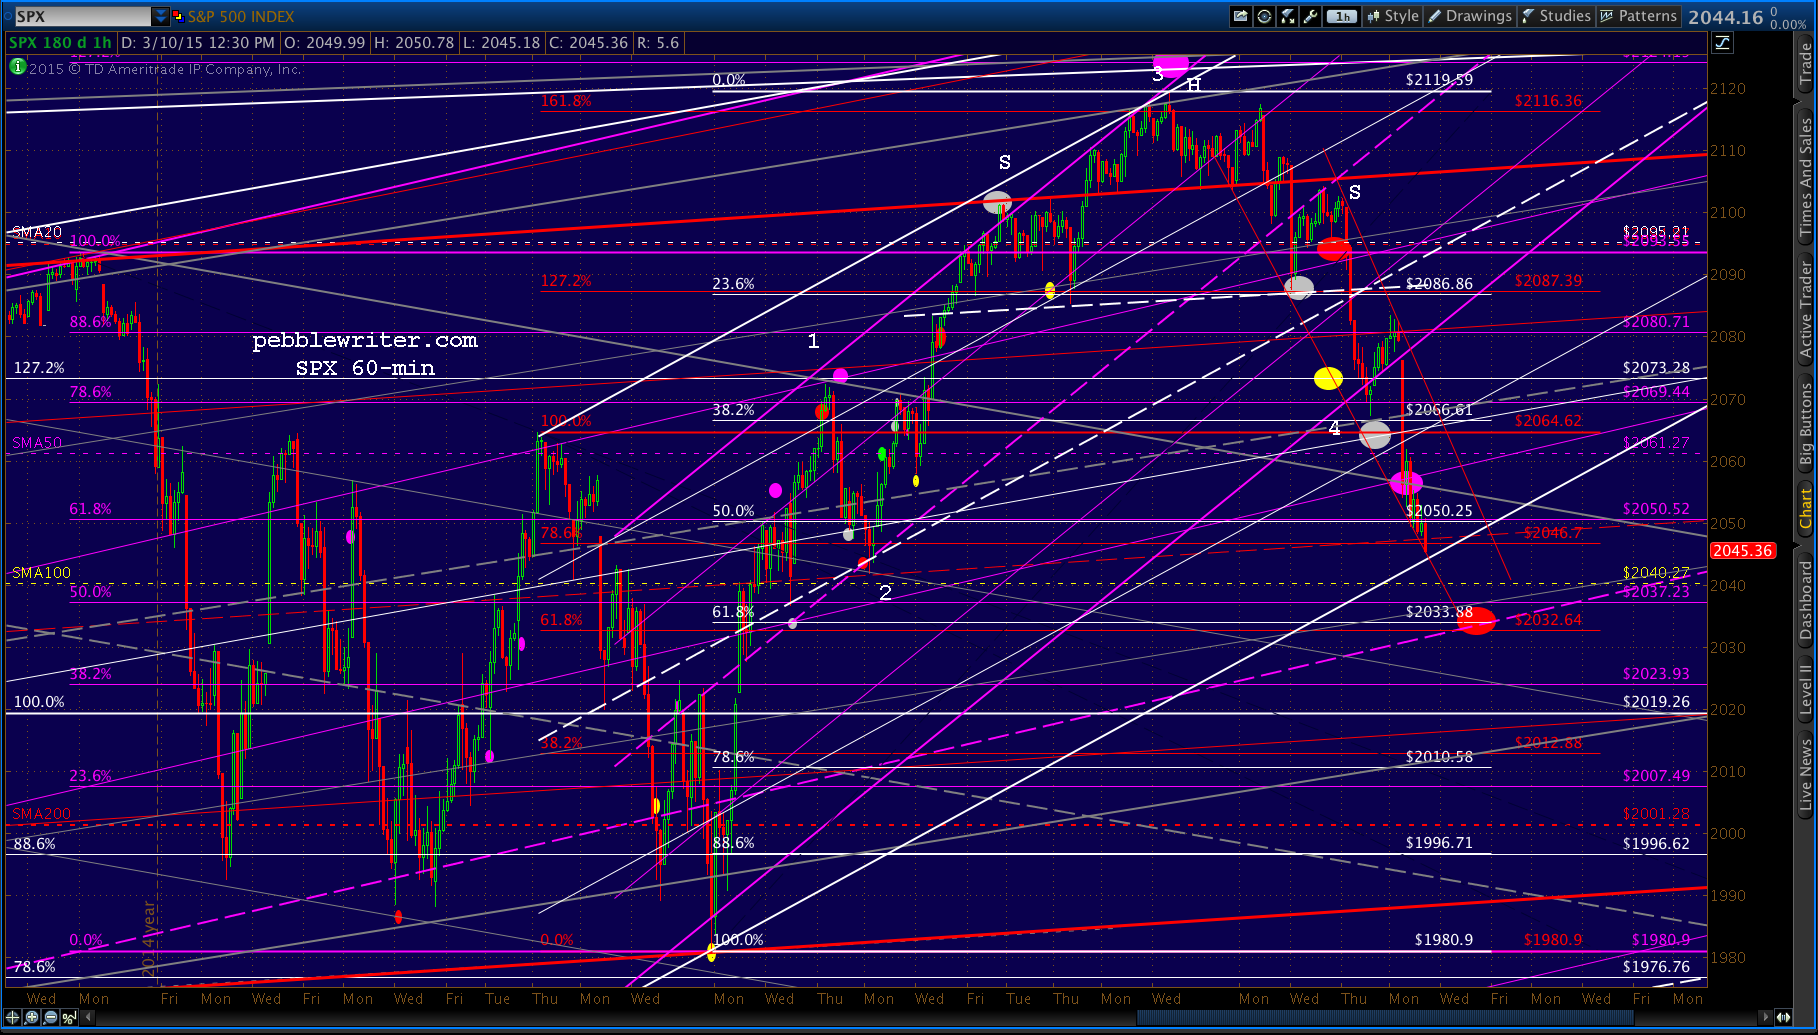
    Last Friday, we updated SPX’s price targets to reflect the completion of the H&S Pattern we had originally forecast back on March 4.

    If the H&S should play out, it would target around 2060 — which is coincidentally (or not!) the SMA50 and might allow a backtest of the broken falling gray channel.

    Ultimately, I think we’ll see backtest of the falling gray channel as we suggested last Wednesday.

    With the e-minis off as much as 20 points earlier this morning, the stage is indeed set for our target — the SMA50 — to be tested.

    2015-03-10-ES 60 0600As we discussed in yesterday’s members’ section:

    …at this point I’d have to go with more downside before the big bounce gets started in earnest.  The SMA50 at 2062 would be a good starting point, though the gray channel backtest at 2055-2057 is more appealing.

    From there, the “market’s” next moves might surprise a lot of traders.

    continued for members(more…)

  • Charts I’m Watching: Mar 9, 2015

    Last week’s charting worked out well, with the H&S Pattern and price targets we forecast Wednesday Mar 4

    2015-03-04-SPX 60 0652…playing out nicely by Friday.

    2015-03-09-SPX 60 0600USDJPY reached our 121.12 target a few days ahead of schedule — which, unless the previous high is at least tested, will leave it with little levitating power.

    2015-03-09-USDJPY 60 0601And, CL is showing few signs of being ready to reverse just yet.

    2015-03-09-CL 60 0630Aside from the ECB’s QE finally starting, and a couple of Fed president’s speaking today, I don’t see a lot that could change Friday’s intermediate-term forecast.

    continued for members(more…)

  • Is Good News Good?

    Futures responded to this morning’s jobs numbers by promptly selling off…

    2015-03-05-ES 60 0615Look for ES to complete the little H&S Pattern targeting 2052.  Whether it’ll be allowed to play out is another matter altogether.  USDJPY ramping is in full swing…

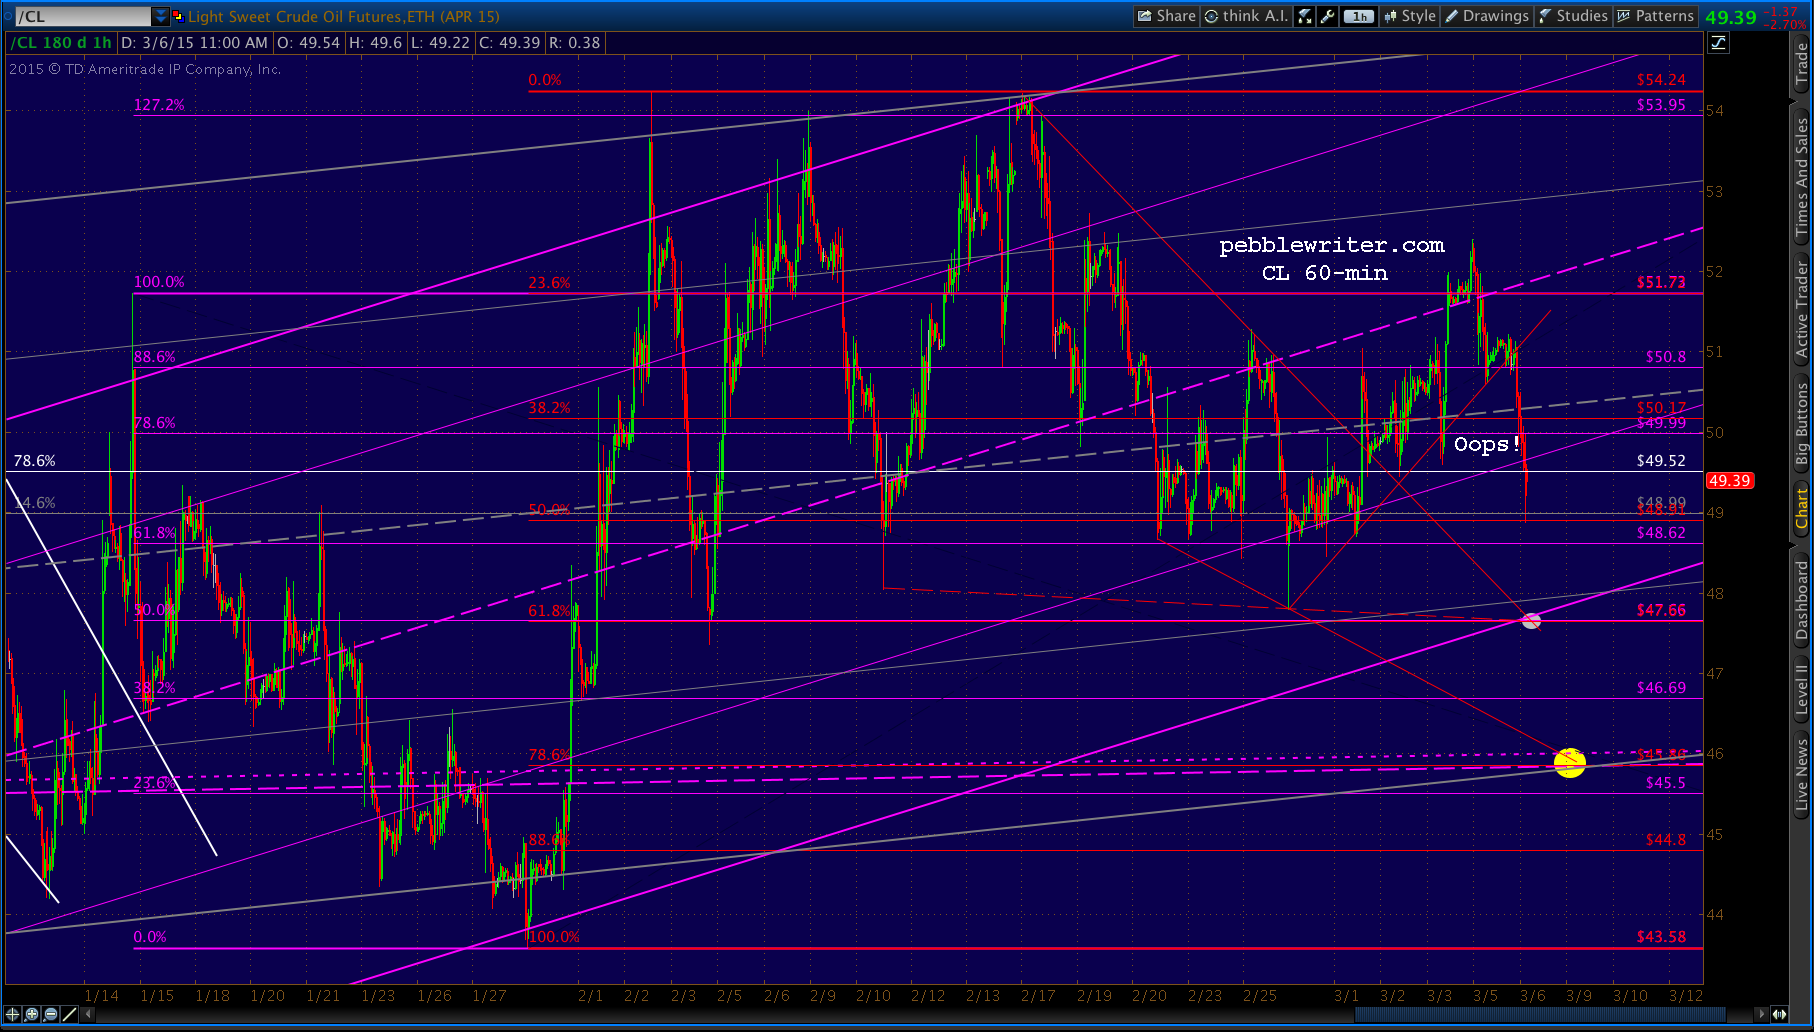
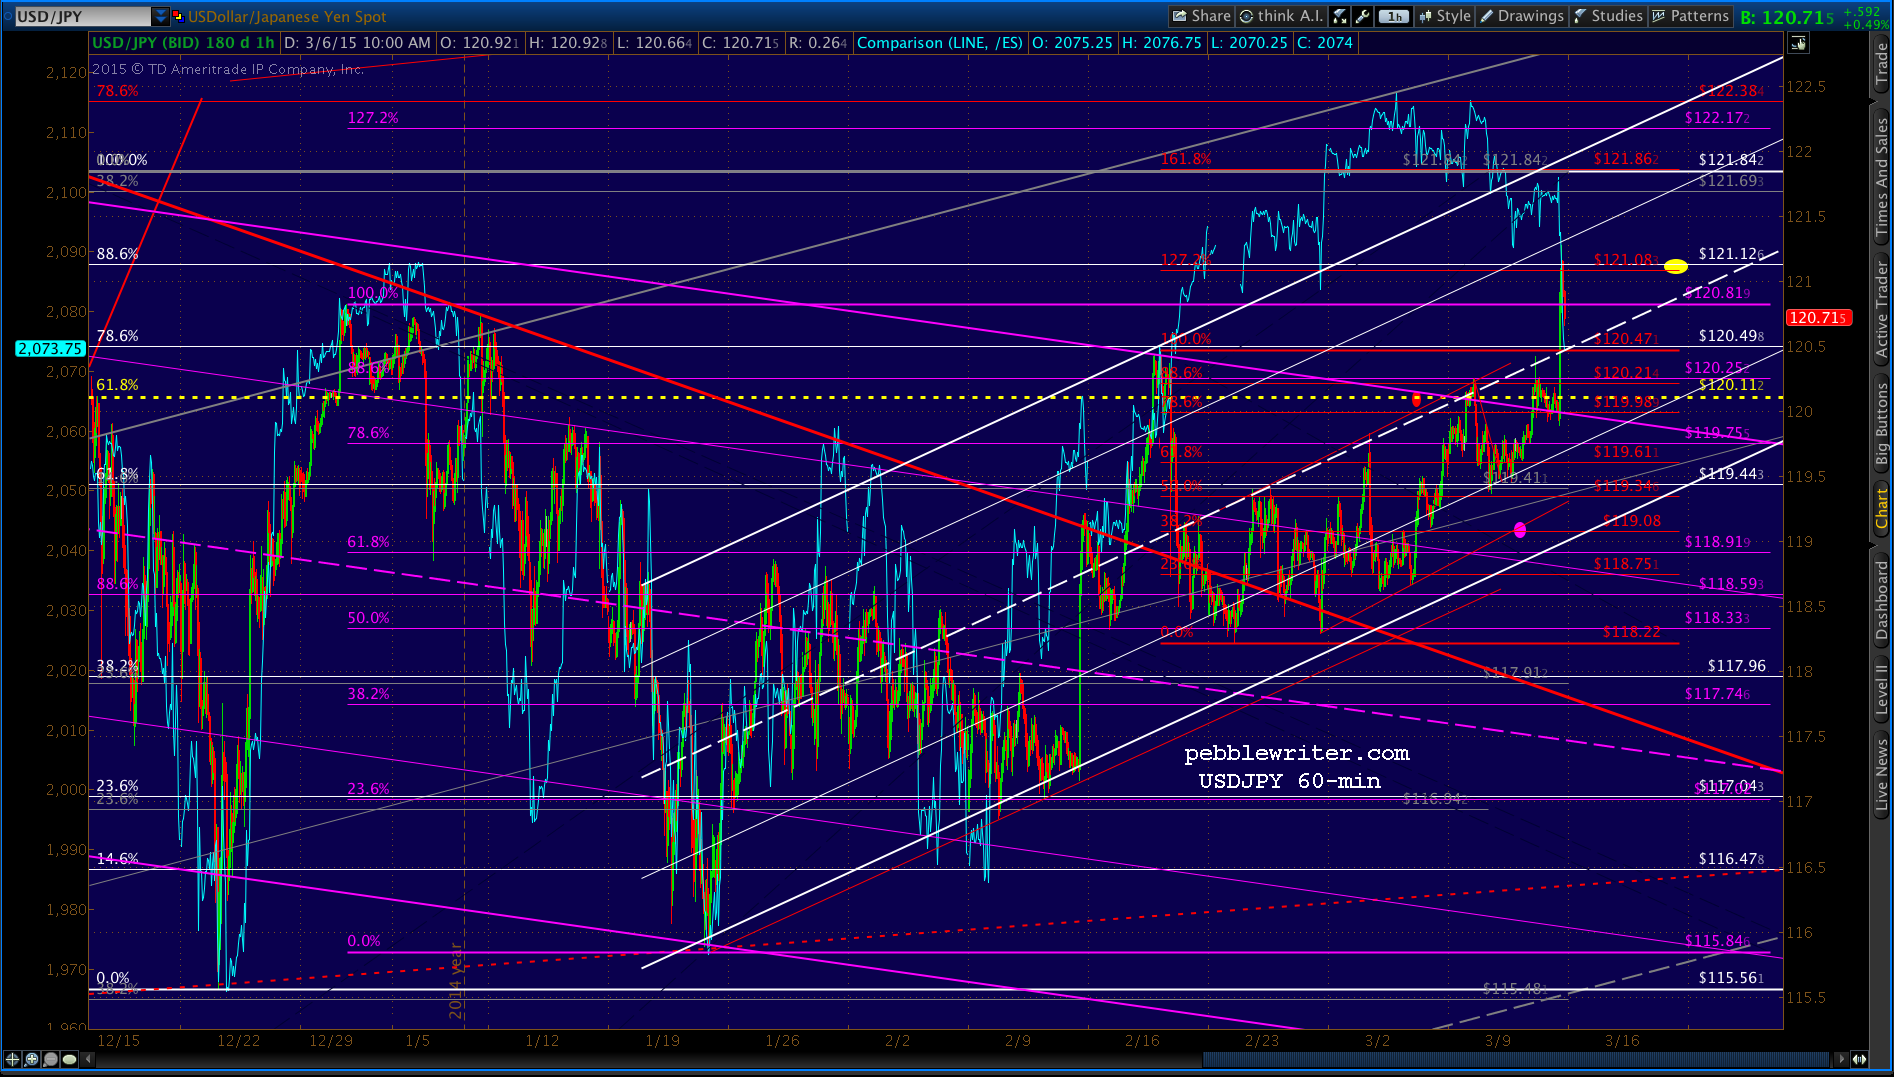
    2015-03-06 USDJPY 60 0615…with the pair approaching our upside target of 121.12 — the .886 retrace of the drop from the December highs.2015-03-06 USDJPY daily 0640But, CL is falling off the wagon once again — seemingly on its way to tag 47.66.

    2015-03-06 CL 60 0640Needless to say, the jobs picture is problematic for the FOMC.  Having balked at reducing market support when unemployment fell below 6.5% and then 6.0%, can they rationalize ZIRP at 5.5%?

    Whether or not we think they should, they no doubt will.  Simply put, the US cannot afford higher rates.  With $18 trillion in debt, a mere 1% increase in rates translates to an extra $180 billion in annual interest payments.  That would increase interest payments as a share of annual government expenditures from the current 6% to 11%.

    If rates increased to a normalized 6%, annual interest payments would soar to nearly $1 trillion — about 26% of the nation’s budget.  It would exceed every category of spending, including military, social security and health care.

    Screen Shot 2015-03-06 at 7.42.43 AMThat’s if we were miraculously able to hold the line at only $18 trillion in debt.  And, it completely ignores the impact of off-balance sheet financing which most estimates put at another $50 trillion or so.

    UPDATE:  1:00 PM

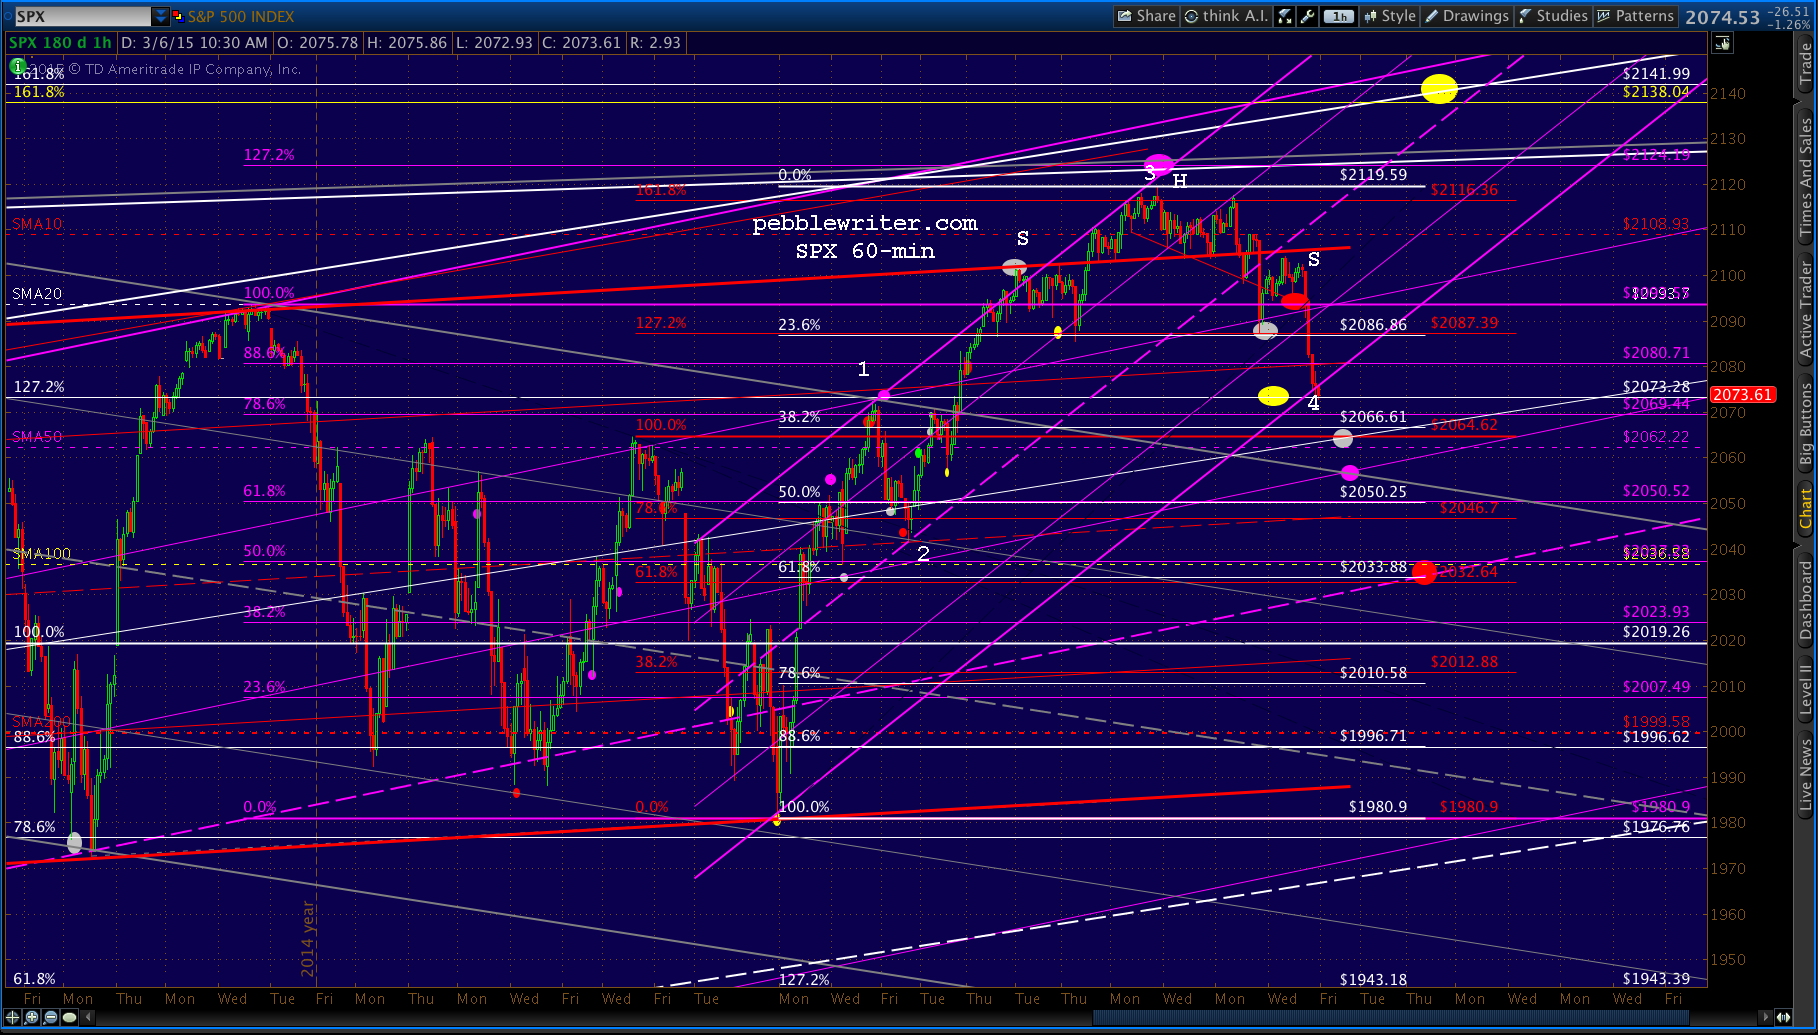
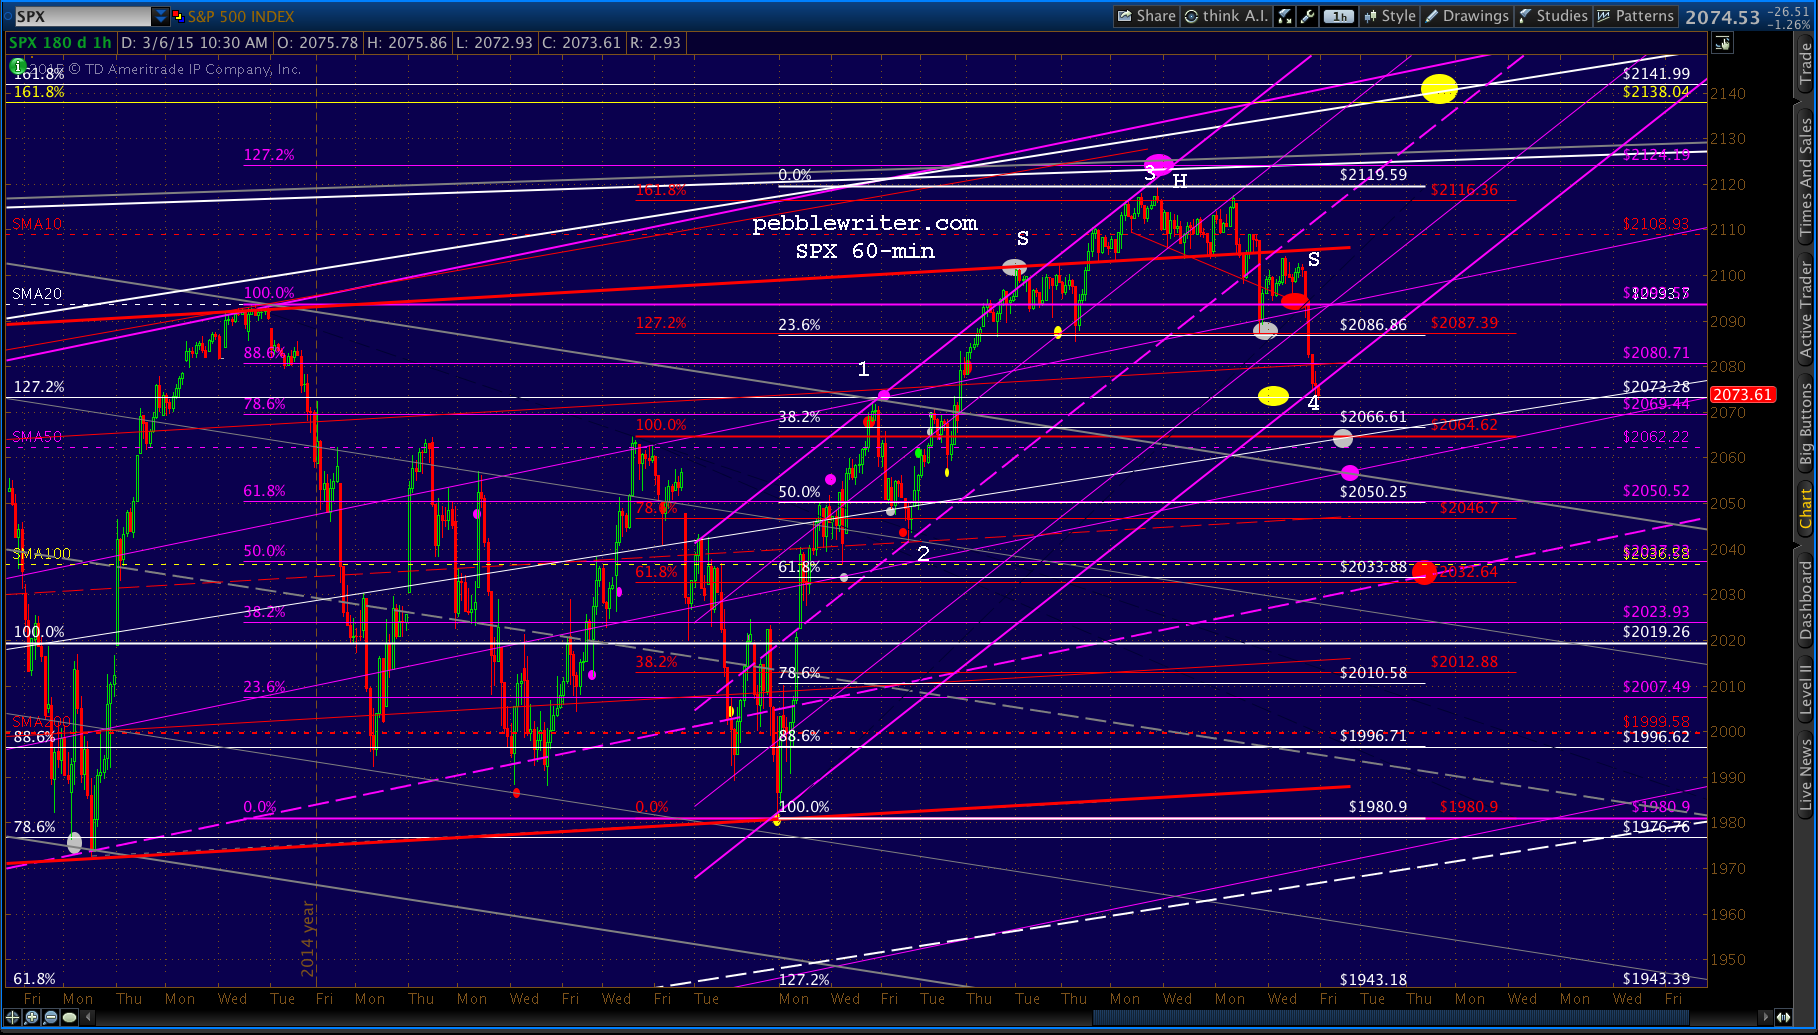
    Heck of a day for our charts.  This one that we posted on Wednesday2015-03-04-SPX 60 0652…turned out to be fairly predictive!

    2015-03-06 SPX 60 1004New targets coming up.

    continued for members

    I’ve adjusted the purple channel to include the low just reached of 2072.93.  Note that it is just slightly higher than the (presumed) wave 1 high of 2072.40, which would keep everything looking bullish for the wavers out there.

    This being Friday (and the “markets” being totally manipulated) that doesn’t mean we’ll stay north of 2072.40 prior to any bounce.  In fact, my leading case is a slight wave 1/wave 4 violation before a bounce up to backtest the SMA20 — currently at 2094ish.

    2015-03-06 SPX 60 1040It could be by just a few pennies — enough to stop out weak longs before a nice bounce.  But, ultimately, I think we’ll see backtest of the falling gray channel as we suggested Wednesday:

    If the H&S should play out, it would target around 2060 — which is coincidentally (or not!) the SMA50 and might allow a backtest of the broken falling gray channel.

    The white dot (2062-2066) would suffice, but an actual tag would be down around the purple dot at 2057.   If that should fail, then the red dot at the white .618/SMA100 intersection (2033ish) makes a great deal of sense.

    Odds are it would entail two separate waves that could even stretch into Monday, but CL still has a ways to go to our 47.66 target (which better sets up 45.86 BTW)……2015-03-06 USDJPY 60 1108

    …and USDJPY has to get back down below 120.11 before turning into a pumpkin.

    2015-03-06 USDJPY 60 1058So, we’ll look for a bounce up to 2093, followed by a drop to 2057 before the dust settles.

    If, on the other hand, the bulls pull a rabbit out of their hats and turn this thing around (in the past, 50:50′ these days, more like 70/30) then the purple channel clearly could take us up to 2138 as early as next Monday or Tuesday.

    But, as we discussed last week, I expect TPTB will attempt a strong move through that critical Fib level in order to keep the party going.  And, I’m not sure that this is the right time/place.