

We finally saw the first big selloff of the tumble in oil and gas prices we forecast months ago [see: Jan 13 Update.] Though the technical damage isn’t that great yet, it’s only getting started. I’ll focus today on how the decline in oil/gas should play out over the next several months and how other sectors of the market should react.
 I think the writing is now officially on the wall: the Fed must tread very carefully, especially over the next 4-6 weeks.
  The good news is that there should be some excellent swing trading opportunities and there is still plenty of time to position for them.
continued for members…
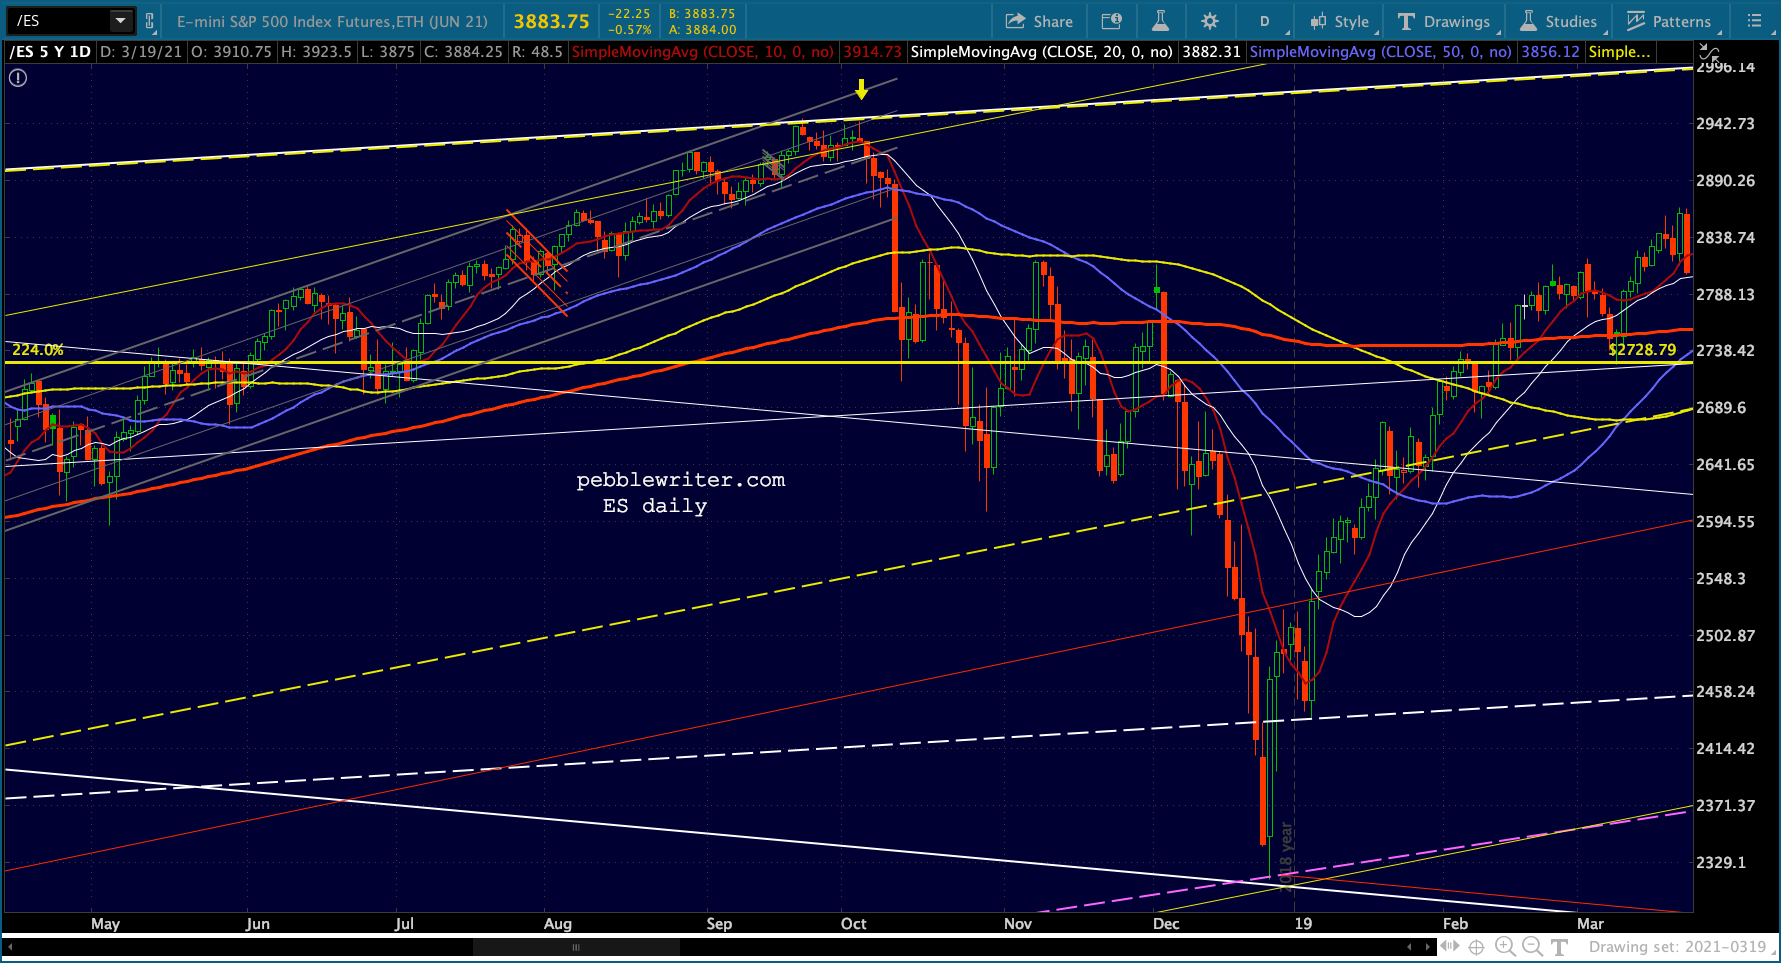
ES’ little white channel has broken down and backtested – suggesting that we should see a backtest of the broken falling white channel next. If that breaks down, we should see a test of the neckline of the H&S Pattern currently around 3752-3758.
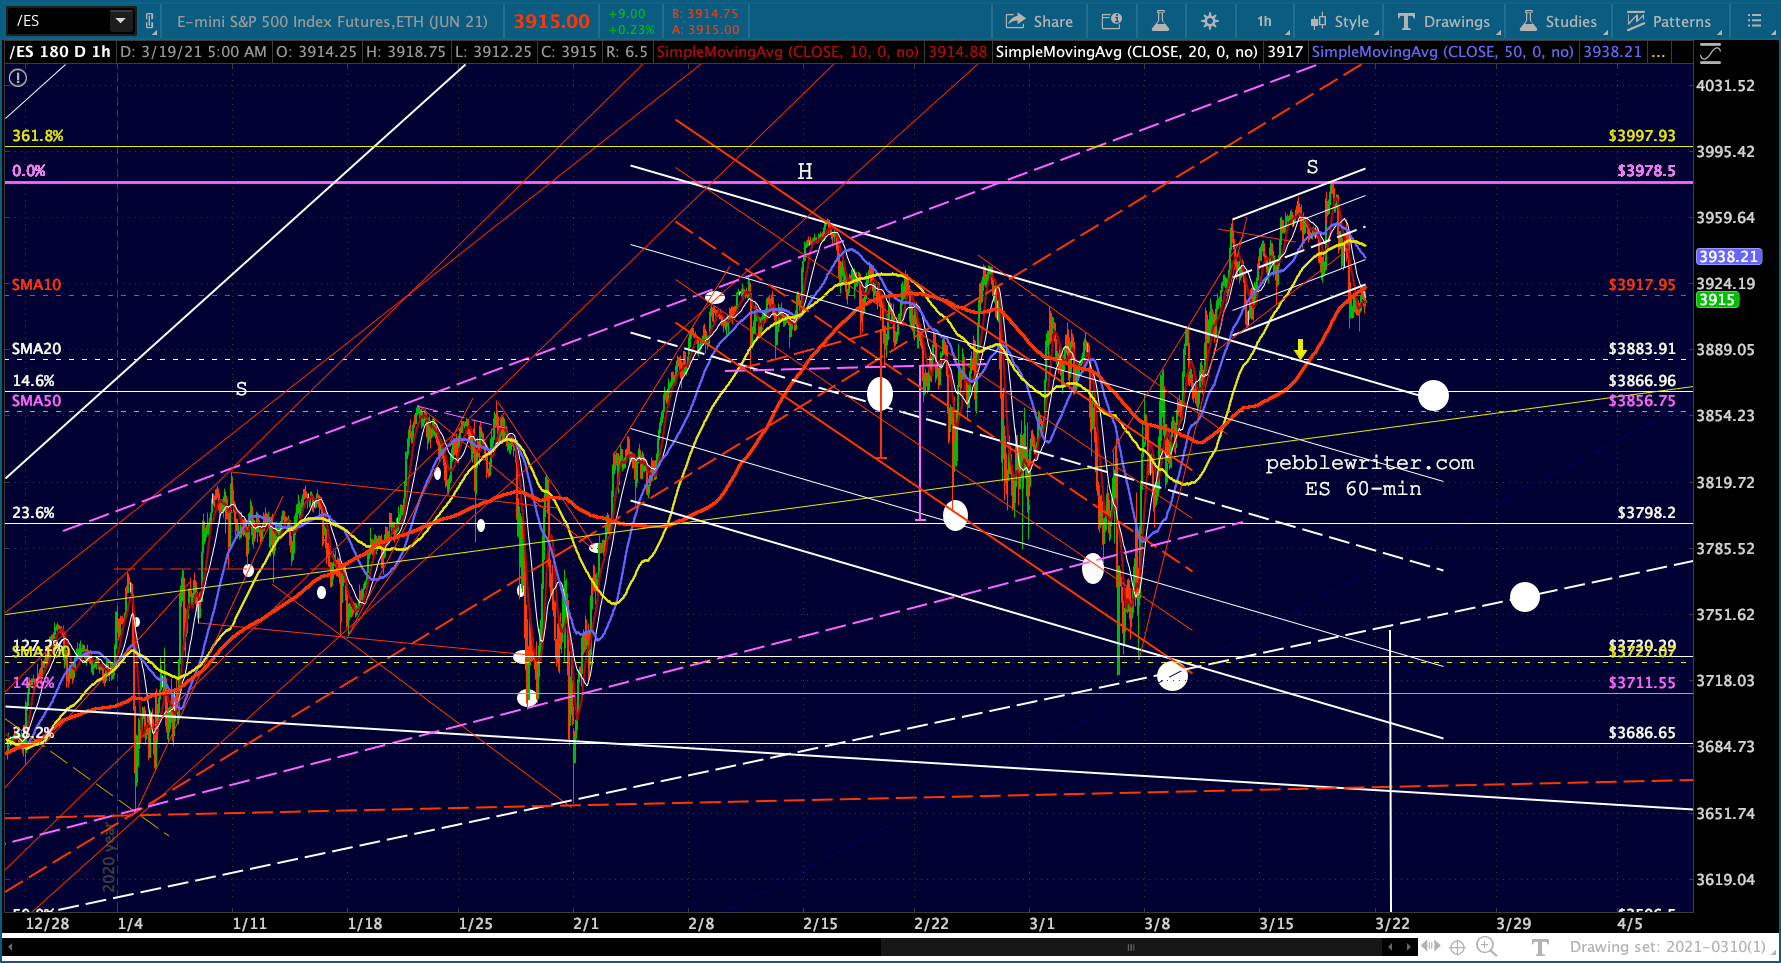 Though, if that tag were delayed until mid-April, it would target the .618 Fib at 3506 – a better downside objective.
 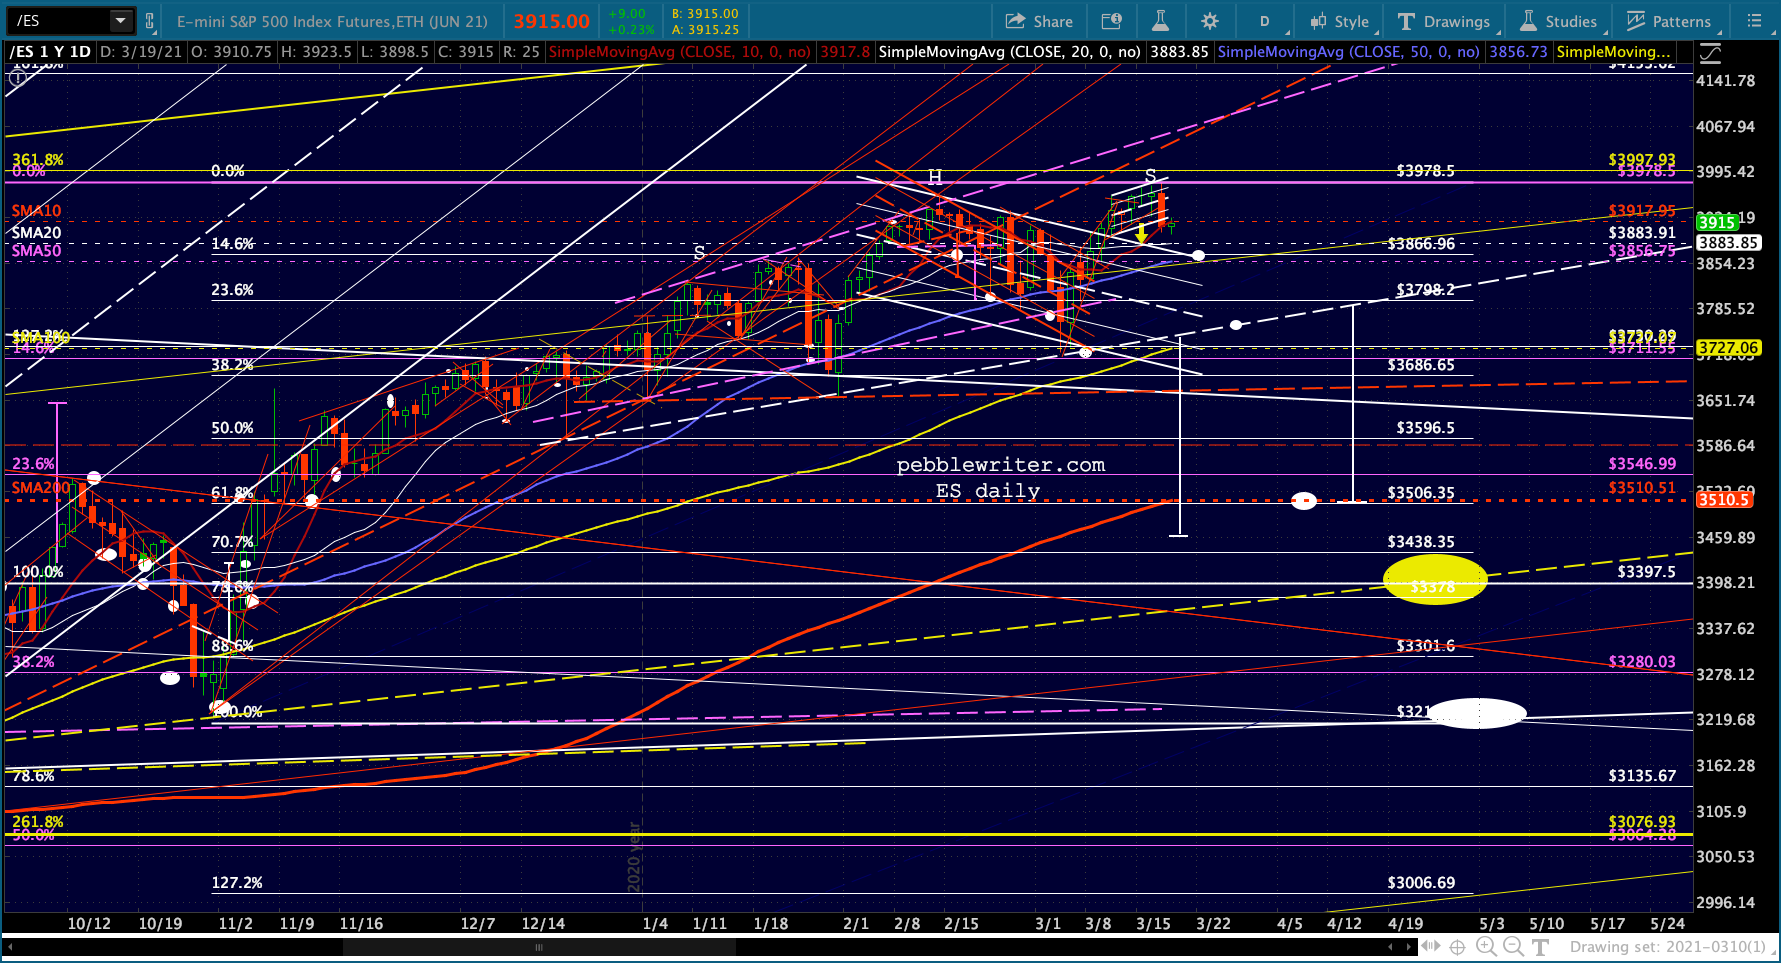 I am torn, though, between the idea of a SMA200 backtest, a backtest of the Feb 2020 highs at 3397.50, or the 2.618 at 2076.93.
  SPX has a similar setup – with the ideal completion of the H&S coming around 3/25.
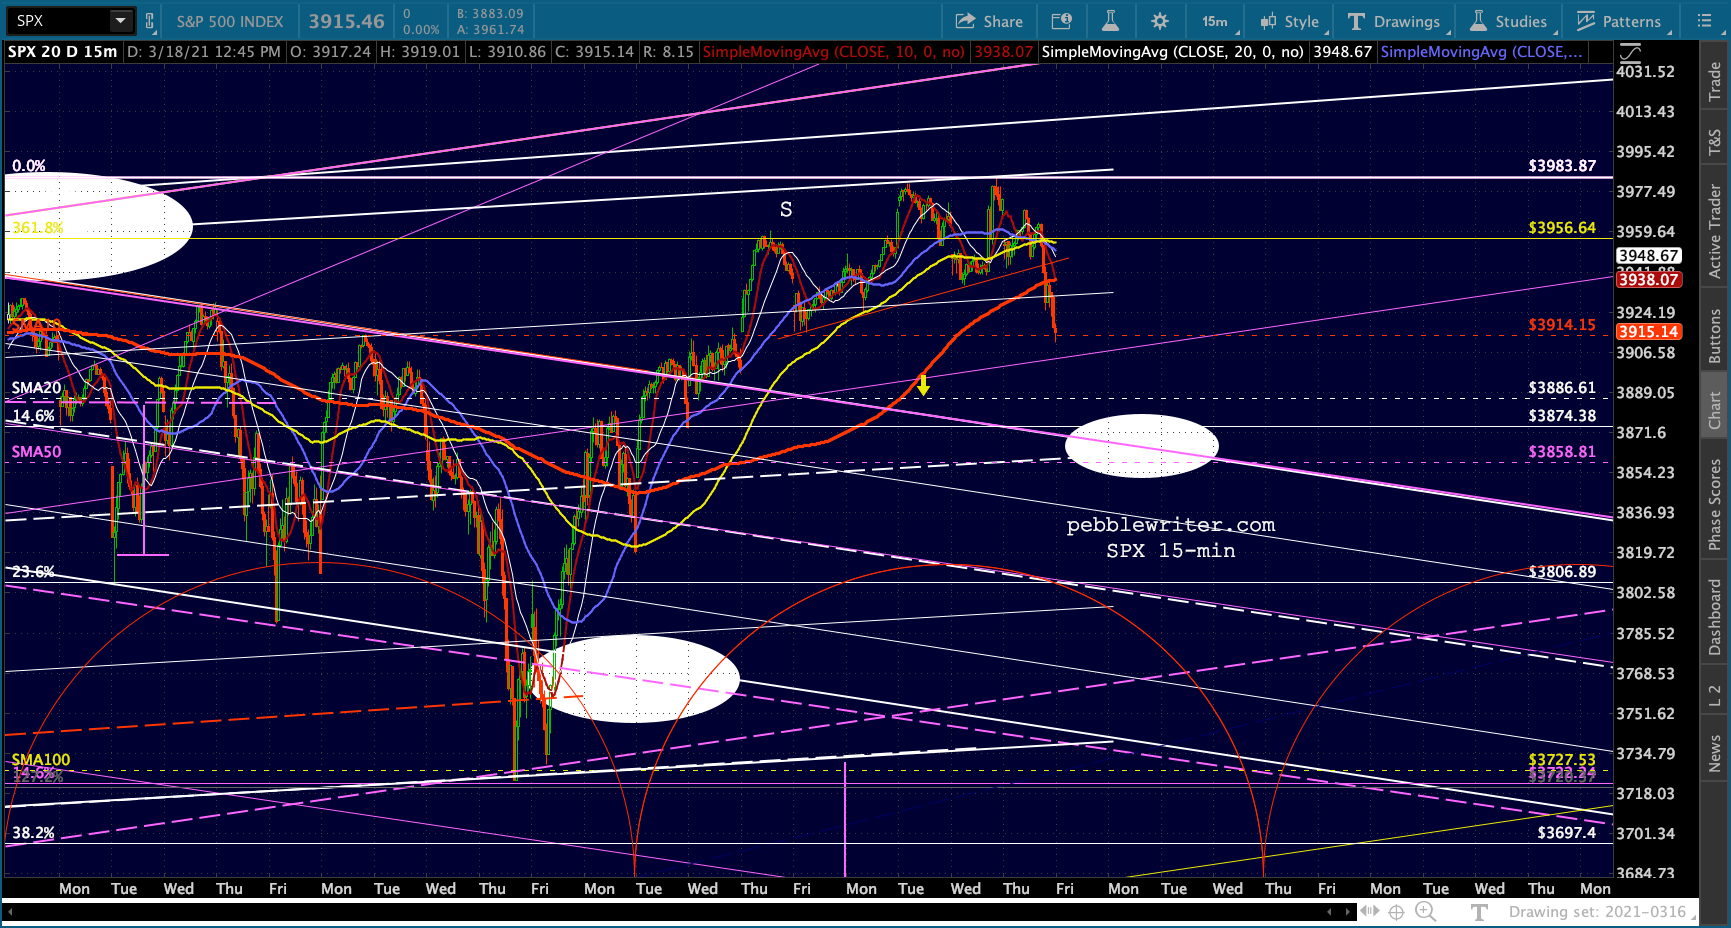
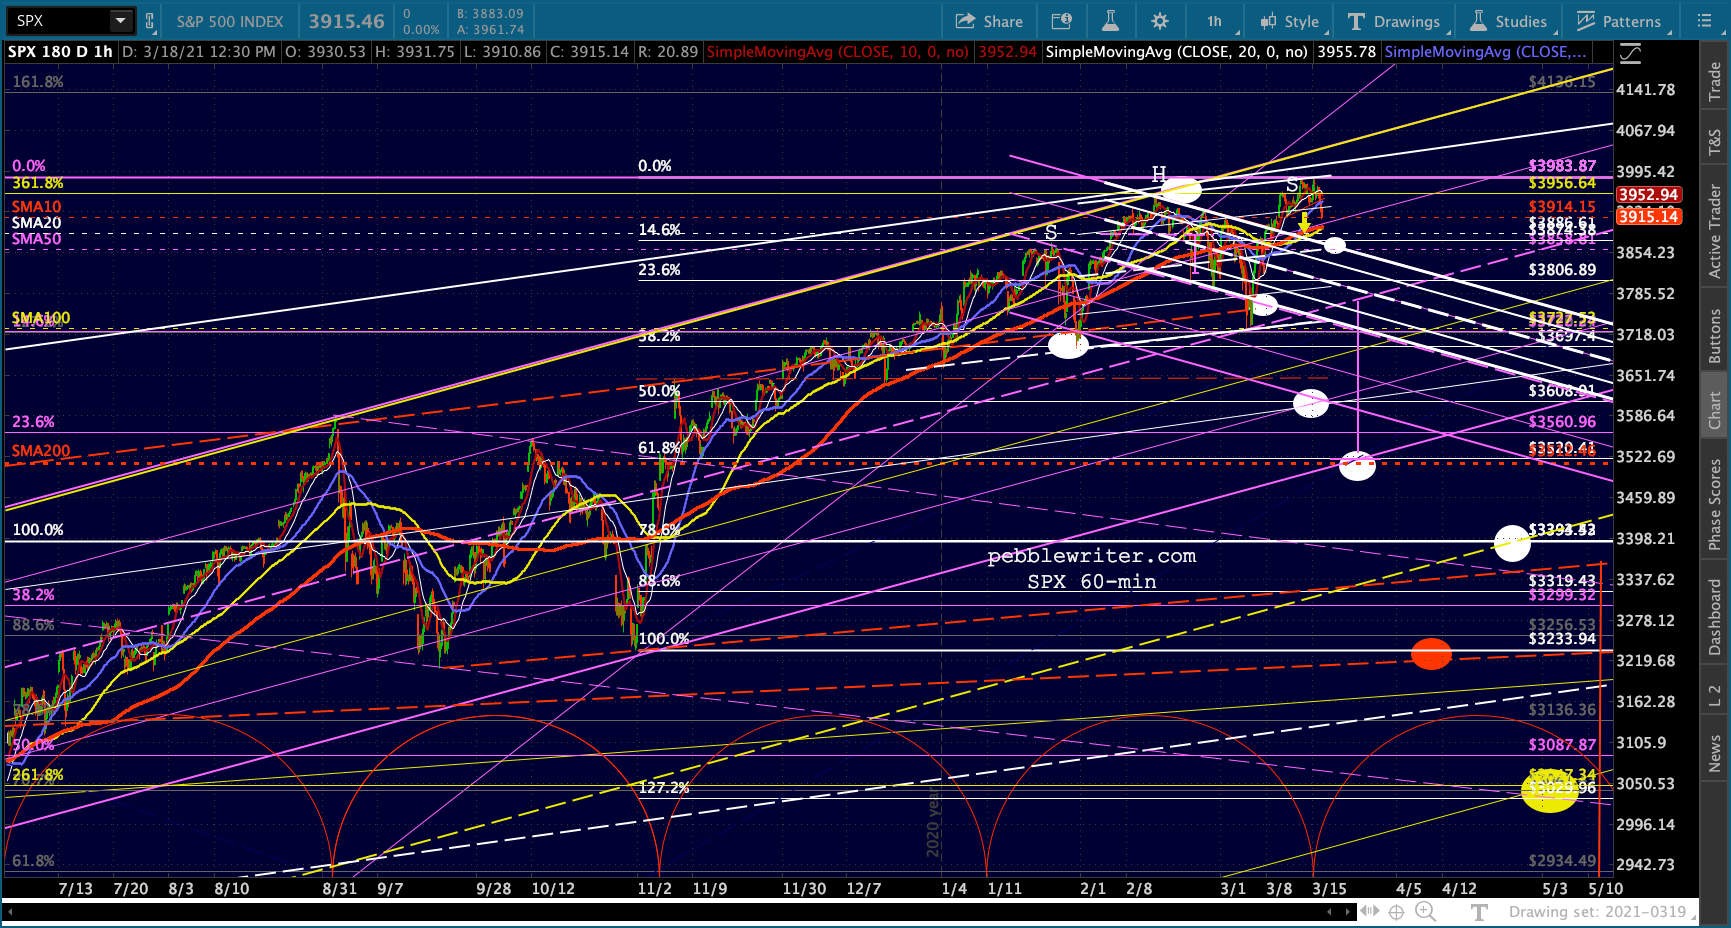

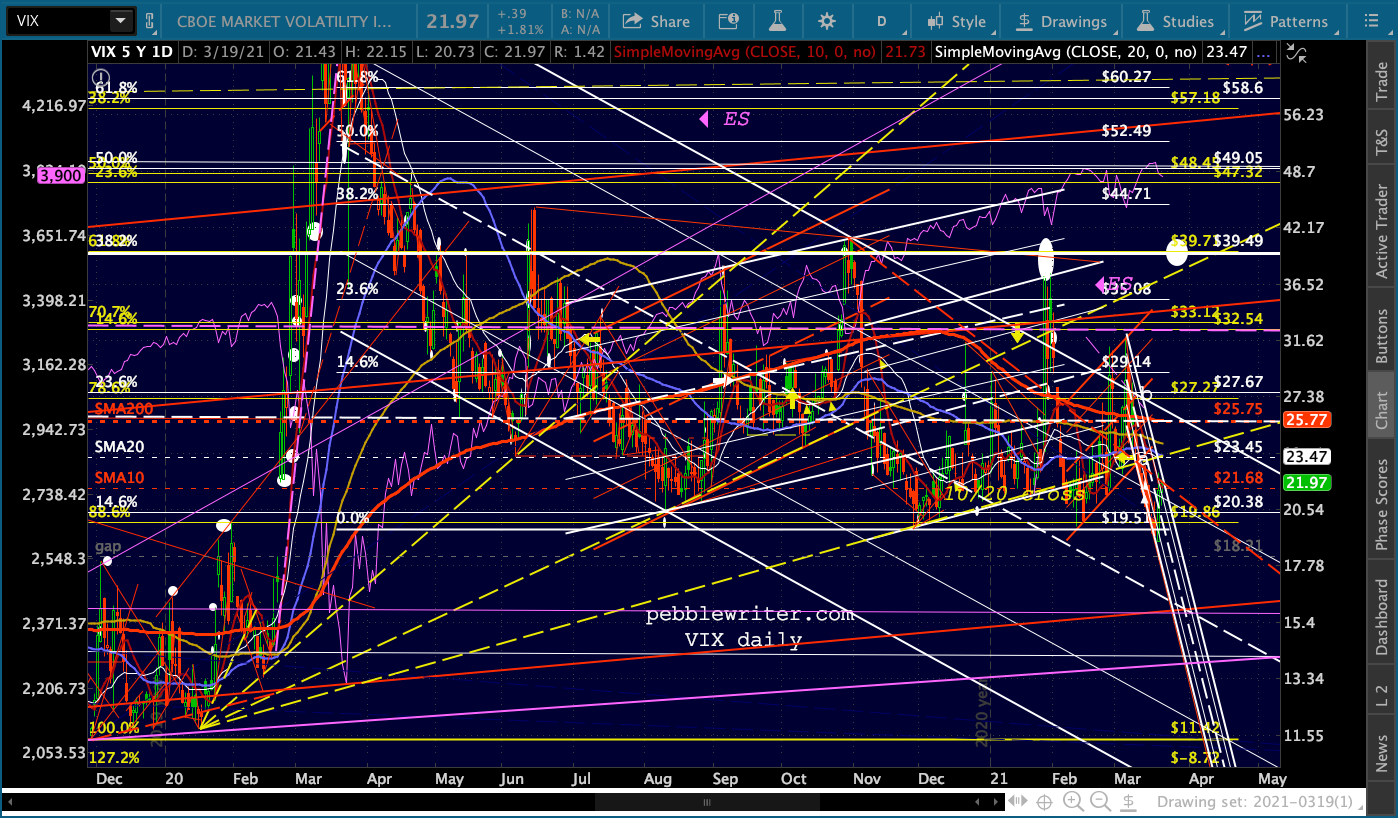
 The key to getting the party started would be breakout for VIX – currently around 22.33.
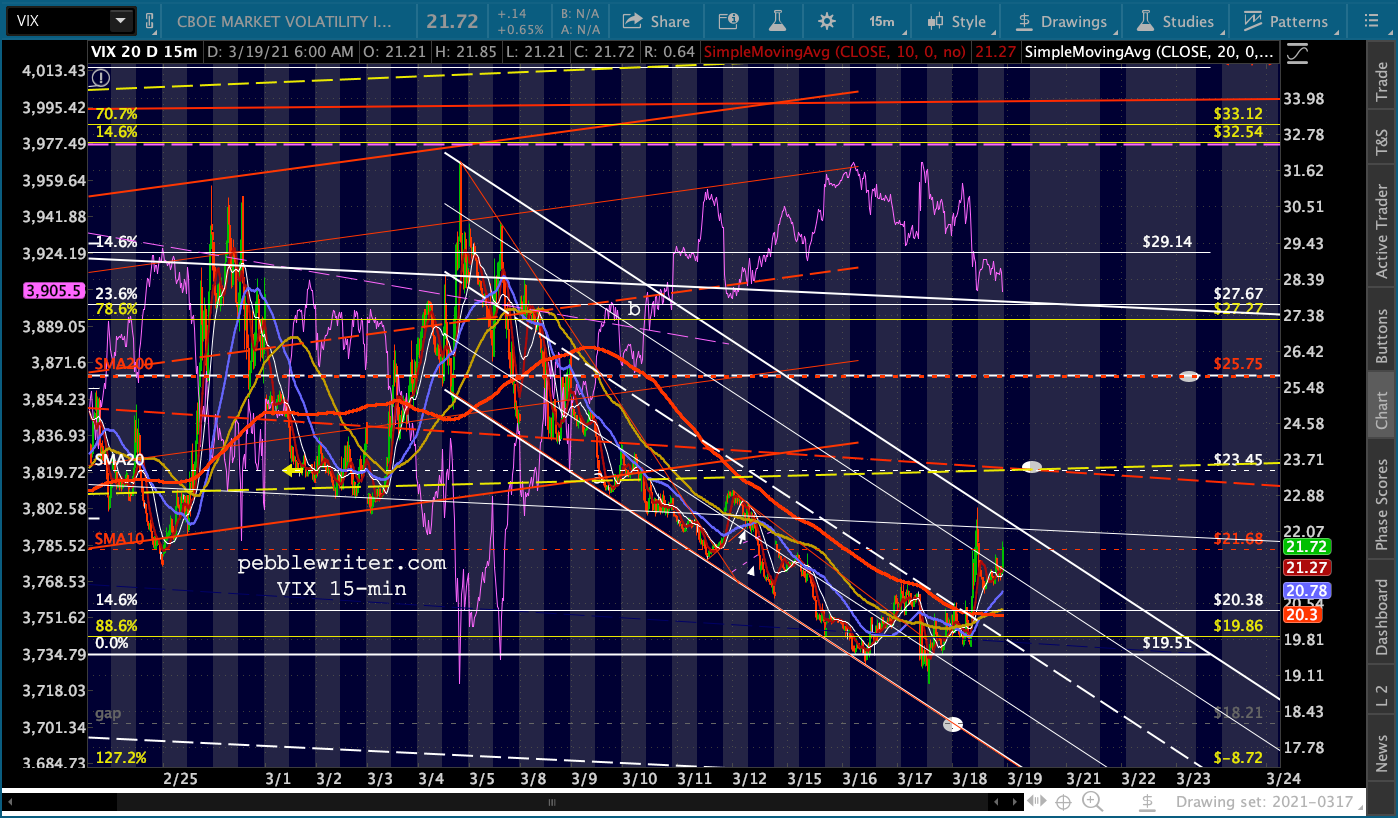 If the small white channel goes away, then we can start to look for a backtest of the broken yellow fan line and some key SMAs.
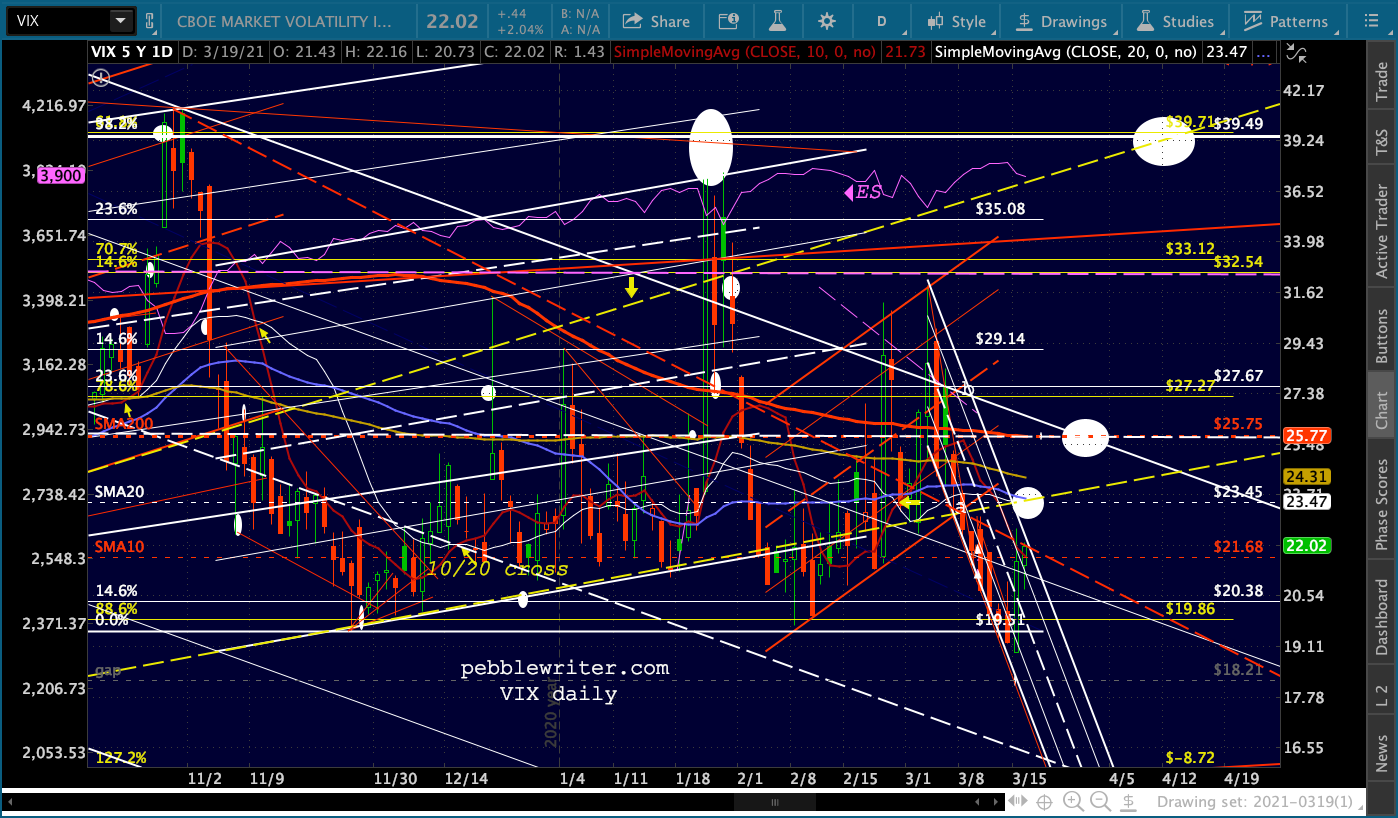
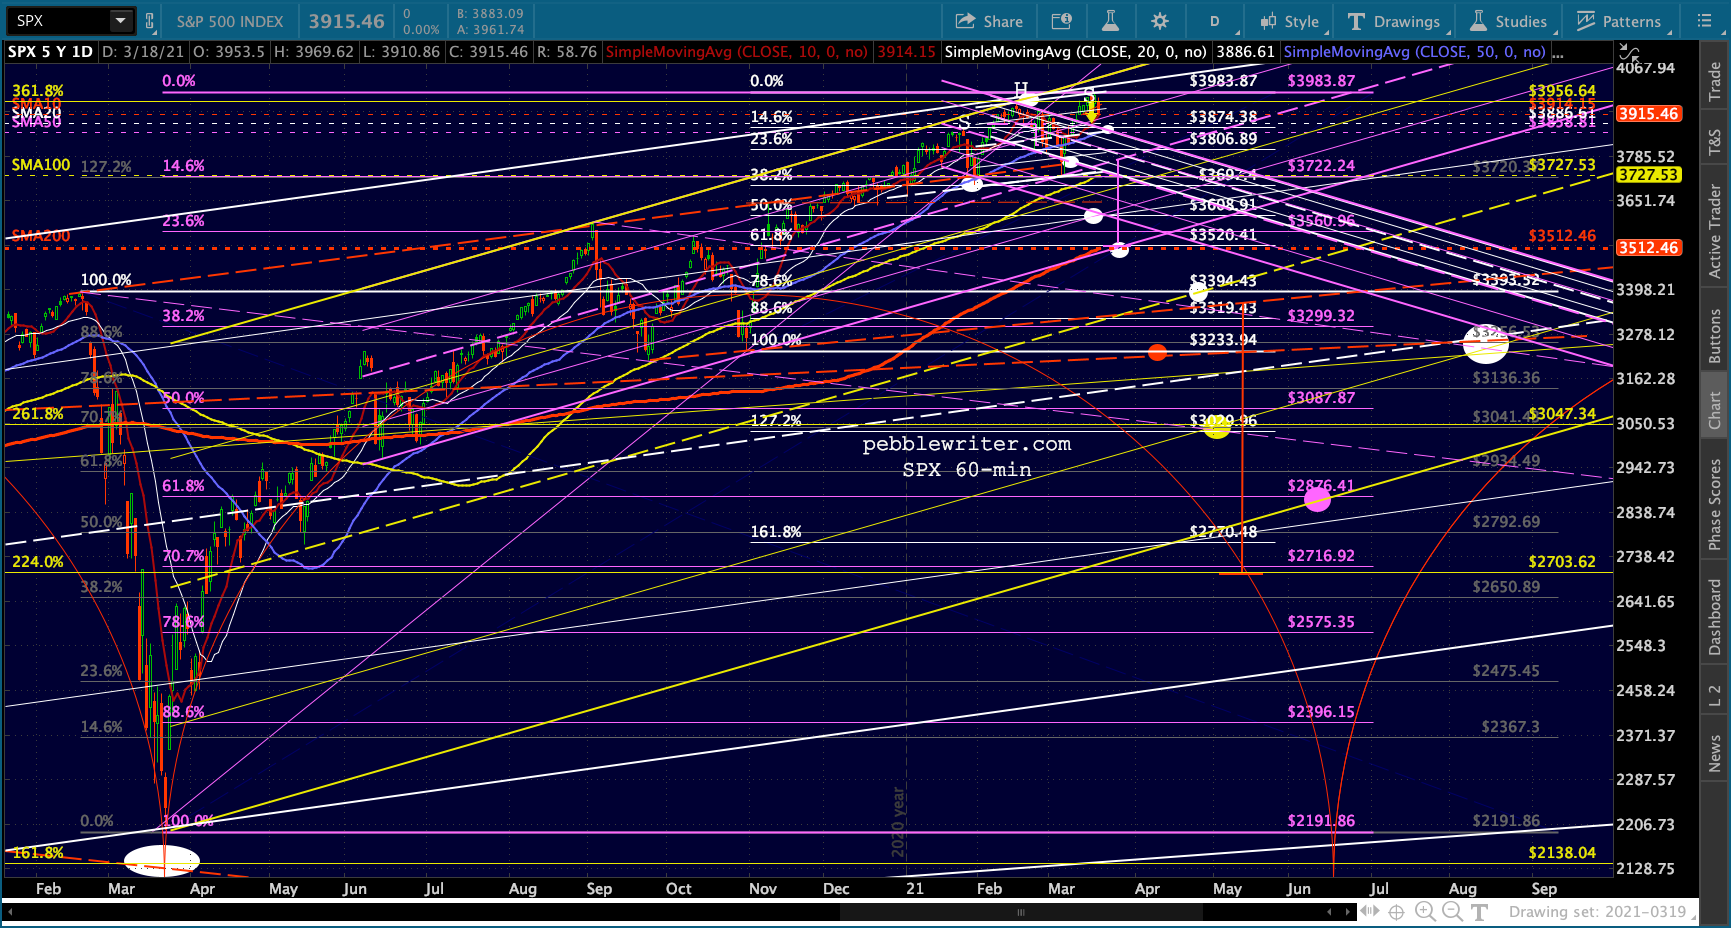
 10Y yields are now higher than they were prior to the pandemic declaration or SPX’s Feb 2020 highs. It’s entirely possible that yields level out here if, as I suspect, the Fed responds stridently enough (oil/gas continue to plunge sharply.)
If not, then the next serious resistance would come at 2% – but, let’s call it 2.066 – the purple .618 and .786 line of the falling yellow channel.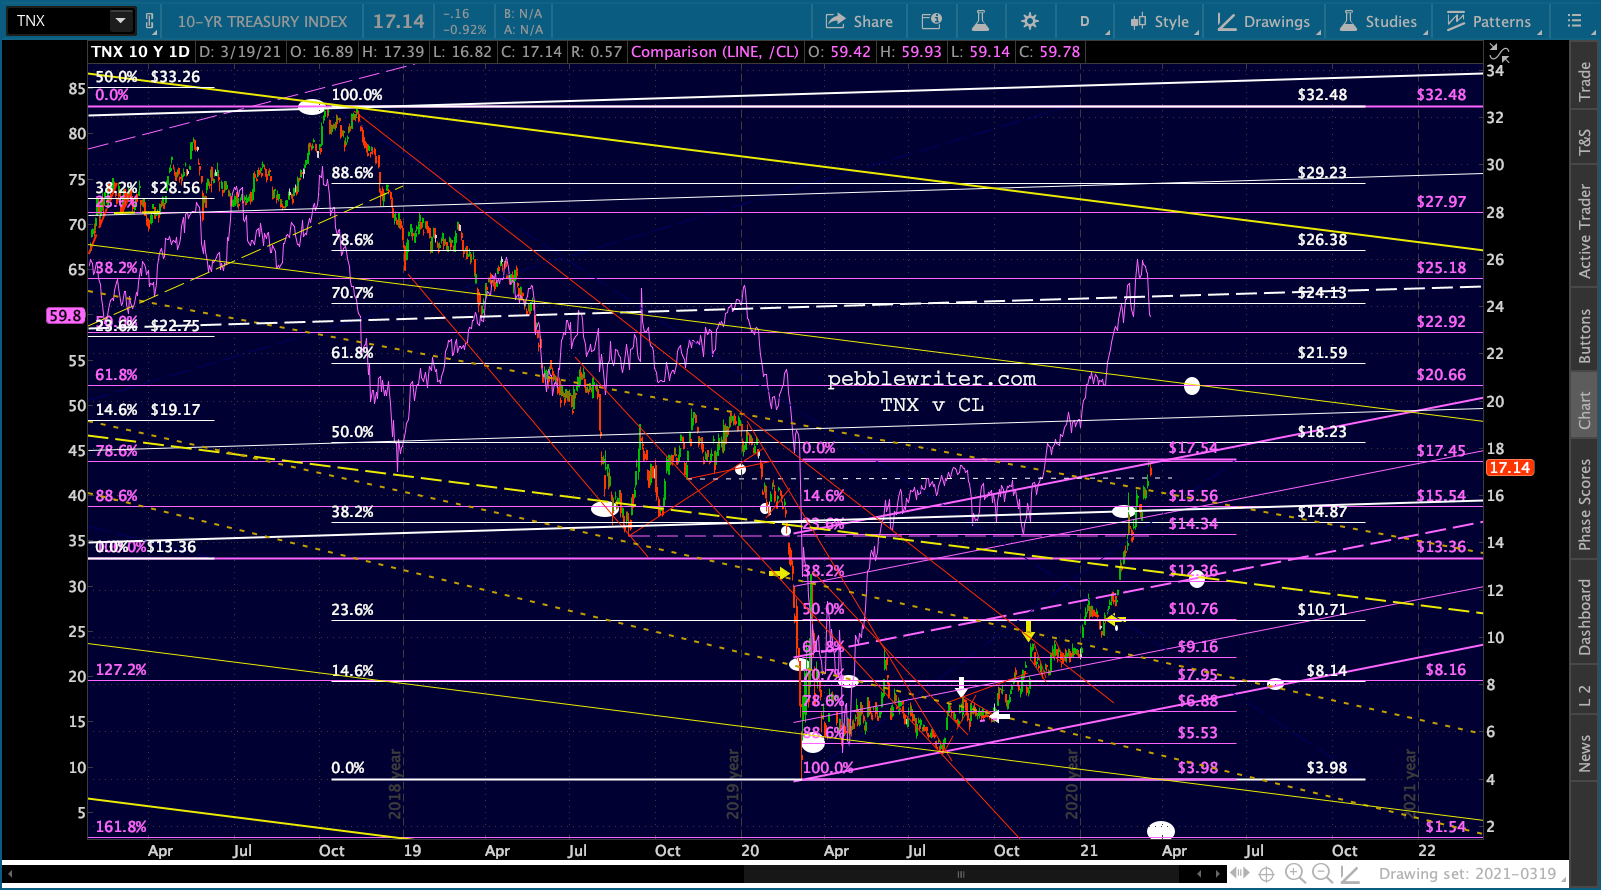 The price (ZN) chart suggests that rates will, in fact, continue to rise. The midline of the rising white channel has been breached.
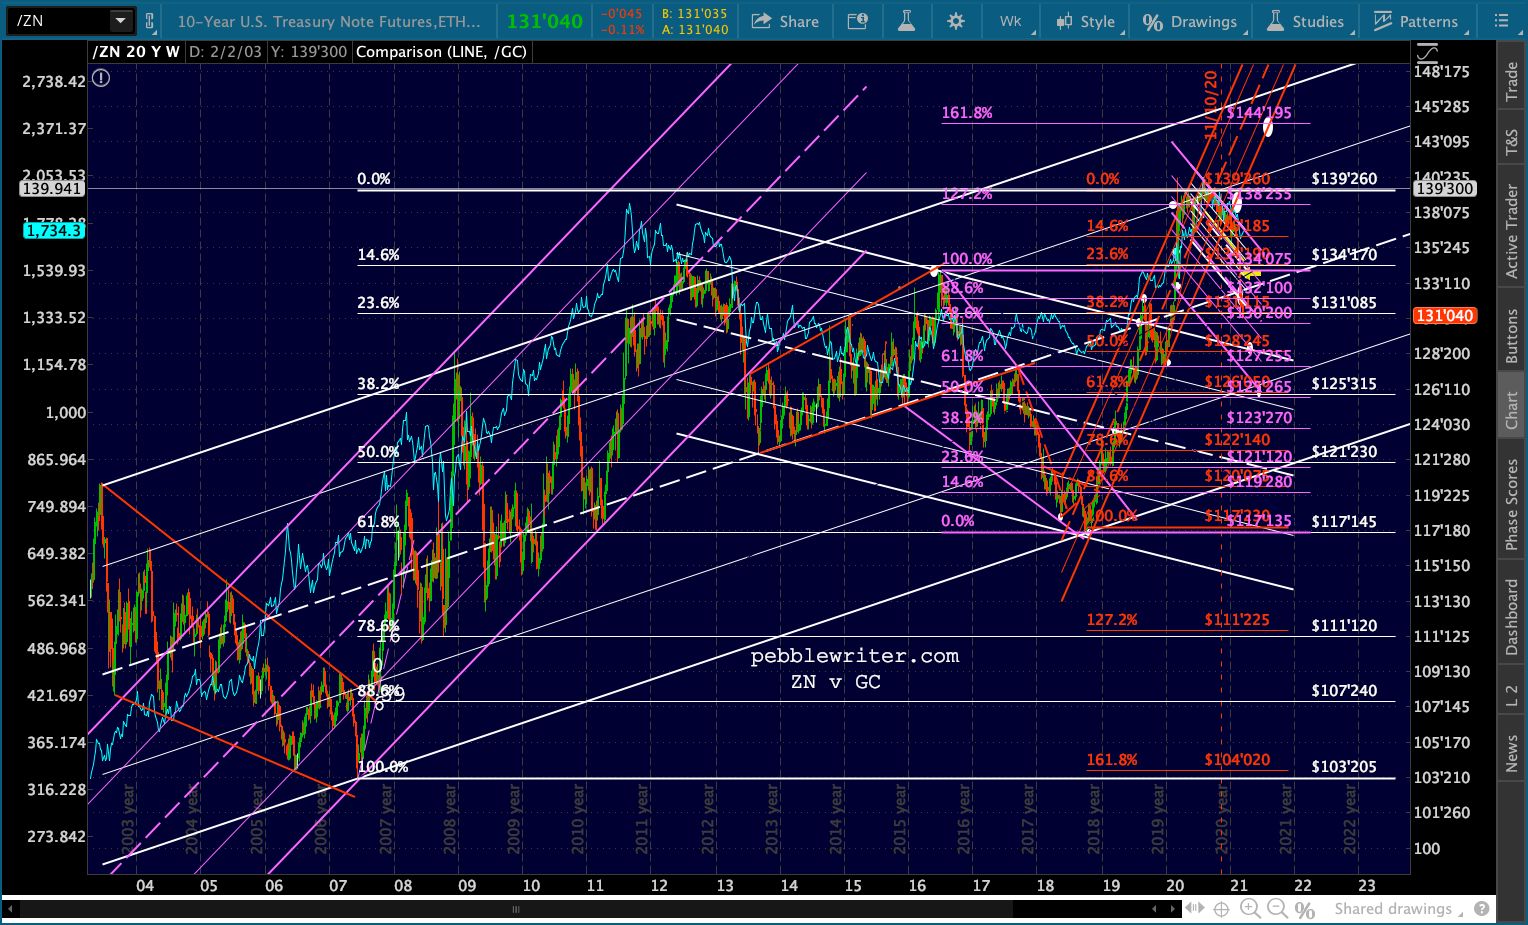
 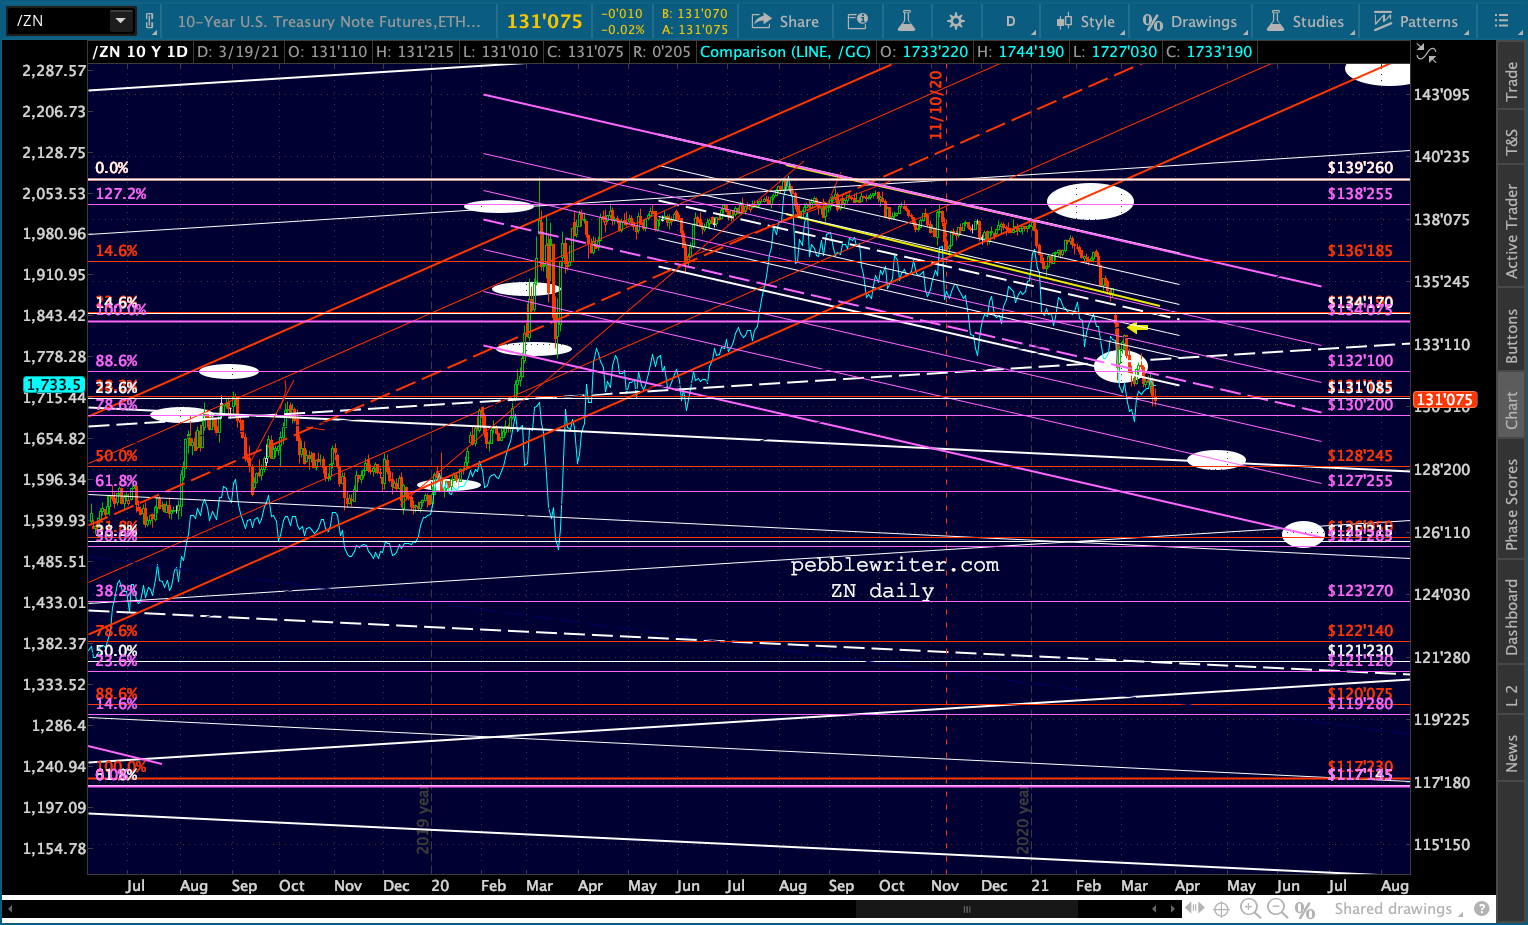 It can be better seen on the larger charts below. Furthermore, the falling white channel that ZN broke out of in Feb 2020 deserves a backtest at 128’245ish. Should that fail, then the rising white channel .236 line at 126’050 – which is also the .618 Fib retracement – is an excellent target.
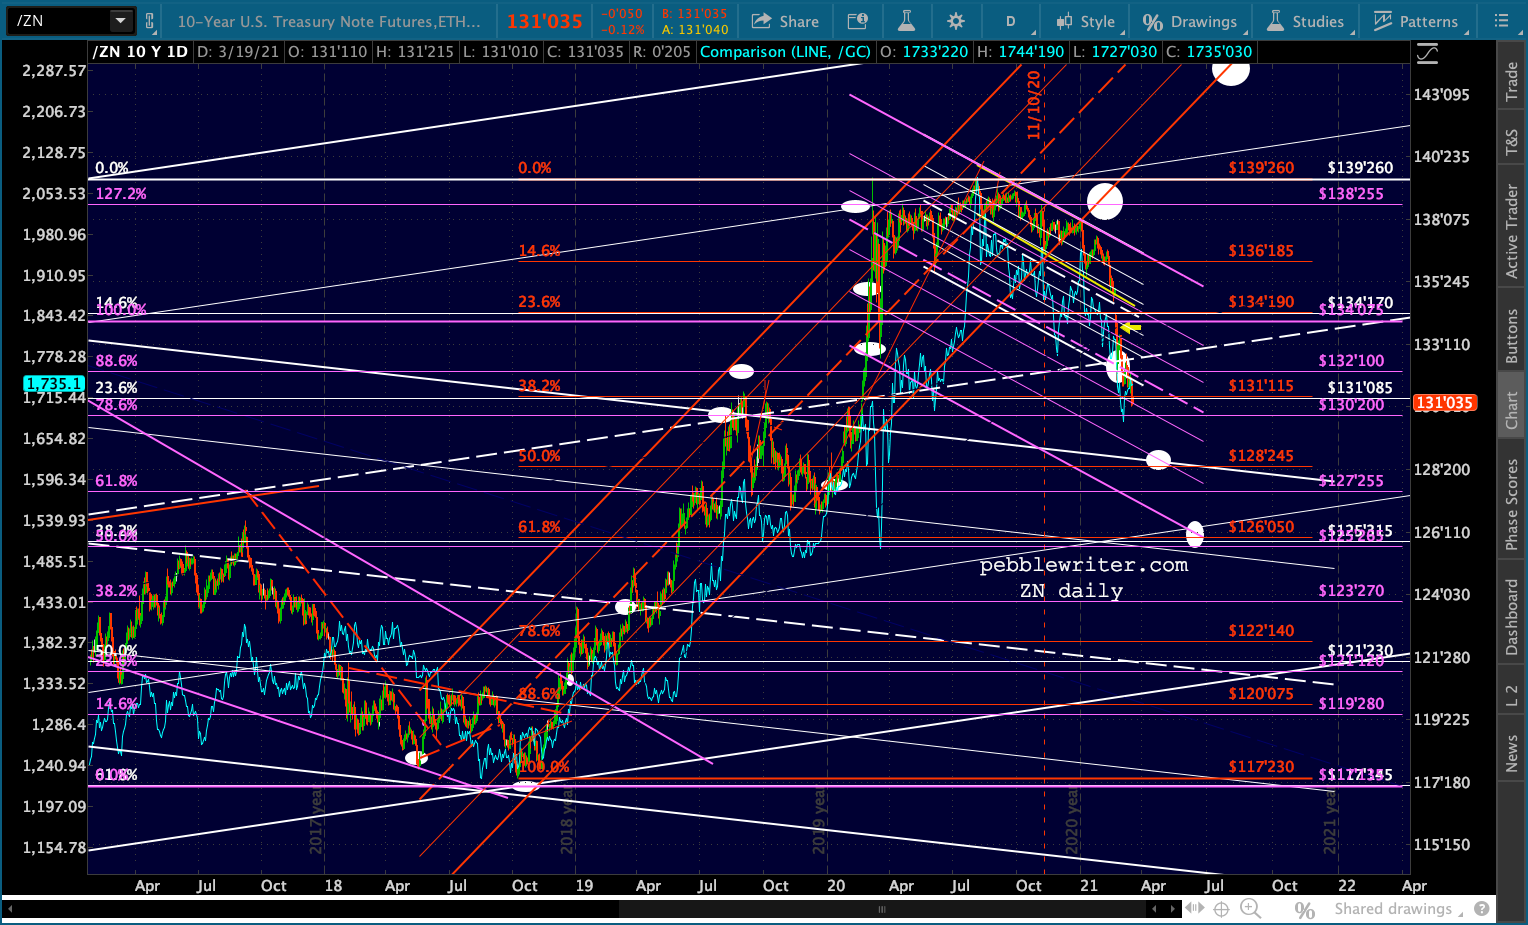
 I believe the Fed will attempt to draw the line at a 2% 10Y. So, the trick is to figure out where RB and CL need to be in order for inflation expectations and, thus, interest rates to top out there. Powell said he would like to see inflation top 2% so that, taking into account the extended period of time it failed to reach 2%, it would average 2% over some period of time.
I believe this is hogwash. I believe the Fed will react to falling stock prices and do whatever is necessary – much like it did in Oct 2018. We face the very similar situation to what was the case at that time.
TNX had reached 3.25% – the top of a huge falling channel from the 90s…
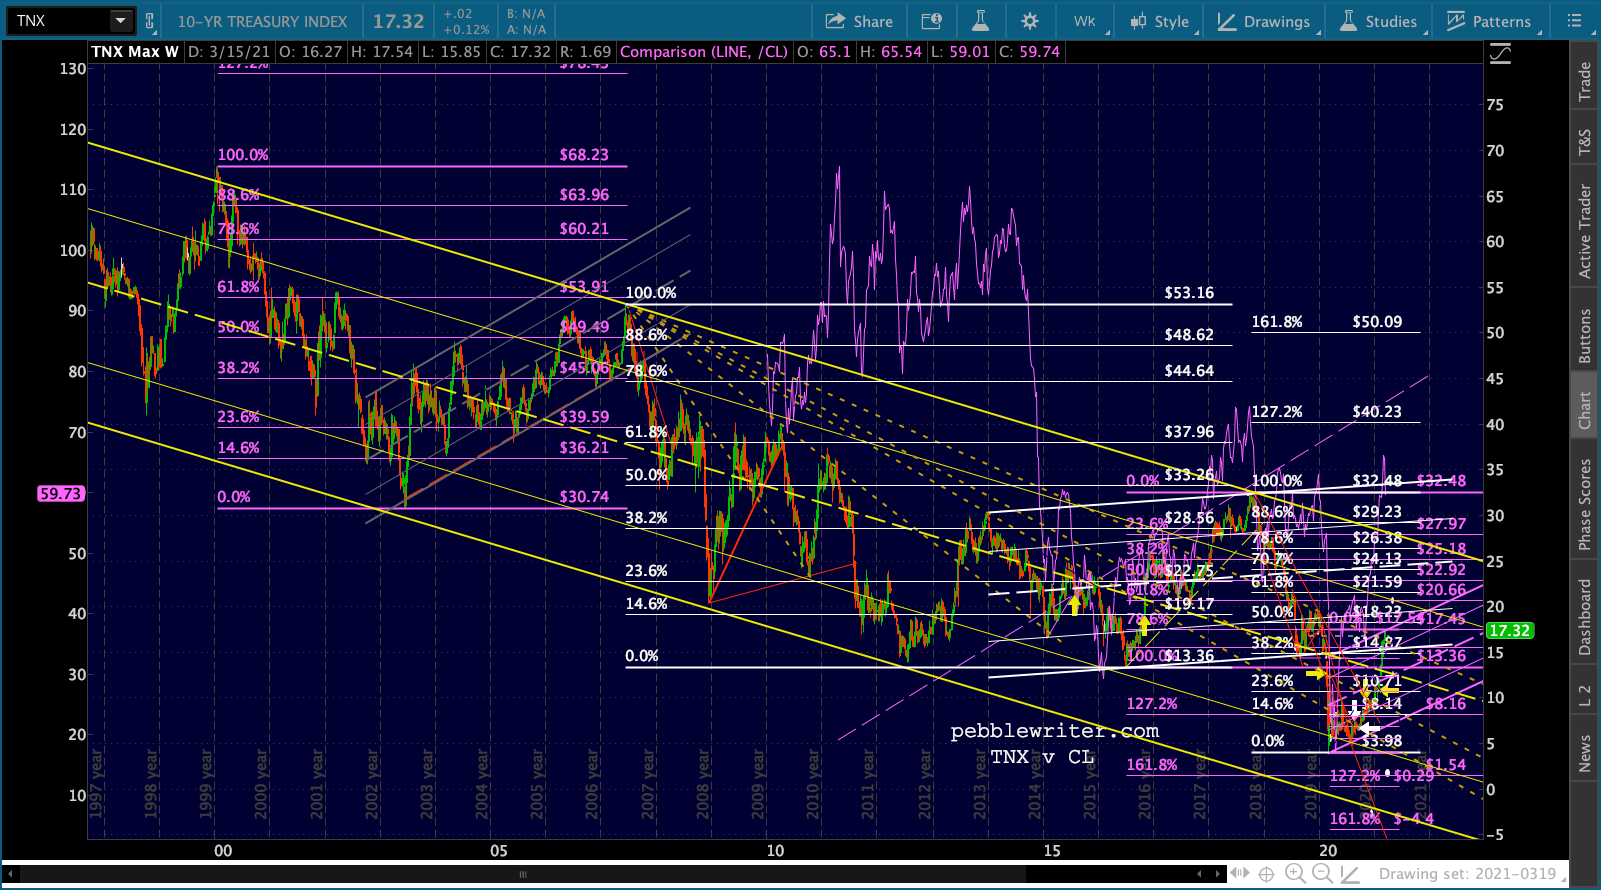 …and was in danger of breaking out due to sharply rising oil/gas prices which had driven CPI to nearly 3% (2.95% in July.)

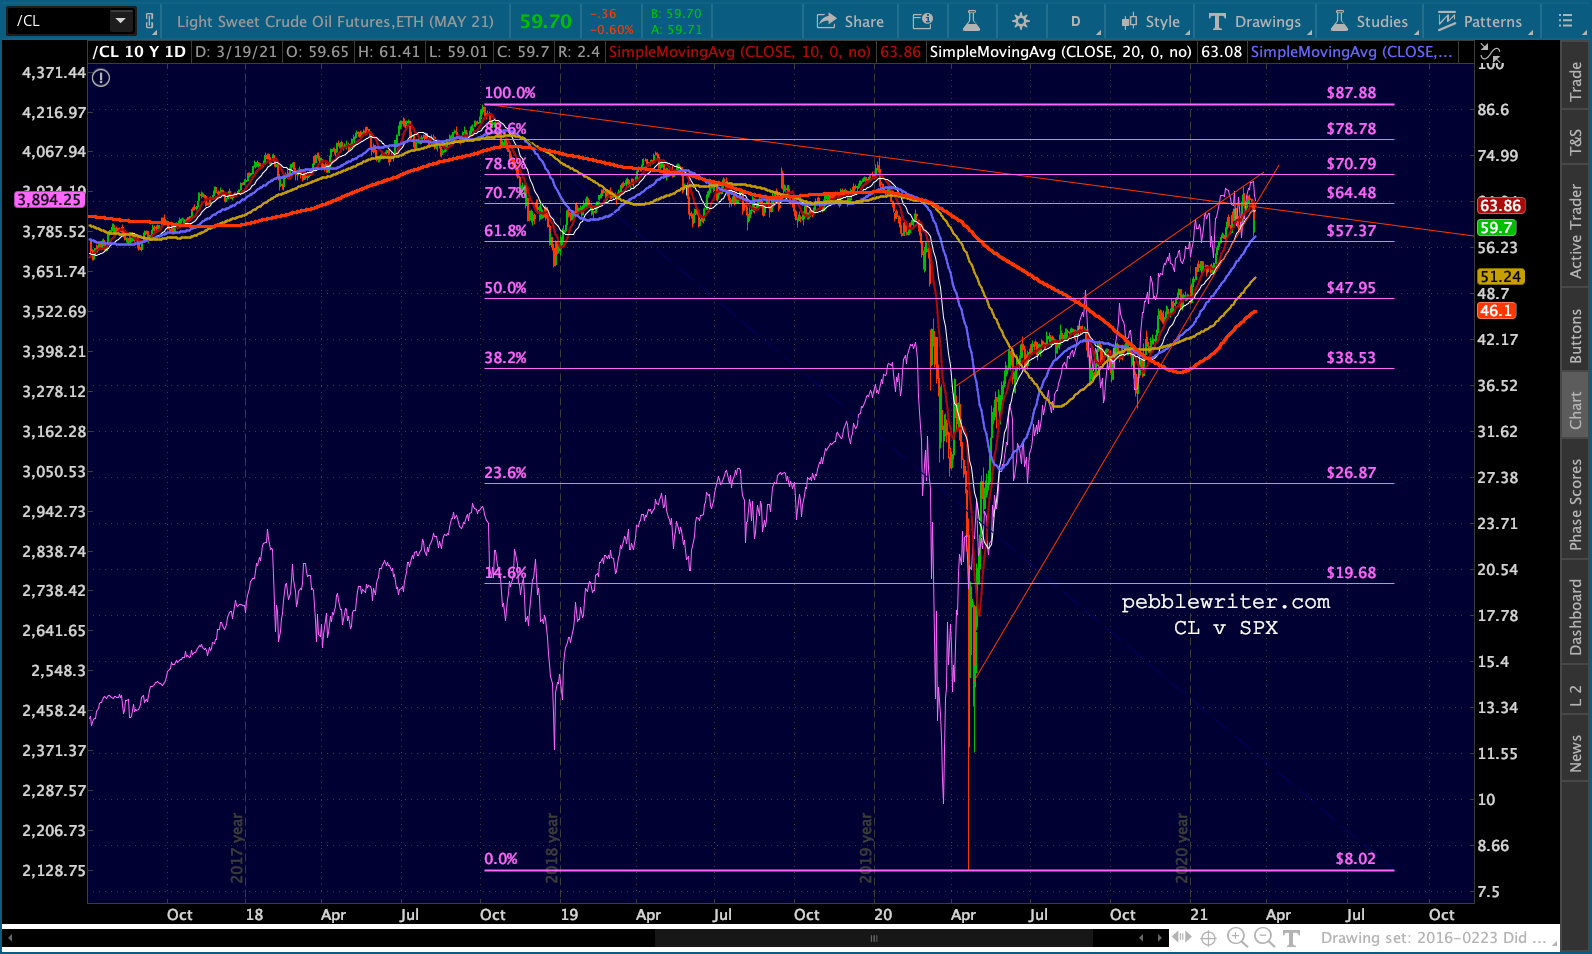
 CL had been pushing steadily higher even after reaching overhead resistance, eliciting a string of angry tweets from Trump that OPEC must lower oil prices right away. They ignored the tweets until Oct 3, when MBS suddenly needed a friend after he was discovered to have had Jamal Khashoggi killed and dismembered.
This marked THE TOP for CL, which dropped 40% by December 24.
 Not surprisingly, stocks followed suit. ES fell 21%, bottoming out on December 26.
 And, USDJPY dropped 8.7%, bottoming out on Jan 3, 2019.
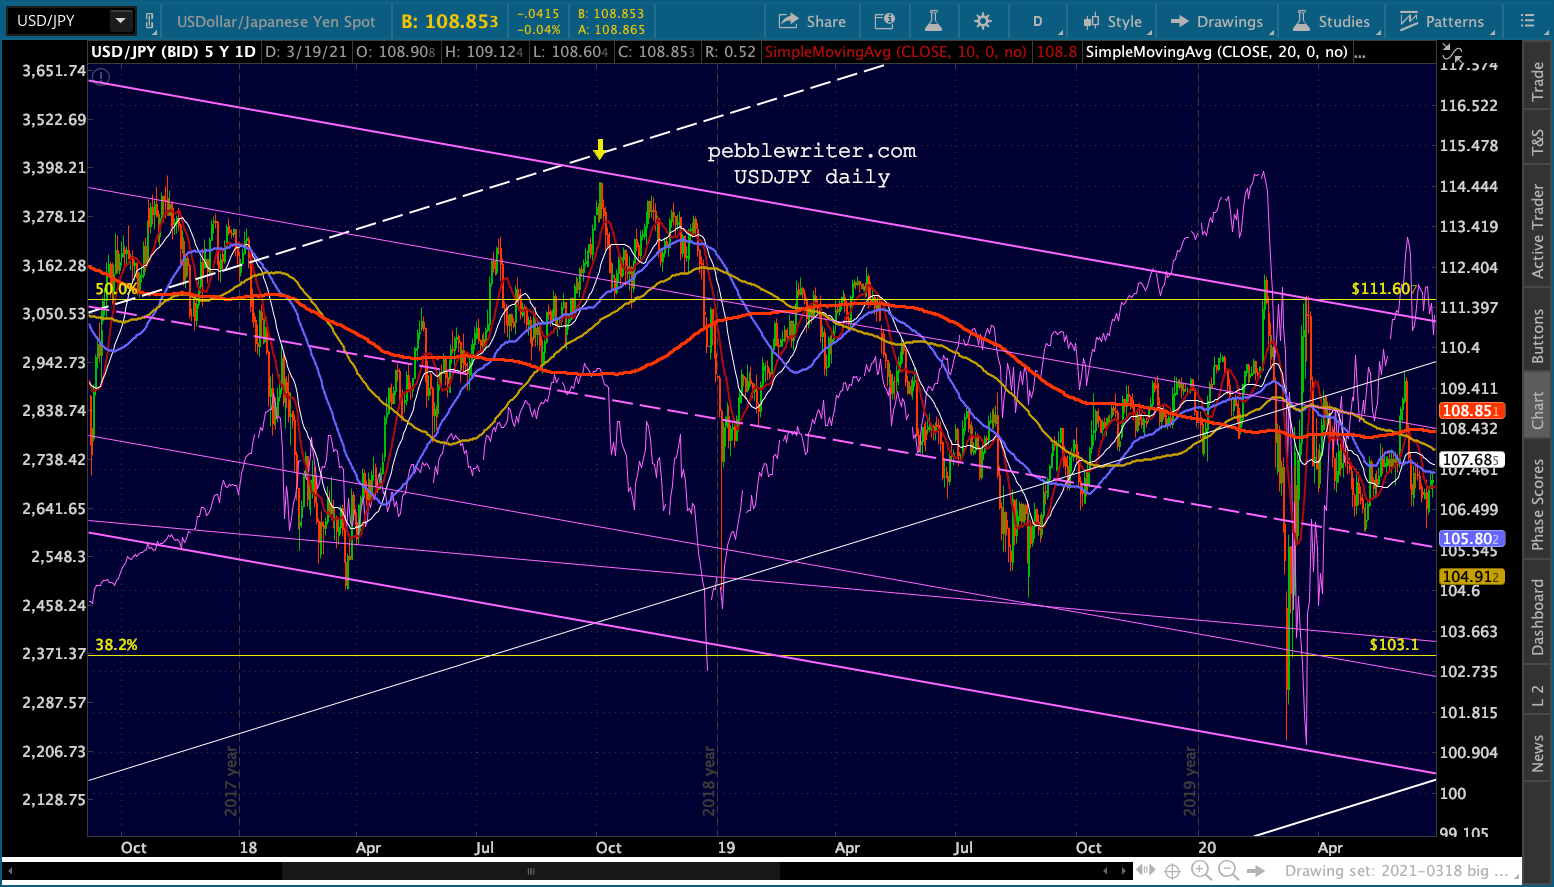 VIX shot from 11.34 on Oct 3 to 36.1 on Dec 24, at which point the PPT stepped in and “fixed” everything.
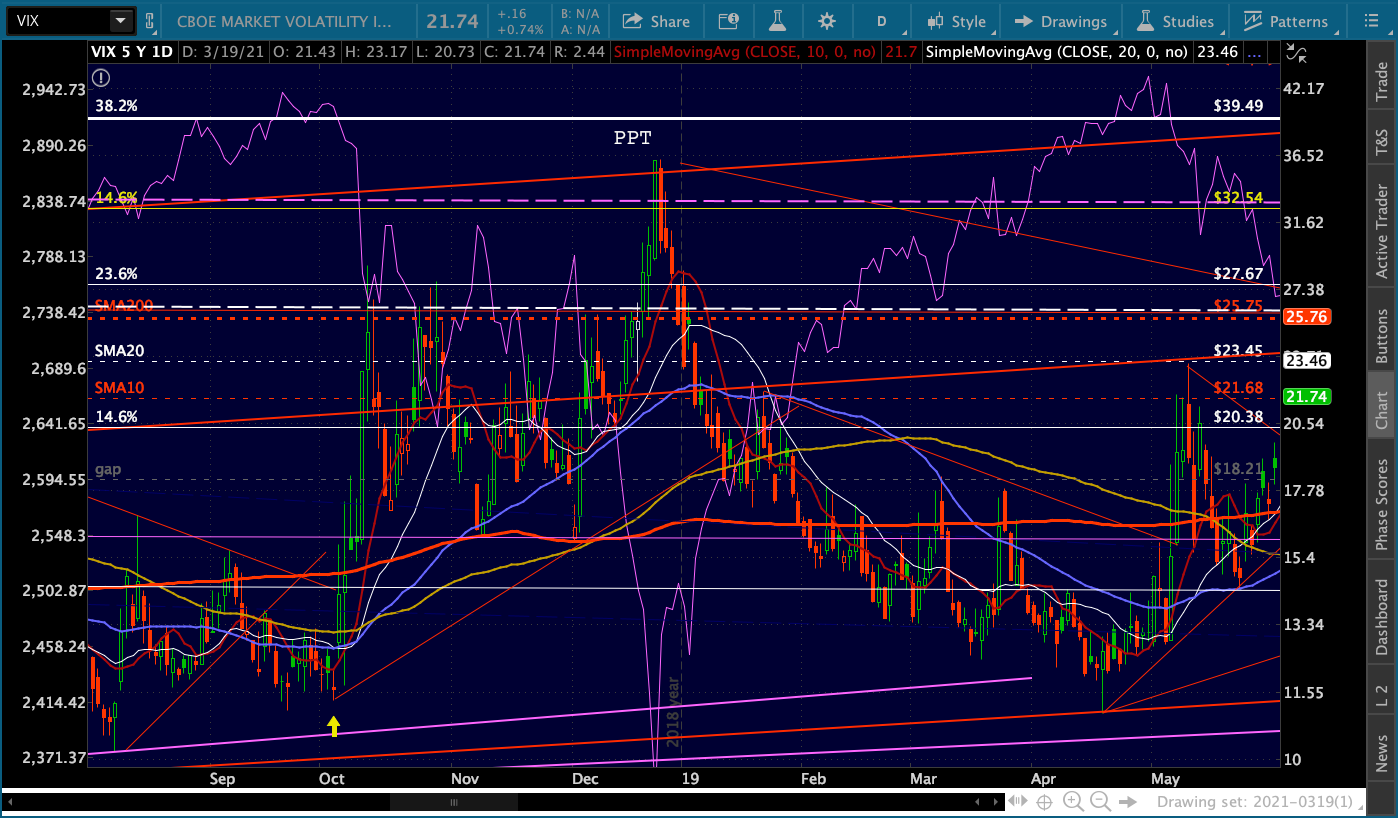 We are in a very similar situation today from many standpoints. But, I believe the Fed has learned to do a better job with VIX, especially. And, a sharp drop in oil prices would make a sharp rise in USDJPY more feasible.
Remember, USDJPY is very close to some very noticeable breakouts.

 I have to duck out for an appointment, so I’ll be working later today and over the weekend to calculate the likely terminus of CL/RB’s downside move. This will give us an idea what exactly to expect from USDJPY.
In the meantime, I’d be very comfortable being short RB and long USDJPY through the weekend.
Comments
One response to “The Big Picture: Mar 19, 2021”
NDX topped 21 years ago on March 24th, 2000. One year later it was down 70%. I thought 21 is an important Fibonacci number? I would like to see the NDX rally next week to fill the gaps and for the VIX to hit 18. I could see it happening with yields pulling back. There’s something special about Feb/March marking important tops and bottoms since 2000.