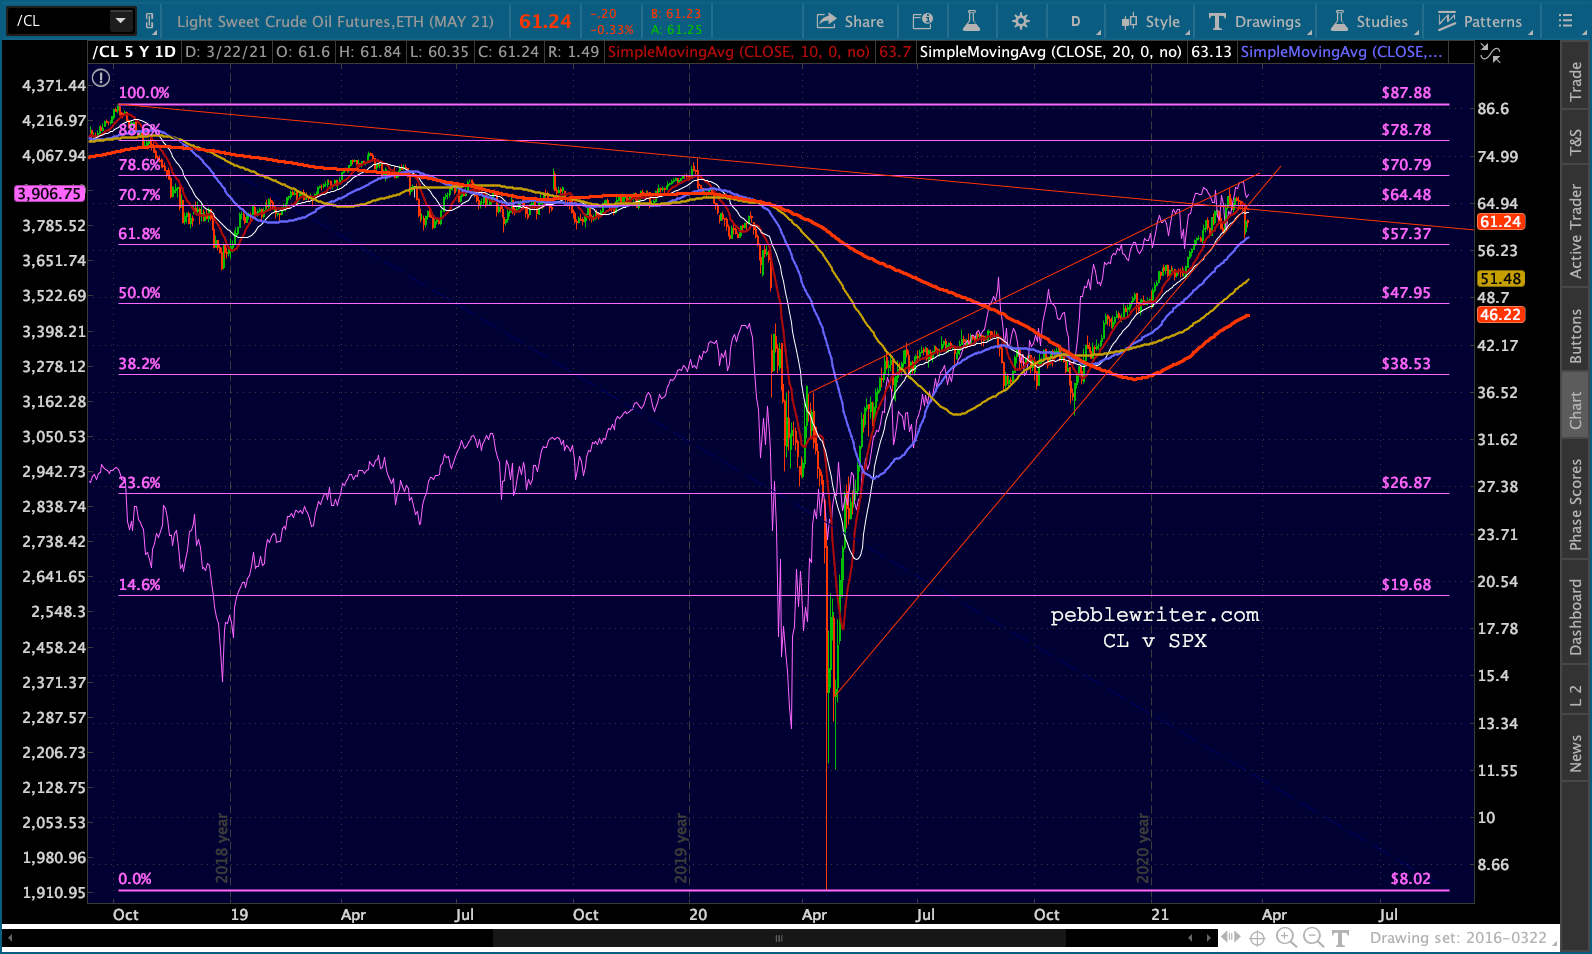
Oil and gas suffered their worst day in months, yields have backed off their highs, and the Nikkei has even broken down ever so slightly.
 Will central bankers back off their insistence that rising inflation and interest rates are of no concern? Maybe they’ve finally tired of yields being the cynosure of the financial press.
continued for members…
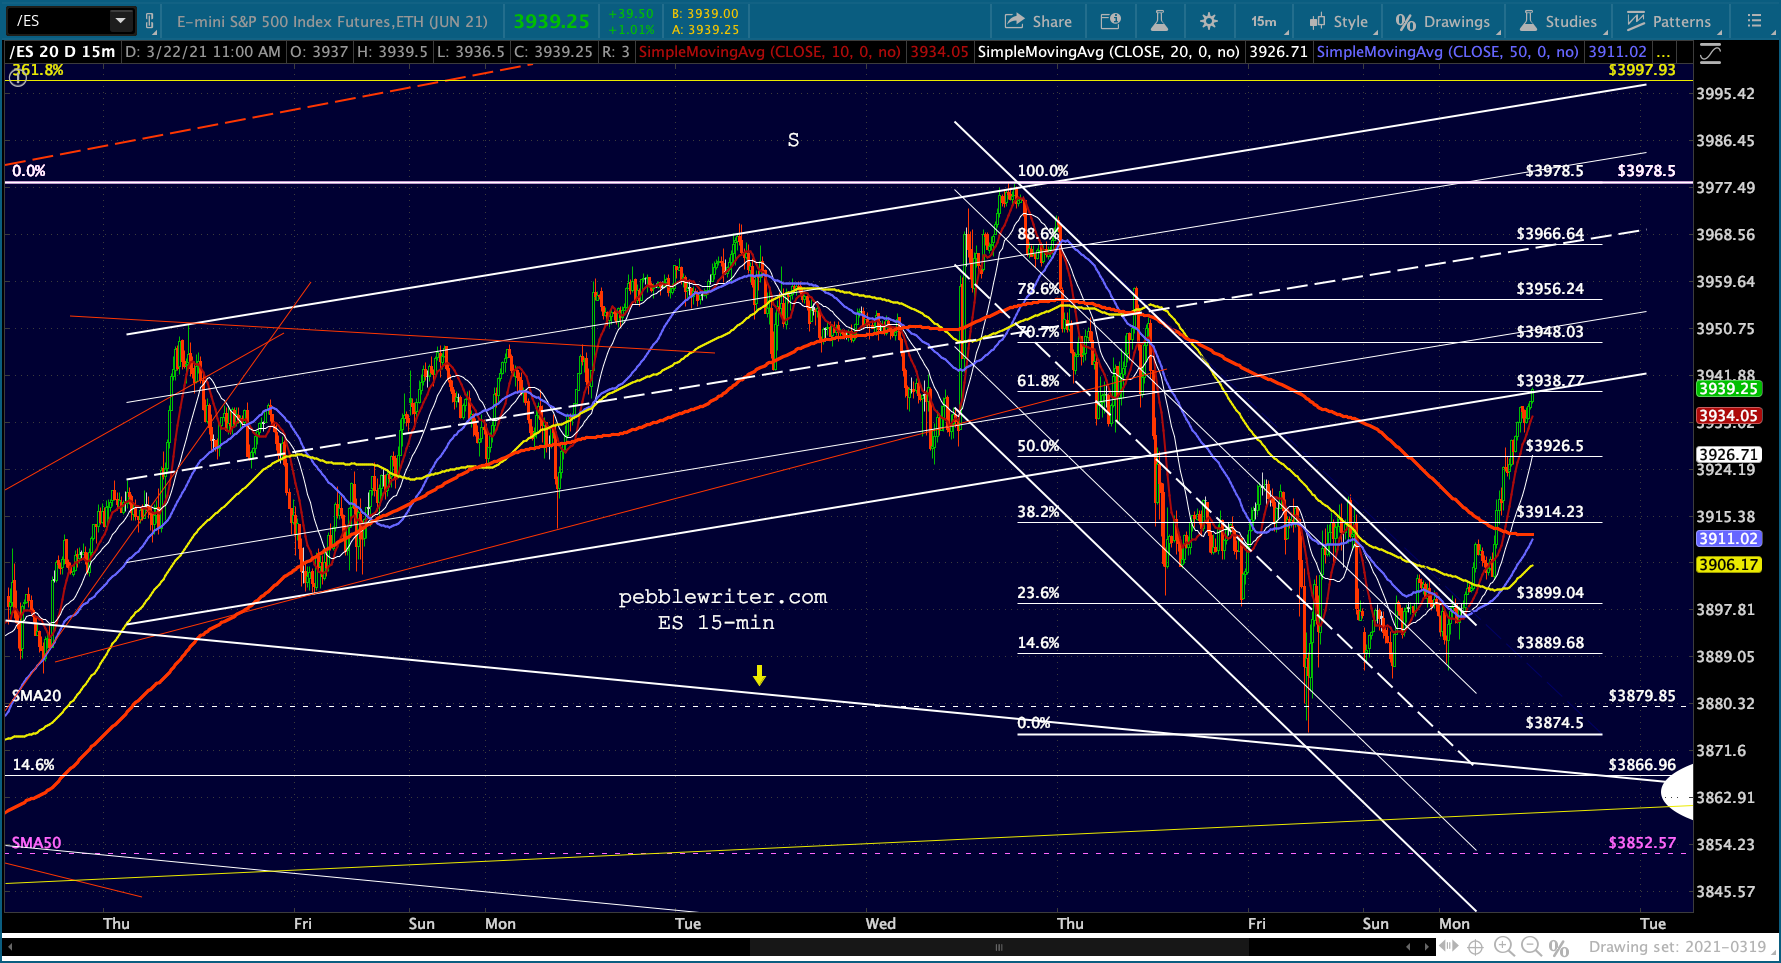
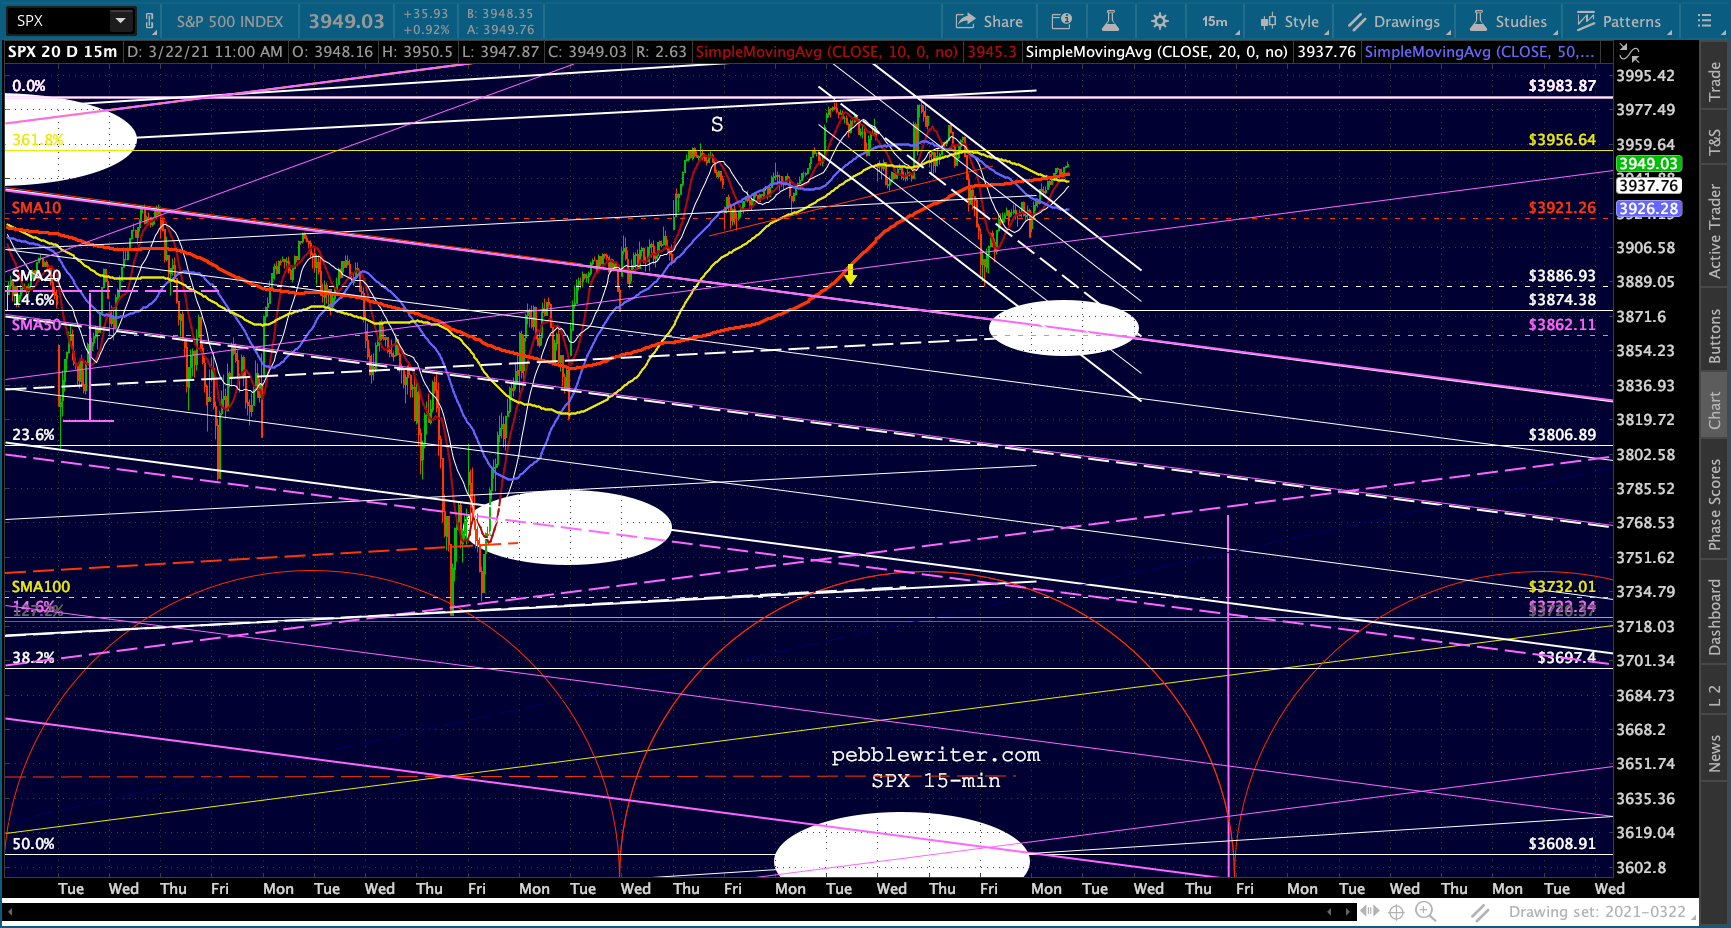
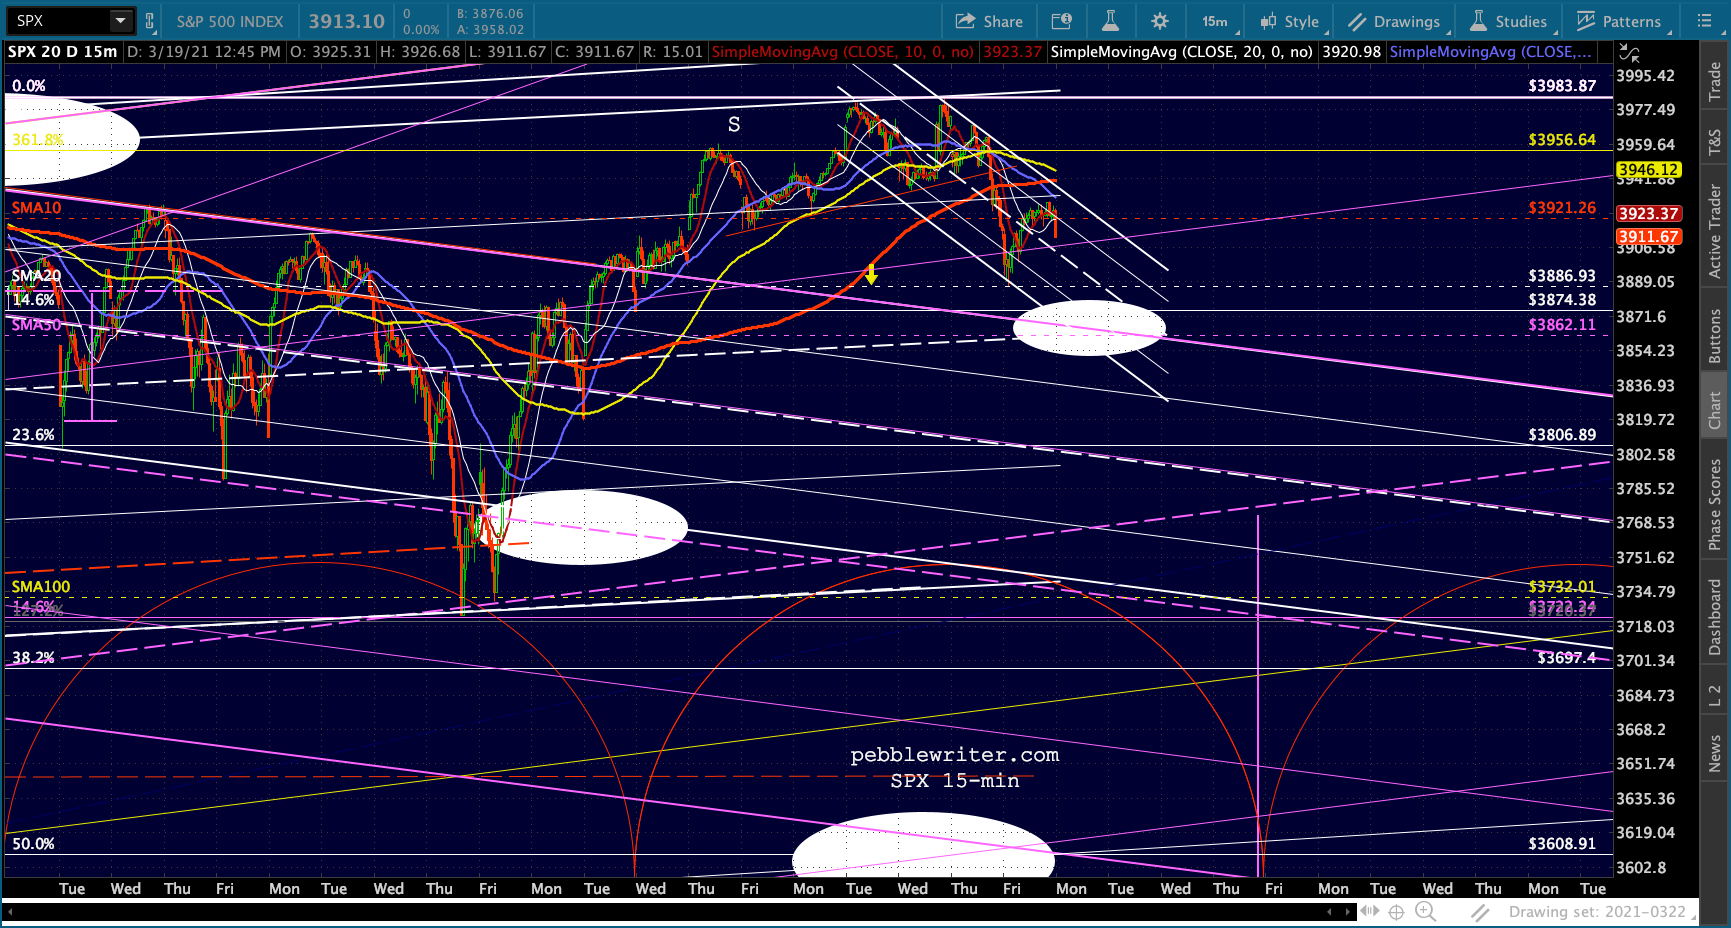
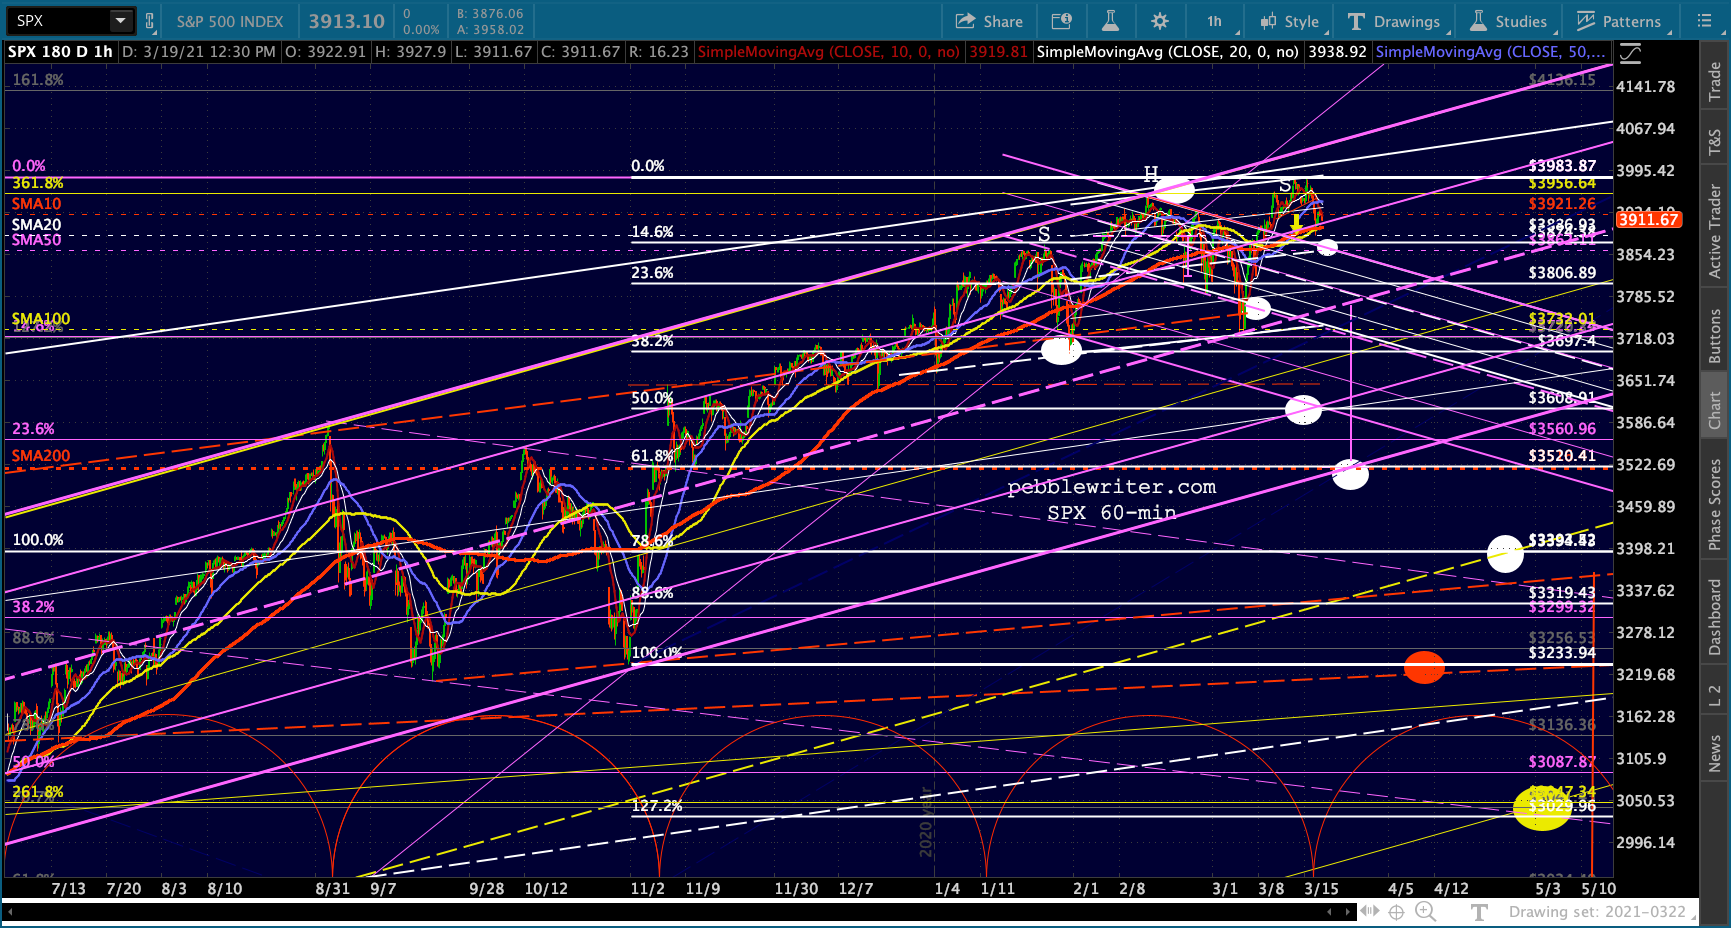
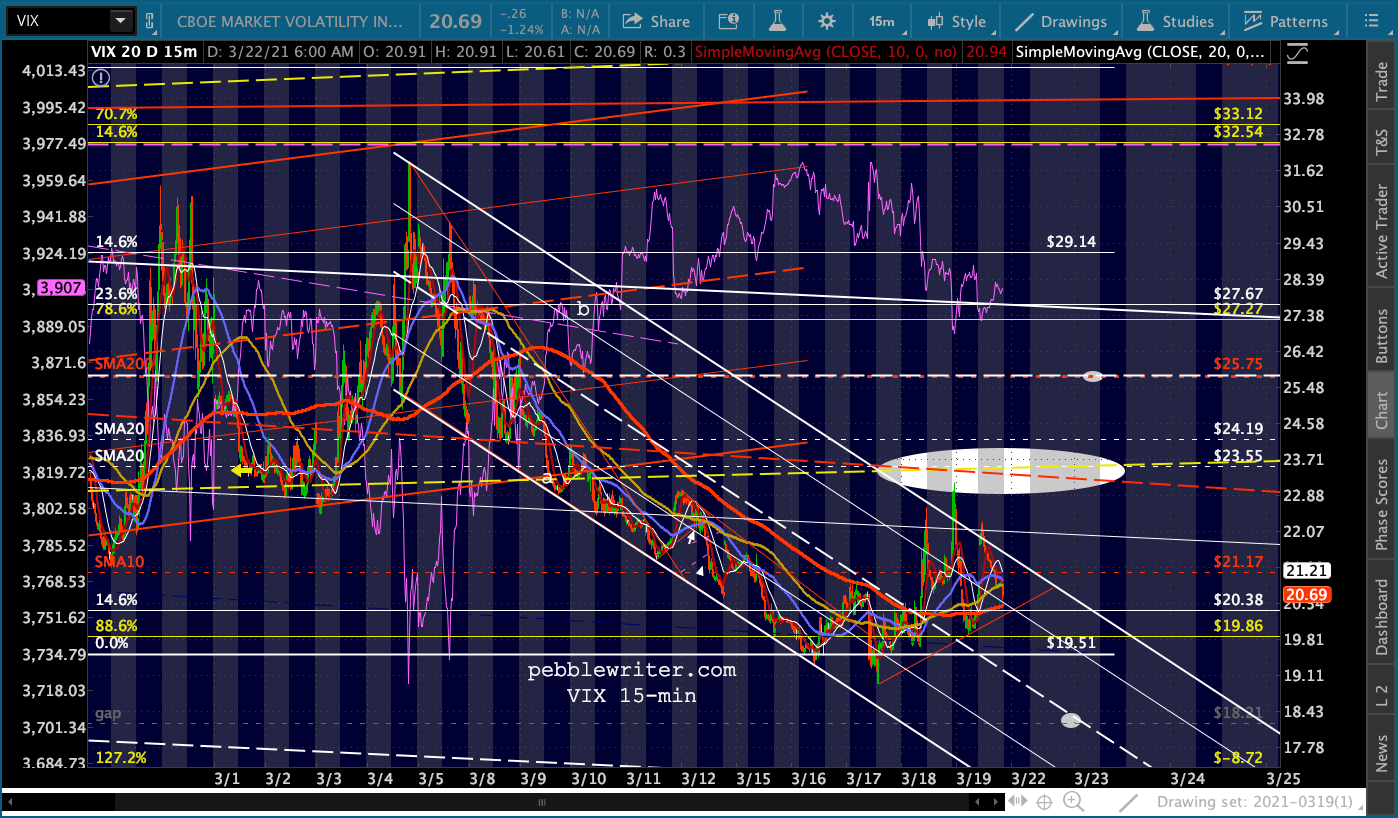
Aside from their nightly ramp and VIX’s apparent plans to “break down,” stocks aren’t looking that positive at the moment. But, VIX’s break down might be all it takes to keep them aloft a little longer, especially if ES’s breakout is to be believed.


 Note that RB and CL are backtesting their recent breakdowns…
 …while USDJPY remains ready to break out if needed.
 NKD has finally dipped below the TL from last March…
 …though it has plenty of upside if the BoJ decides to support it some more after all.
  This means the EURUSD will remain in limbo a while longer…
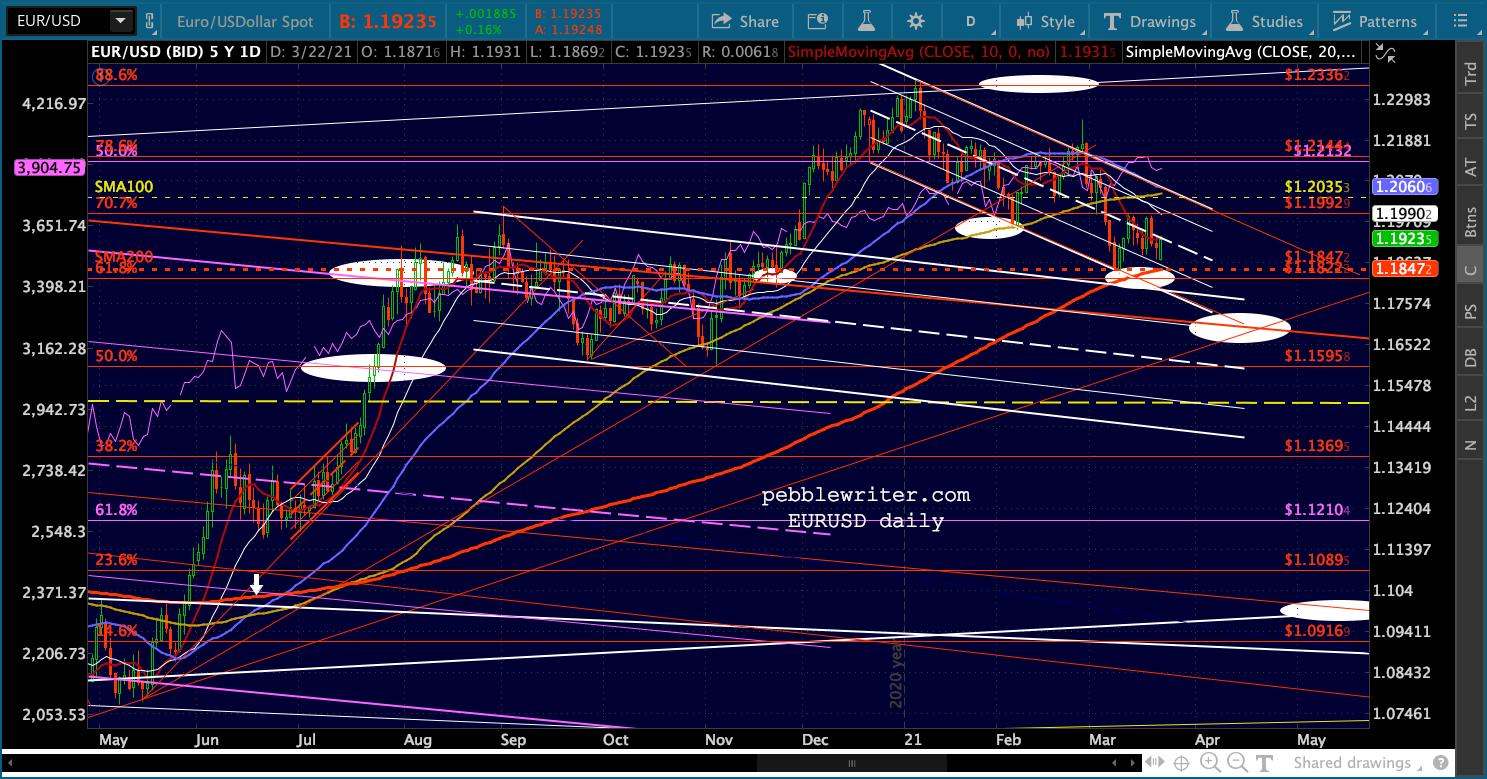 …as will the DXY.
  As we discussed last week, ZN is susceptible to additional downside…
 …which argues for additional upside in yields…
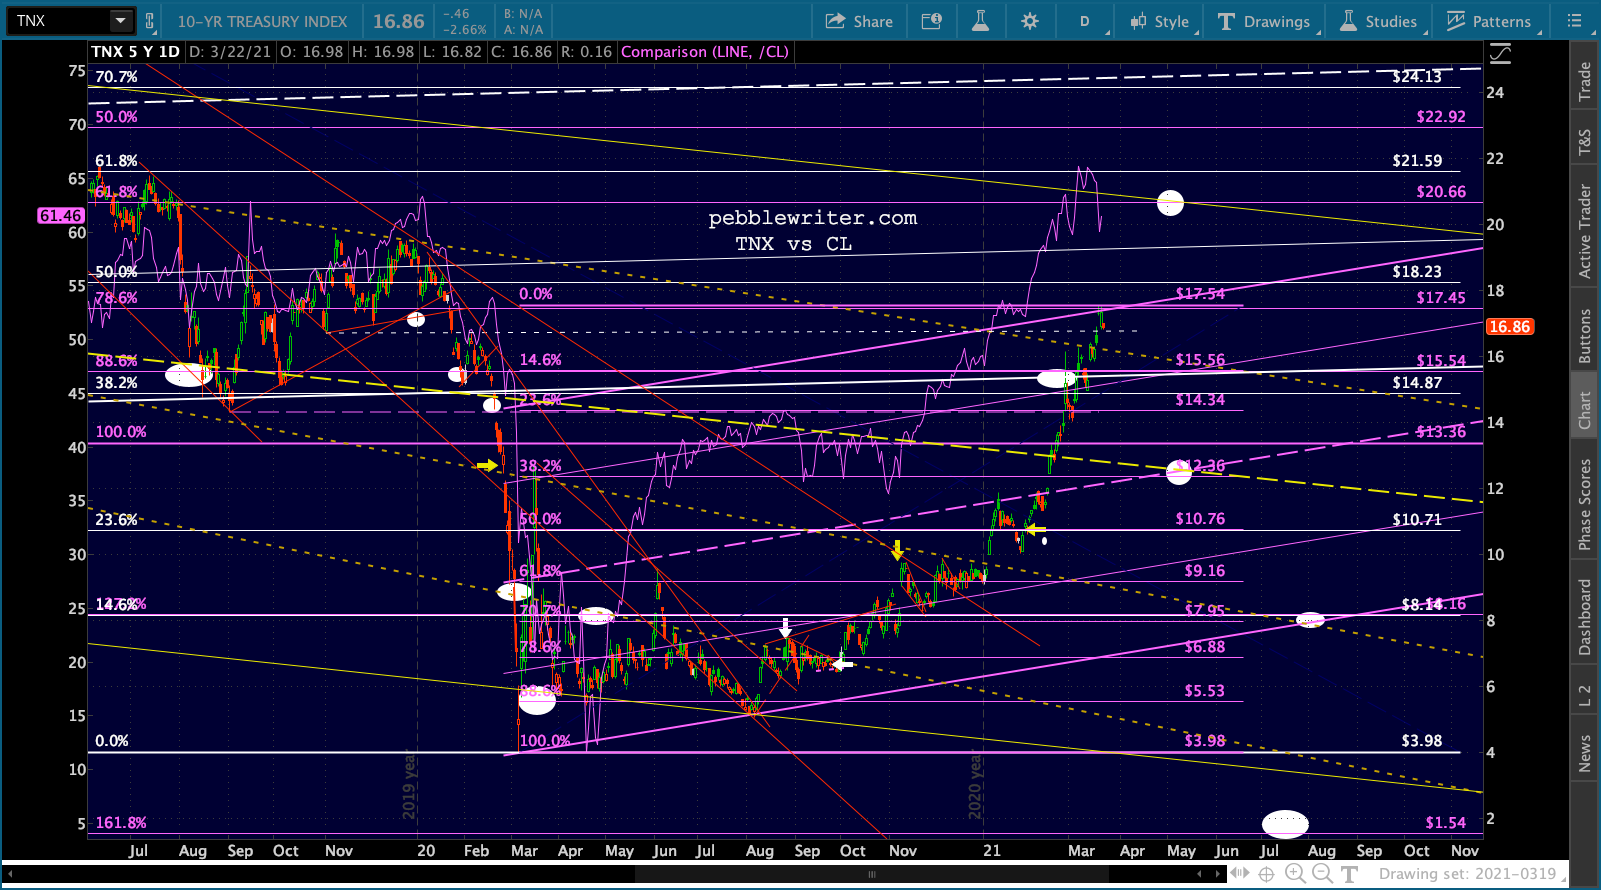 …which would presumably steepen the 2s10s even more.
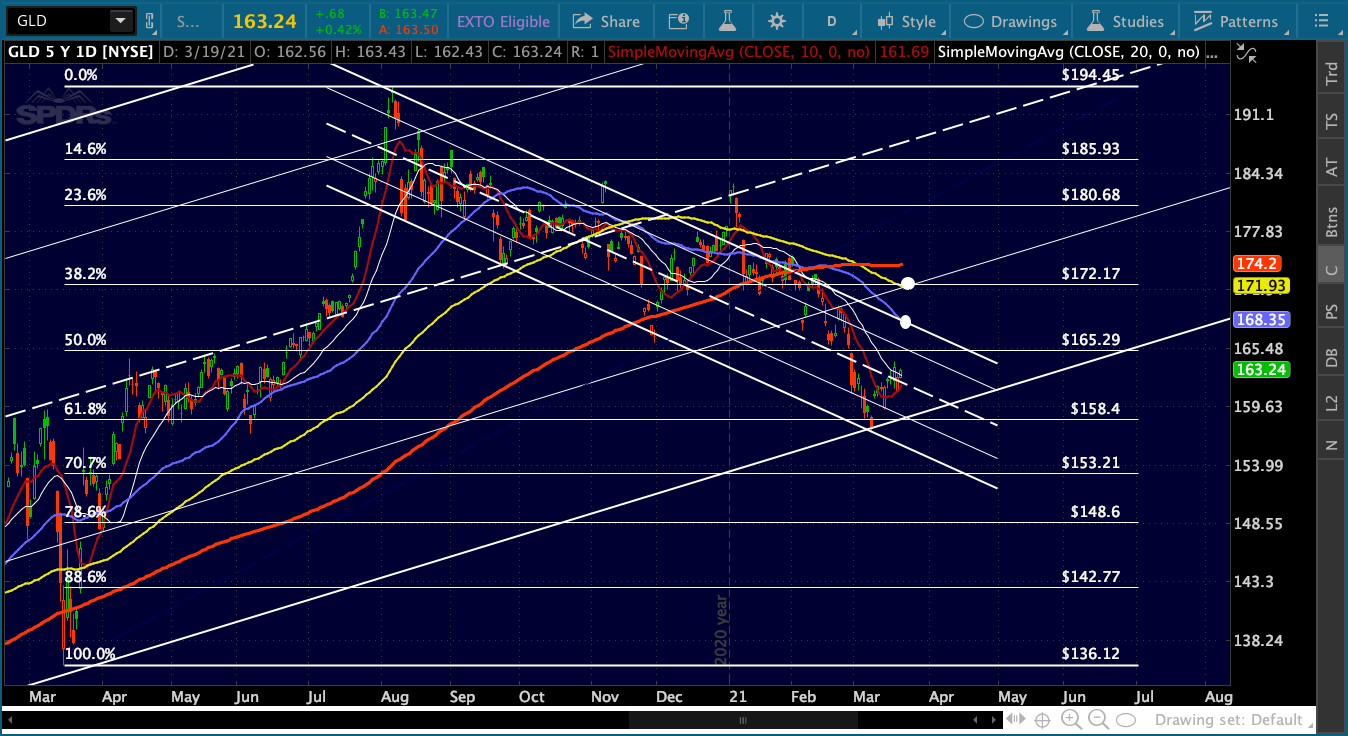
 Gold and silver are stalling here, but likely only long enough to establish better support.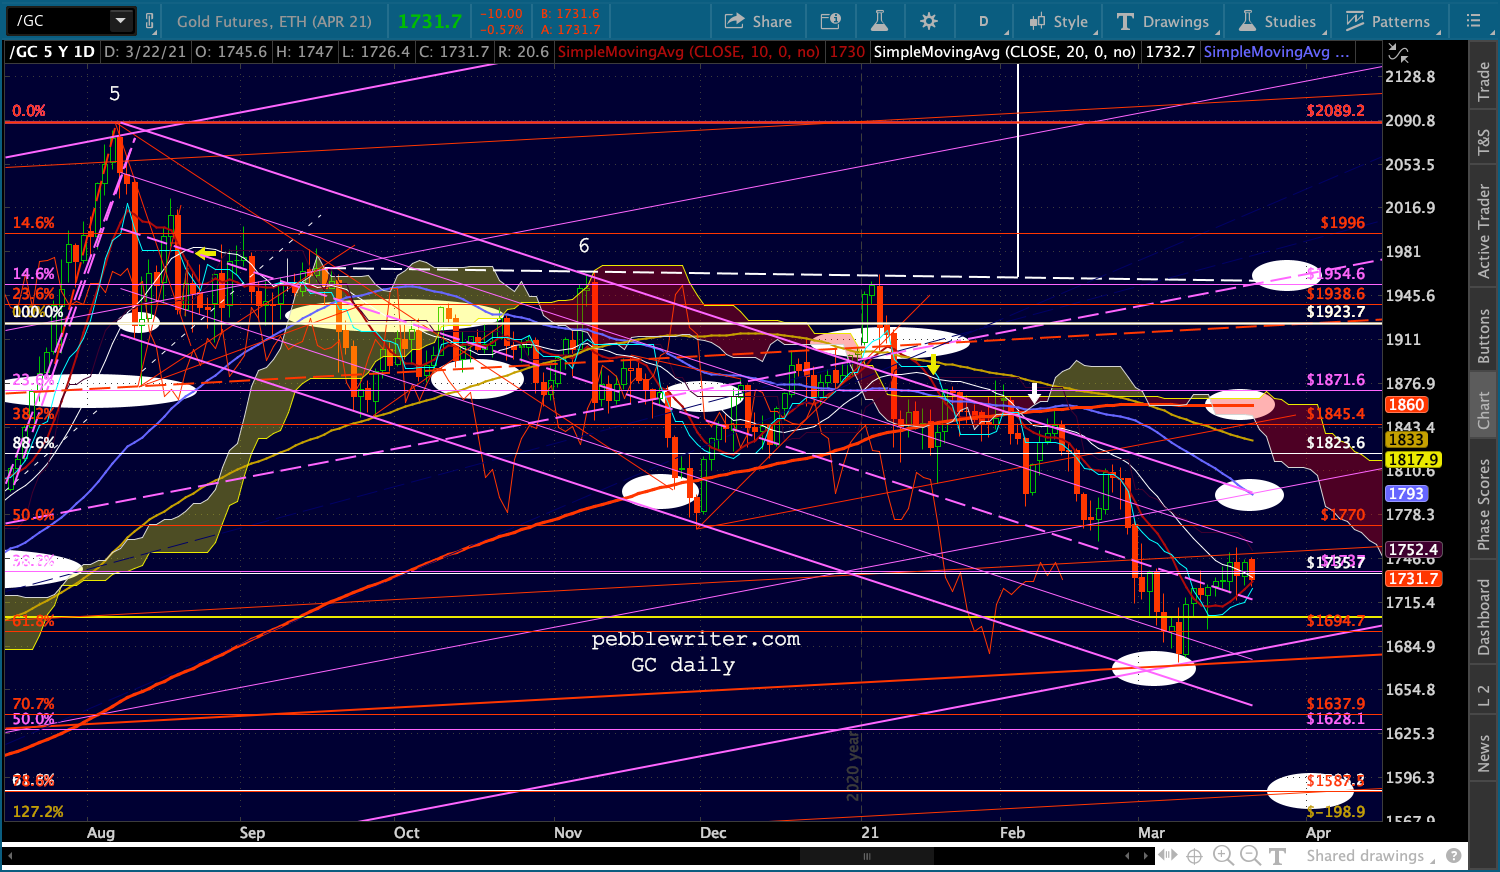
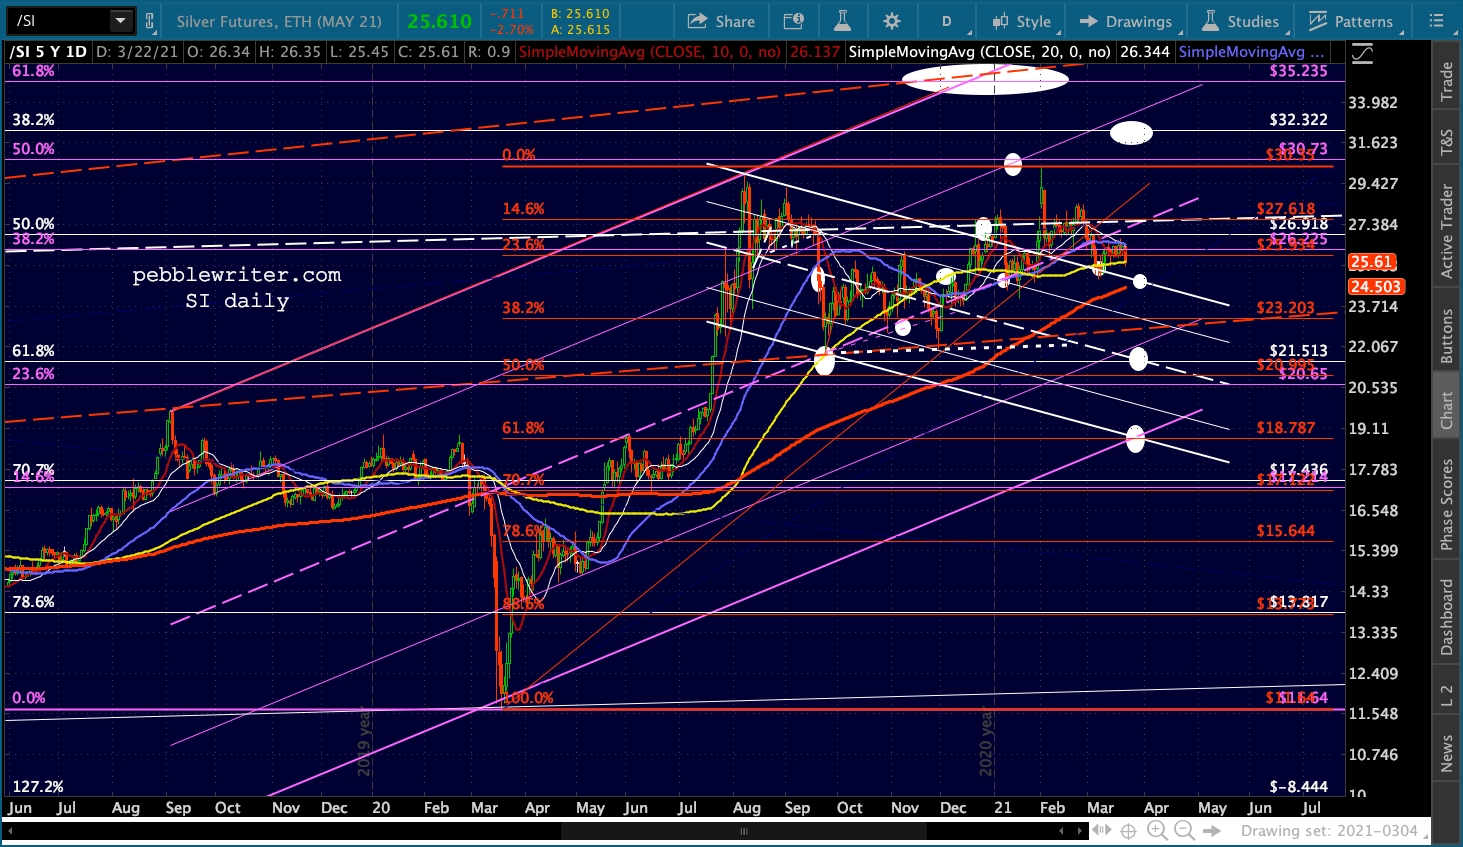 FWIW, GLC’s chart presents the same picture as GC’s: good channel and Fib support, but lots of downside if it breaks down.
 In the meantime, the bounce to the channel top remains the most obvious ST move.
  In the Big Picture post on Friday, I held off suggesting a downside target for RB. The slight decline we saw in RB resulted in an almost imperceptible decline in actual prices at the pump. AAA reports that prices as still above their week-ago level.
I’ve updated the “what-if” chart to include current prices and the comparison out till the end of 2021. Note that the spike in YoY gas prices would be relatively short-lived. Using last week’s 2.766 per gallon as a ceiling, we’d see the YoY delta shoot up to 60.72% by April and drop back to the low 30’s by July.
This would be similar to the peak seen in Feb 2017 when the YoY delta in gas topped out at 32.5% and CPI topped out at 2.74%. The 10Y reached 2.62% – a ceiling which held until Jan 2018 when yields spurted up to the Oct 2018 3.24% highs.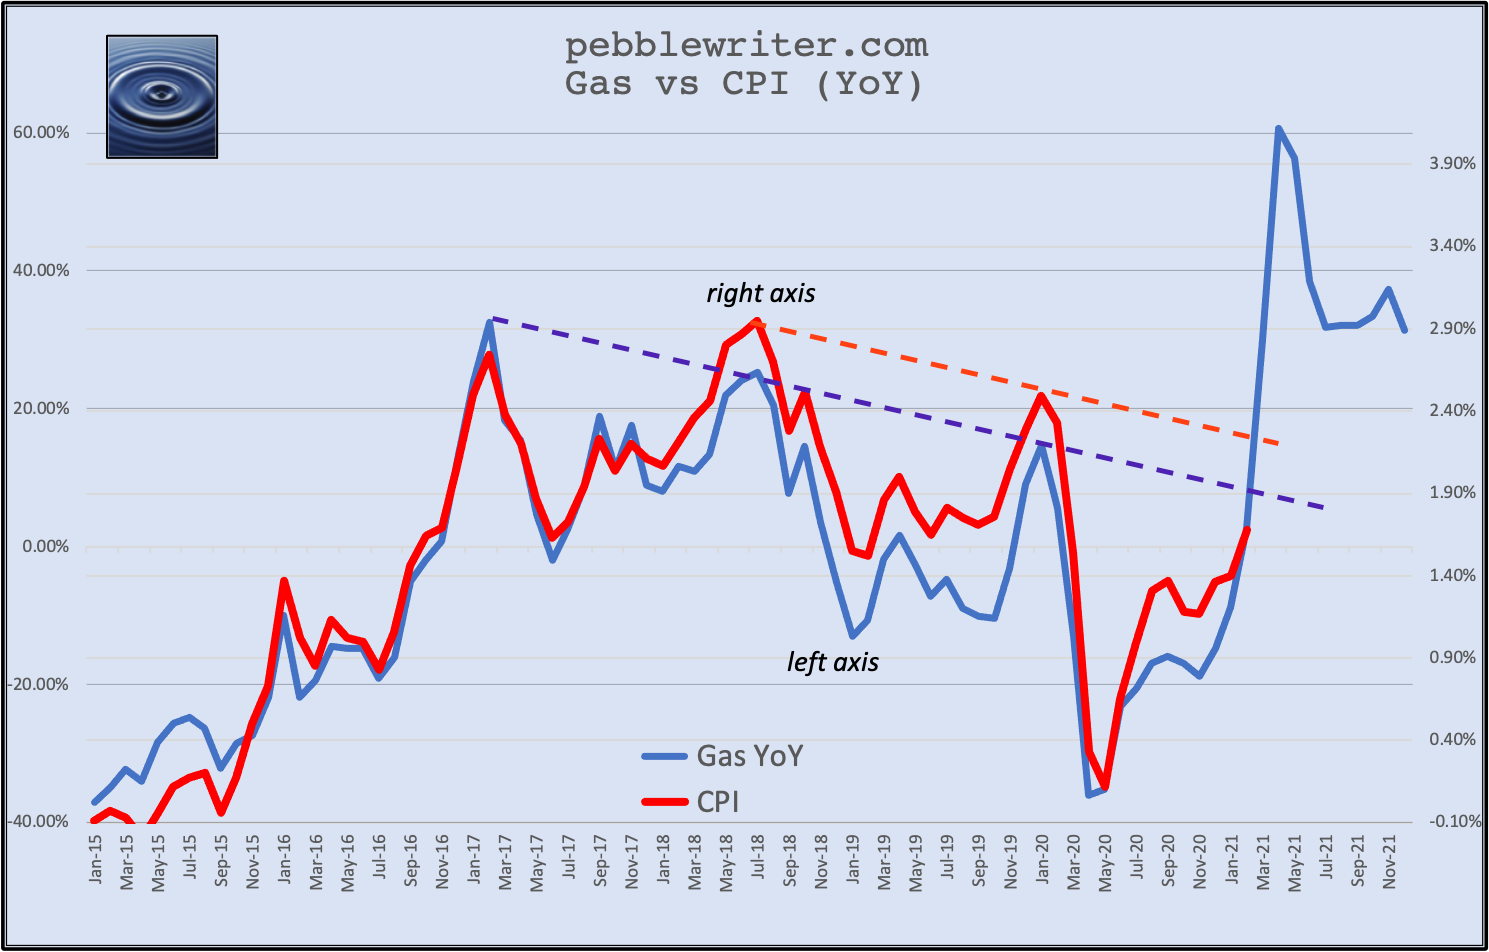
But, my thesis is that the Fed would like to prevent a breakout in rates and CPI. If so, this would suggest a top in CPI of around 2.25-2.35% and a delta for gas of about 10-15%. Achieving this would mean a retail price of about 2.00 – a 28% drop below the current average retail price of 2.77. This would presumably require a similar drop in RB – yielding 1.55 – which is not far off from the current bottom of the rising white channel.
 Does this pencil out? If the February 2021 CPI including a modest 2.4% increase in energy costs…
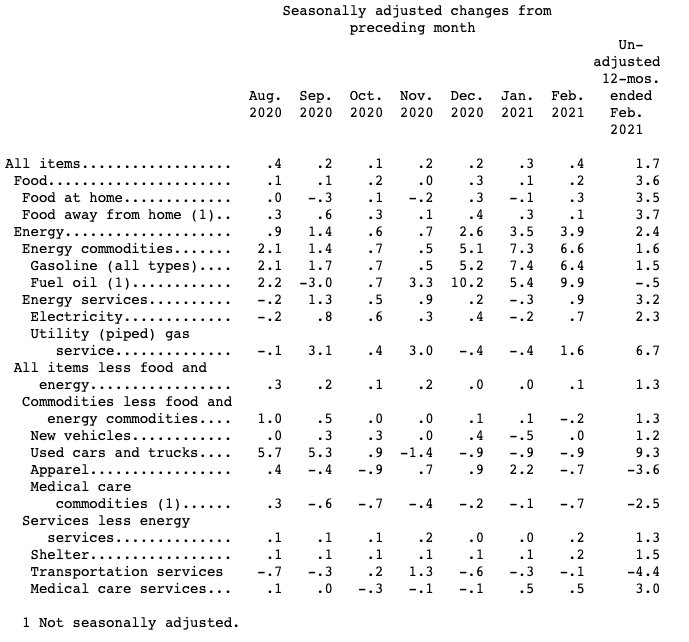 …saw an increase instead of 10-15%, it would be comparable to Dec 2019-Jan 2020, when gas increases averaged 11.9% and CPI averaged 2.39%. Here’s December 2019…
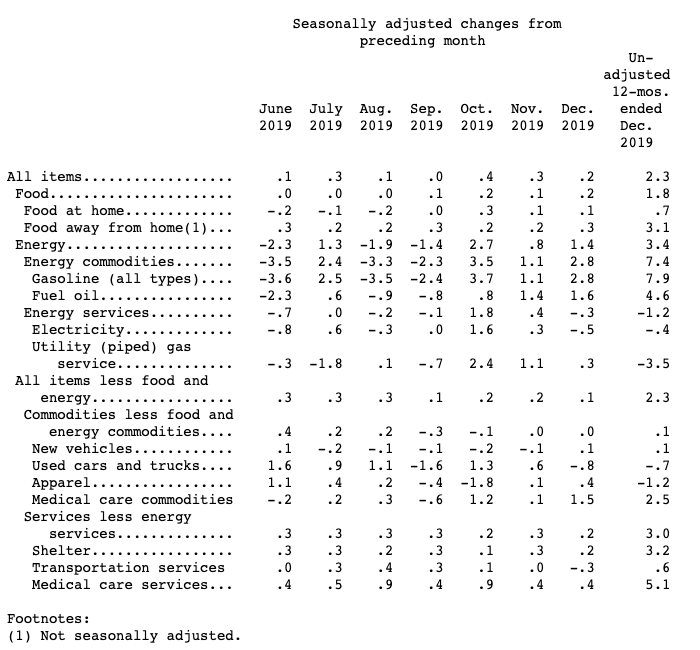 …and January 2020.
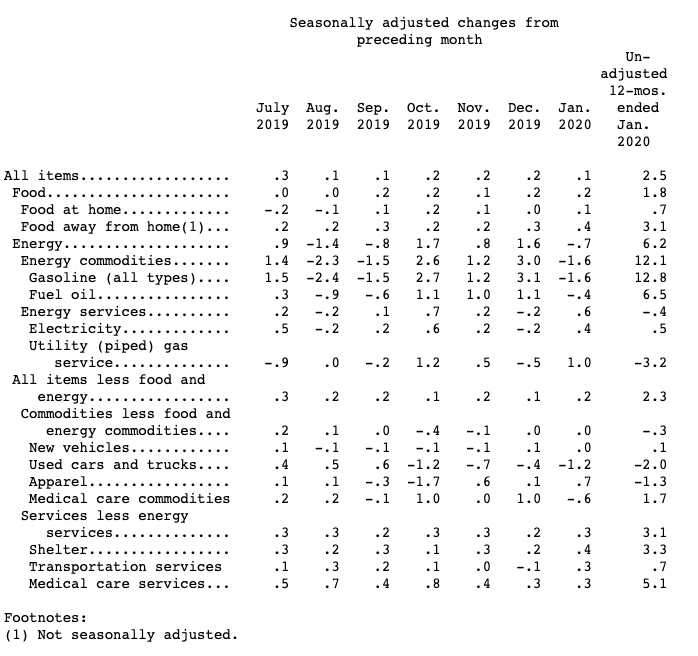 Although there was a minor CPI difference between the two months, there was a major difference in YoY energy price changes: Dec 2019’s 6.2% (12.8% for gas) versus Jan 2020’s 3.4% (7.9% for gas.) Other categories such as apparel, medical commodities and used cars conveniently dropped MoM in order to minimize the overall change.
My thesis has been that rising oil/gas prices have provided a much needed boost to inflation up until recently, but would be an undesirable boost in the coming months if they drove CPI beyond what would be construed as a breakout.
If so, look for April to entail a sharp rise in energy prices combined with a steep dropoff in such areas as utilities and used car prices. Note that the Atlanta Fed’s business inflation expectations for March came in at 2.4%. And, FOMC participants most recently forecast a March 2021 PCE of 2.3-2.4%.
UPDATE: 2:13 PM
This should be the extent of this morning’s ramp job. Though VIX could certainly dip lower to fill the gap at 18.21.