Tag: H&S

  • Update on USDJPY: Jun 18, 2013

    The pair has dropped like a rock since the purple channel broke down on June 5.  It reached the .886 Fib as expected [CIW: Jun 6], then immediately bounced back above the neckline of the H&S Pattern it had completed (in red, below.)

    The following day, it fell back through that neckline, and has spent the past three sessions trying to climb back above it.

    In the process, however, it formed a second H&S Pattern (roughly the dashed yellow line as the neckline.)  Either of them could send the pair tumbling to the white 1.618 at 85.66.

    But, the defunct purple channel has given rise to a decent-looking new channel (in white, below) that — if it holds — could pick up where the purple channel left off and carry USDJPY to new highs?

    But, what if it doesn’t, i.e. if the H&S Patterns play out?

    continued for members

    (more…)

  • The Best Laid Plans

    The best laid plans of mice and men
    Go often awry,
    And leave us nothing but grief and pain,
    For promised joy!

    Robert Burns, 1785

    ORIGINAL POST:  6:45 AM EDT

    The wedges we’ve been watching on DX and EURUSD are playing out.  EURUSD has broken out…

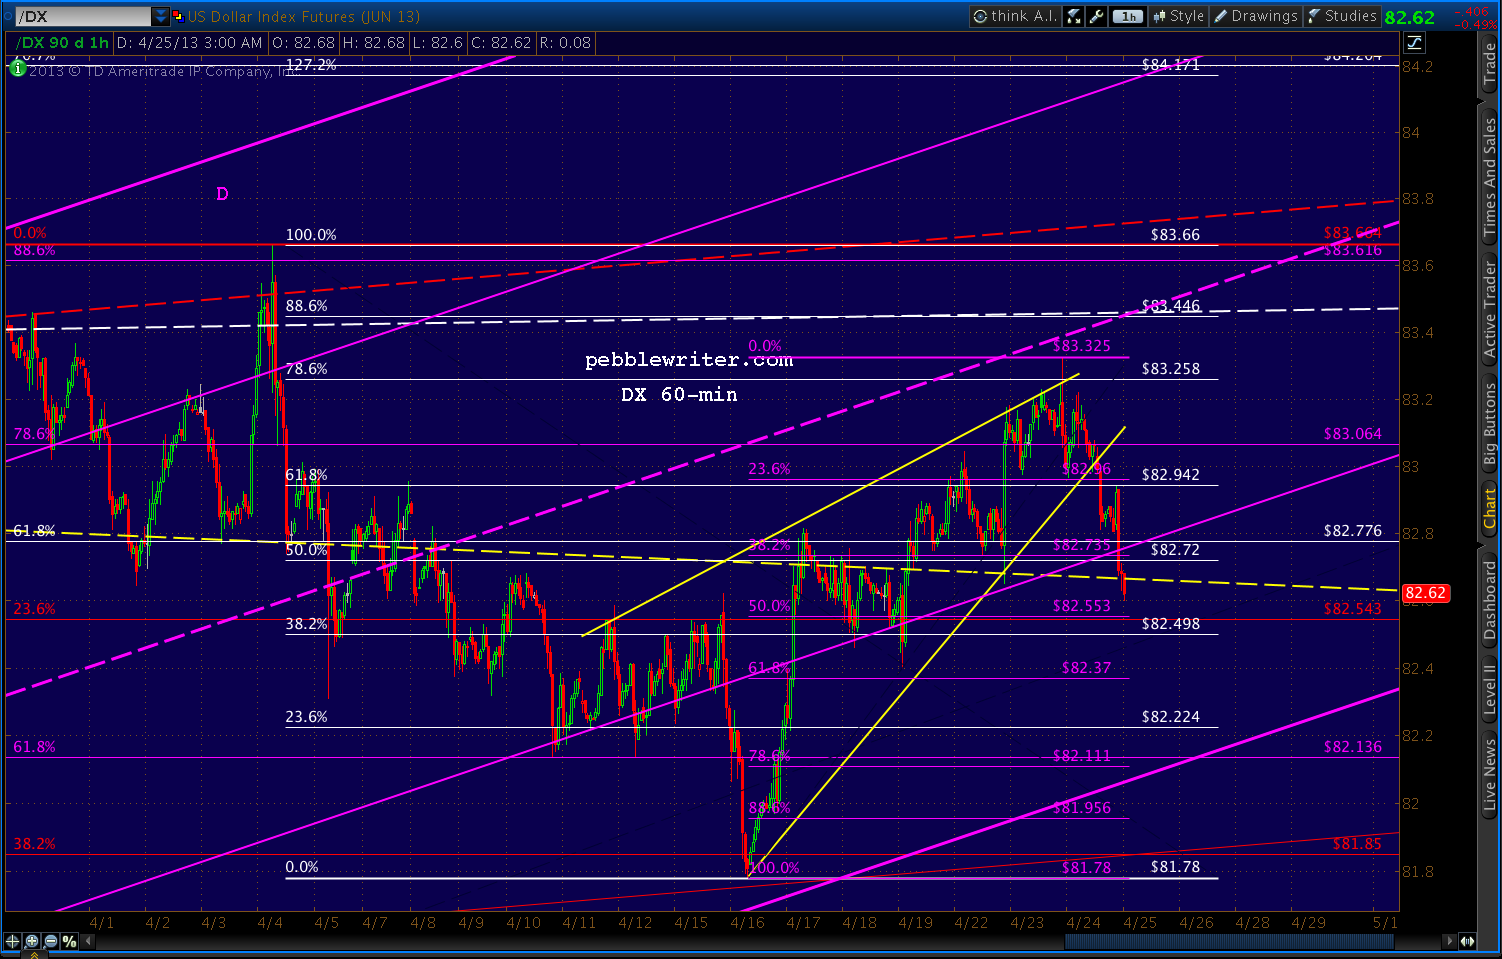
    …and DX has broken down.

    But, it’s the USDJPY that I’m watching especially closely this morning.  It still hasn’t broken 100 since our Apr 8 observation [USDJPY update] that it was running out of steam:

    “…there is growing risk of a downturn as it approaches 100… it appears the pair might have hit at least interim resistance at today’s high.”

    It topped out 3 sessions later at 99.94, and two weeks later is in danger of a larger pullback.

    Remember, weakening the yen was a critical element of the BOJ’s stimulus program that was supposed to generate inflation, boost Toyota sales and send Japanese investment funds flooding into foreign markets.

    Instead, Japanese investors are repatriating their funds from abroad — a net Y9.5 trillion ($95 billion) since the first of the year.  Why?  As any US investor could tell you, QE might not inflate economies, but it sure as hell inflates markets.

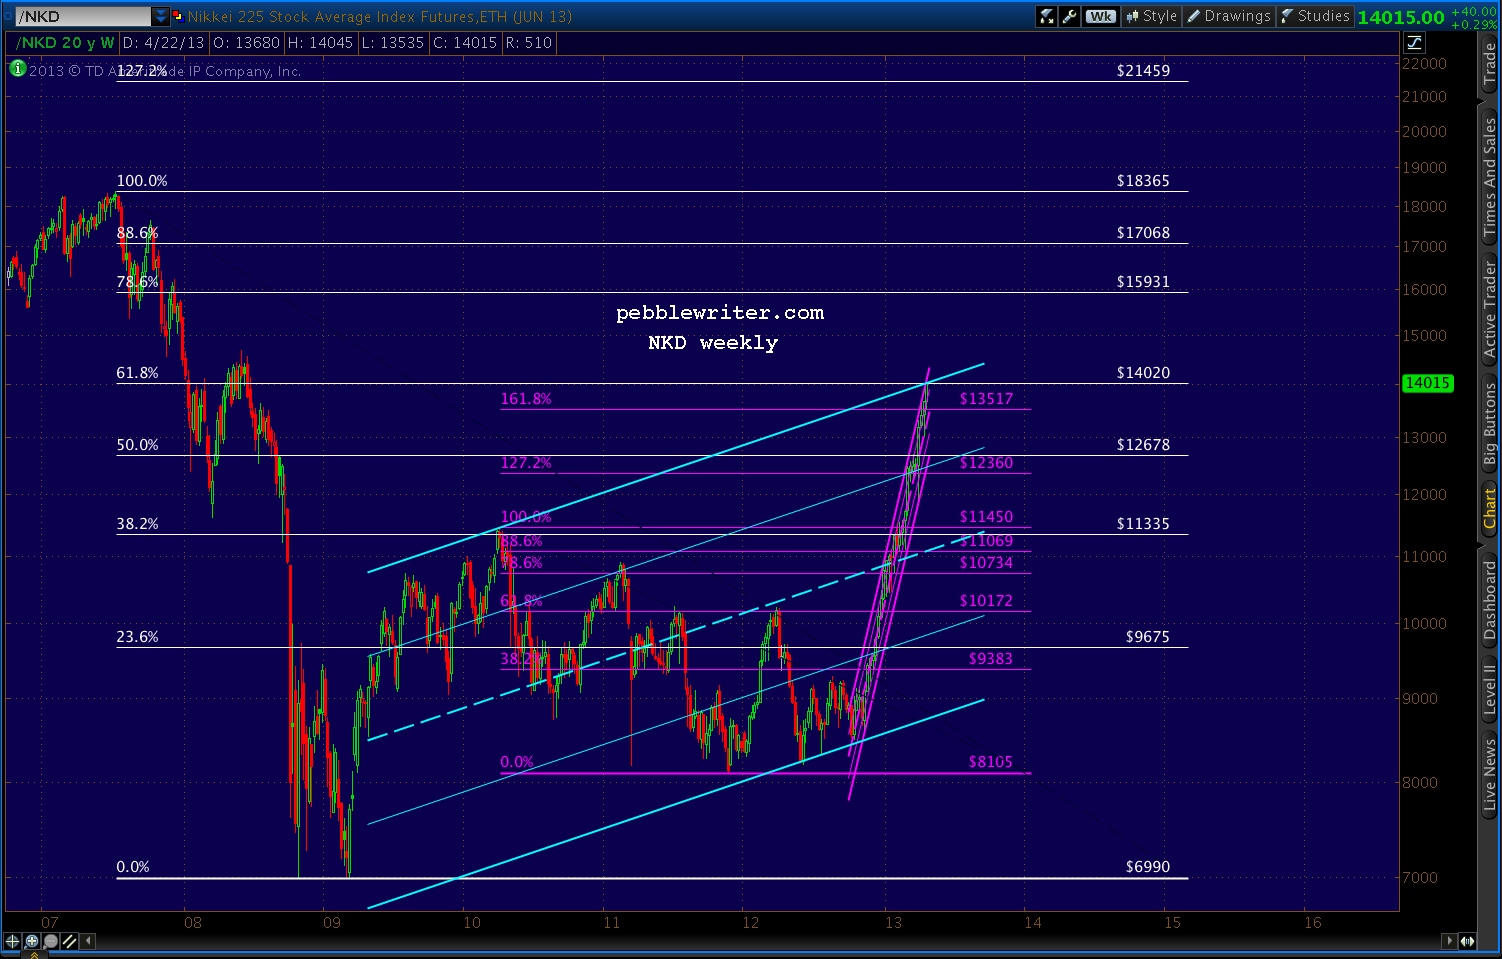
    The Nikkei 225 is up 65% since last October’s lows….

    …and, still hasn’t even recovered 2/3 of its losses from the 2007 crash.  The Dow and the S&P 500, by contrast, have recovered all of them — and, then some.  So, to many, the Nikkei still seems the better value.  It’s hard to argue with success.

    But, I’ll do it anyway.  In reaching 14,020 a few hours ago, NKD tagged the .618 Fibonacci retracement of its 2007-2009 crash from 18,365 to 6990.

    To those not familiar with harmonics, this tends to be a big deal.  When SPX reached the equivalent point in April 2010, it plunged 17%.  The DJIA fell almost 15%.  The USD, represented by DX, soared 9.3%.

    But, the yen positively soared.  USDJPY started a 17-month slide that took the pair down 20% from 94.98 to 75.78.  NKD, which had just reached its .382 Fib, shed 23% over the next 4 months, eventually reaching almost 30% in Nov 2011.

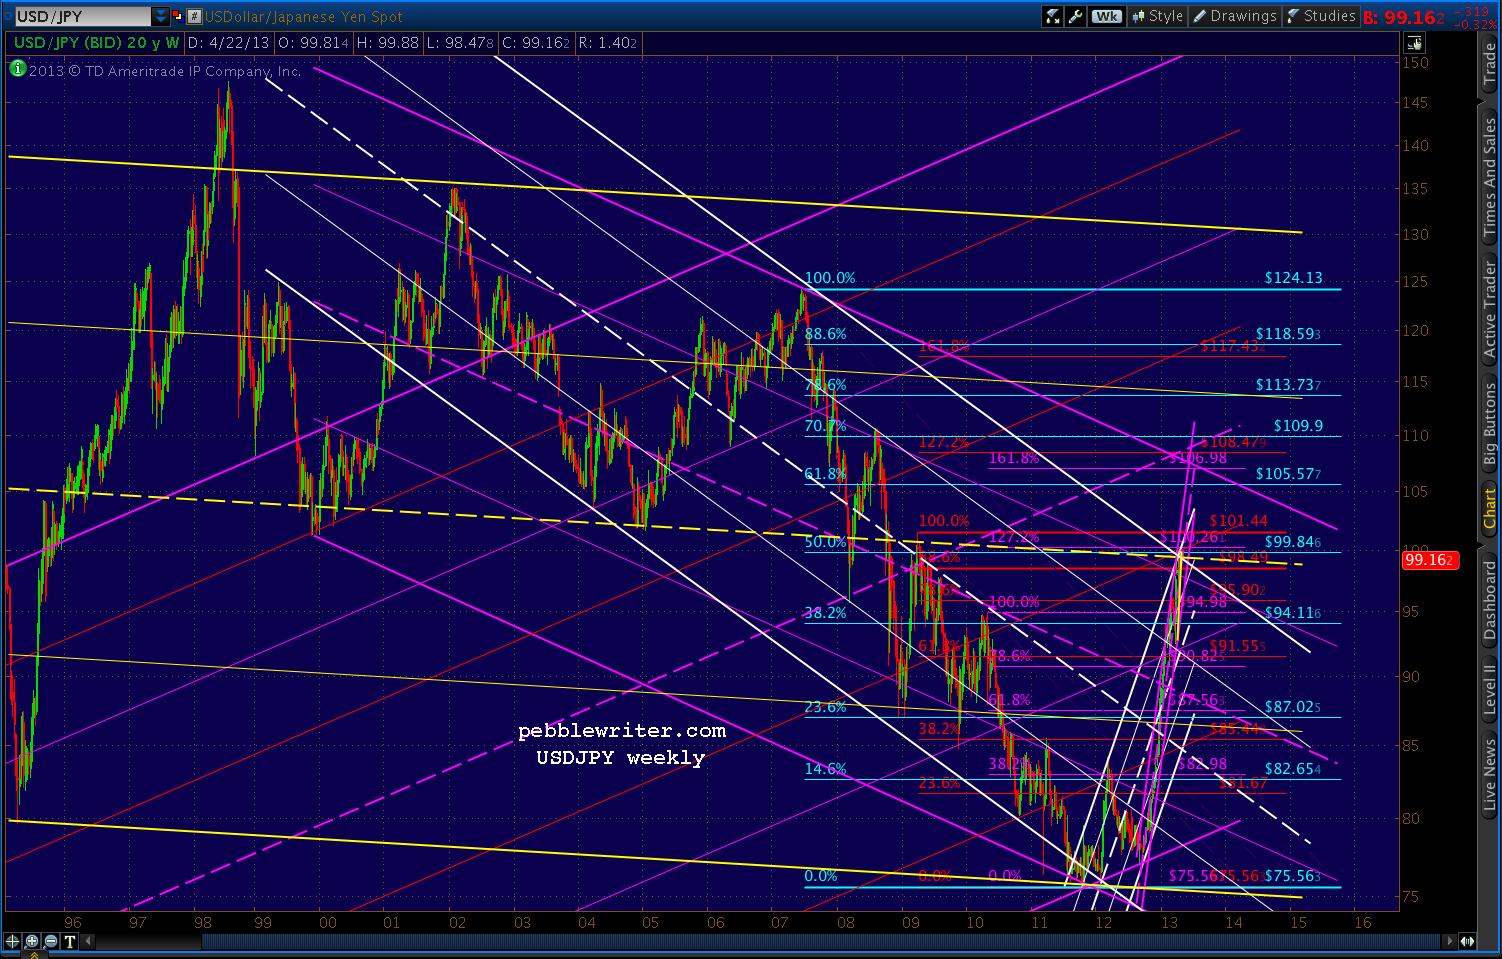
    Could the USDJPY’s failure to break 100 be telling us something?  You better believe it.  I called a top a few weeks ago because the pair had reached several important Fib levels as well as the midline of an important channel (in yellow, below)…

    …that dates back to 1995.

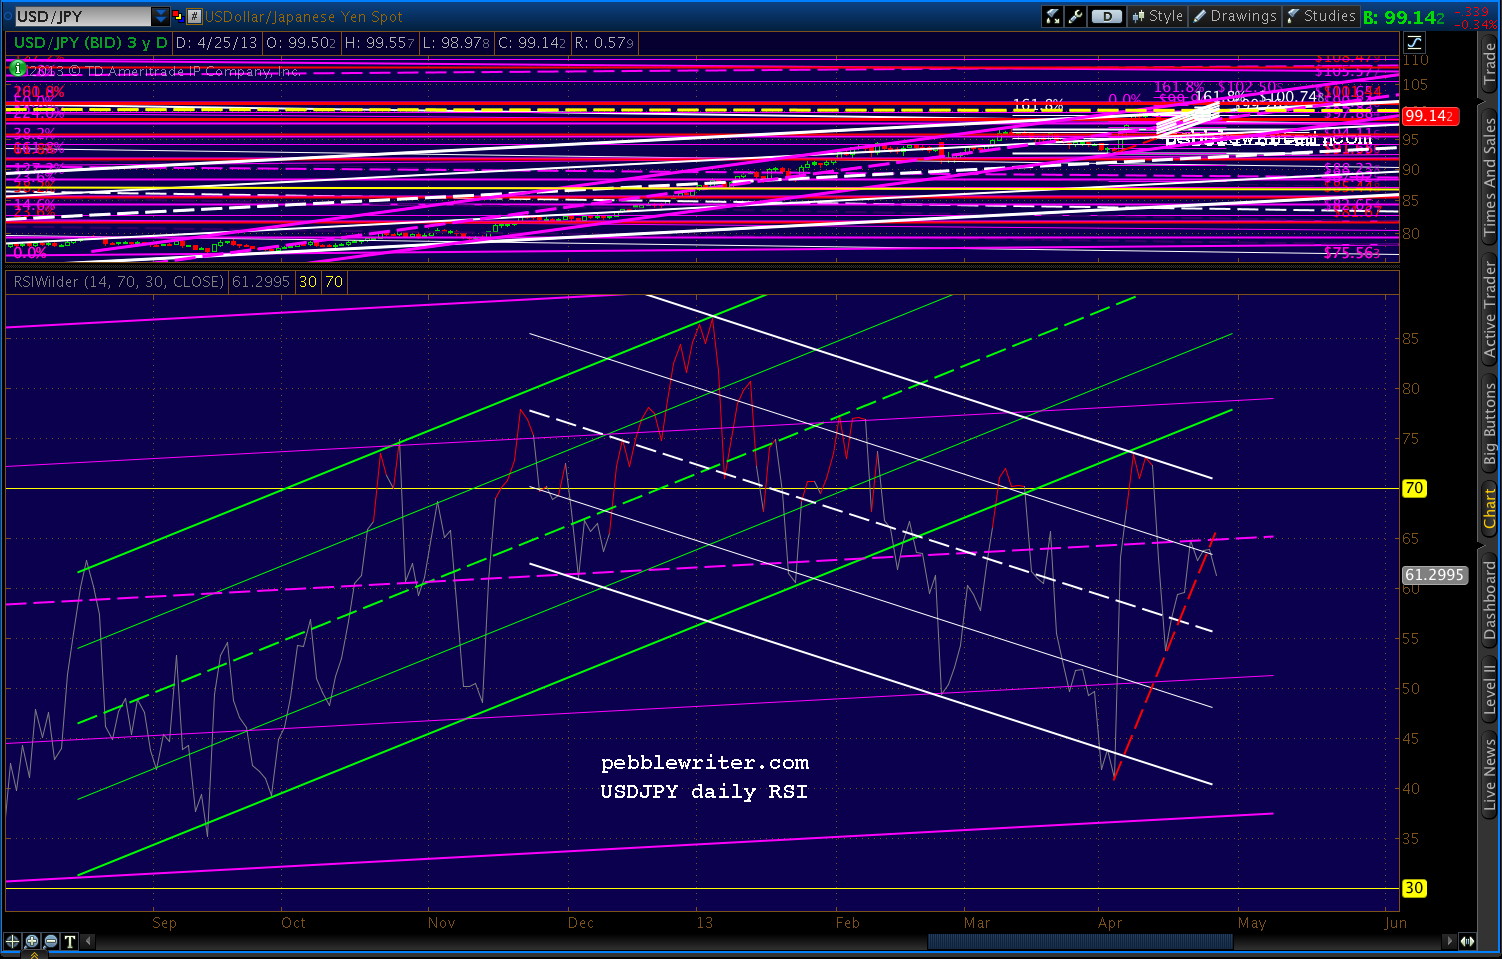
    There’s no guarantee it won’t push through instead of retreating, but the RSI picture supports the danger of a significant retreat.

    Daily RSI has backtested the broken yellow channel twice, but the trend is clearly down — with the latest push being rebuffed by the purple midline.

    And, a close-up reveals that a breakdown has already started.

    Stay tuned.

    UPDATE:  9:25 AM EDT

    With SPX set to open 5-6 points higher, it stands a very good chance of reaching our 1584.23 target. In other words, a pop and drop is very much in the cards.

    If it goes any higher, look for 1590.36 instead.

    UPDATE:  9:40 AM

    That’s good enough for me.  I’m closing my long position and reverting to full short here at 1584.80.  Stops around 1586ish.

    The .25 of the purple channel is right around 1587, so I’d use some discretion around that stop level and look to see if there’s any real strength behind a move higher.

    UPDATE:  10:25

    Getting a push through 1587, so I’ll open an interim long position for what should be only a few points higher to the .886.  Core short remains in place.  Tight trailing stops.

    I wouldn’t start getting nervous about the short position until around 1594 — the trend line (red, dashed) that extends from the 2000 and 2007 peaks.

    UPDATE:  10:50 AM

    I’ll go ahead and close that interim long here at 1590.  While I still think there’s potential to the 2000-2007 trend line, it could easily happen after the correction that should begin in the next hour.

    That way, the Inverted H&S Pattern would feature a neckline that’s roughly the same as the purple channel .25 line, and would target the same price level as the 1.618 extension of the 1597-1536 slide: 1635.

    This is a very artfully crafted scenario to justify (from a technical standpoint) a rally above that red TL — which is one of the last remaining technical impediments to a continuation of the rally from 1343 in November.

    Can they pull it off?

    continued for members(more…)

  • Chart Patterns and You

    ORIGINAL POST:  9:15 AM

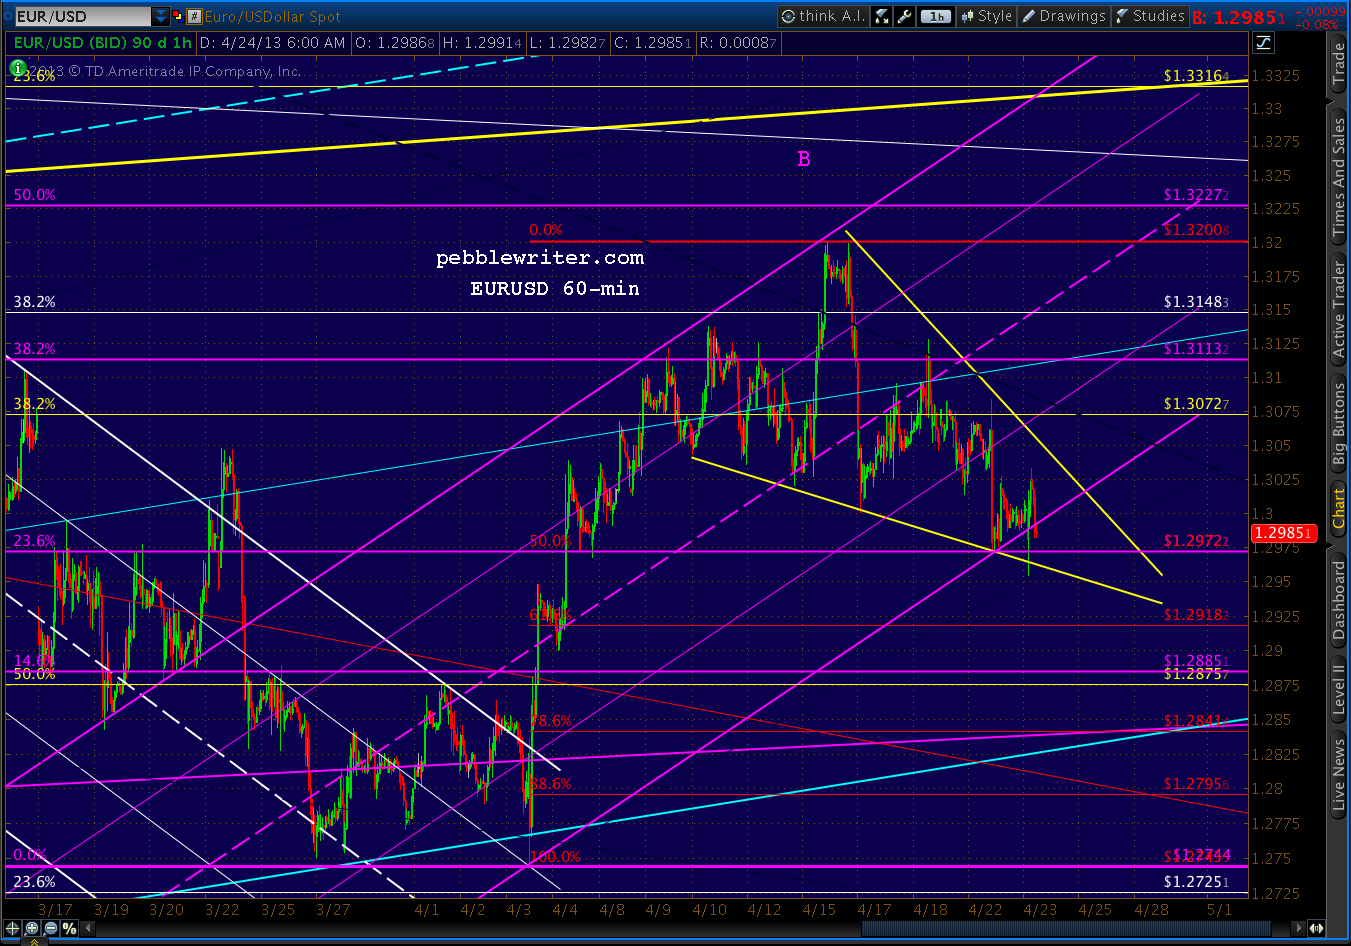
    Last night, the dollar tagged the .786 Fib retracement of its decline from Apr 4.  It subsequently sold off almost to the .618 but, so far, is hanging in a rising wedge.

    The EURUSD re-tested the .500 Fib of its rise from Apr 3, and snapped back into its falling wedge and the (purple) channel that’s guided prices since then.

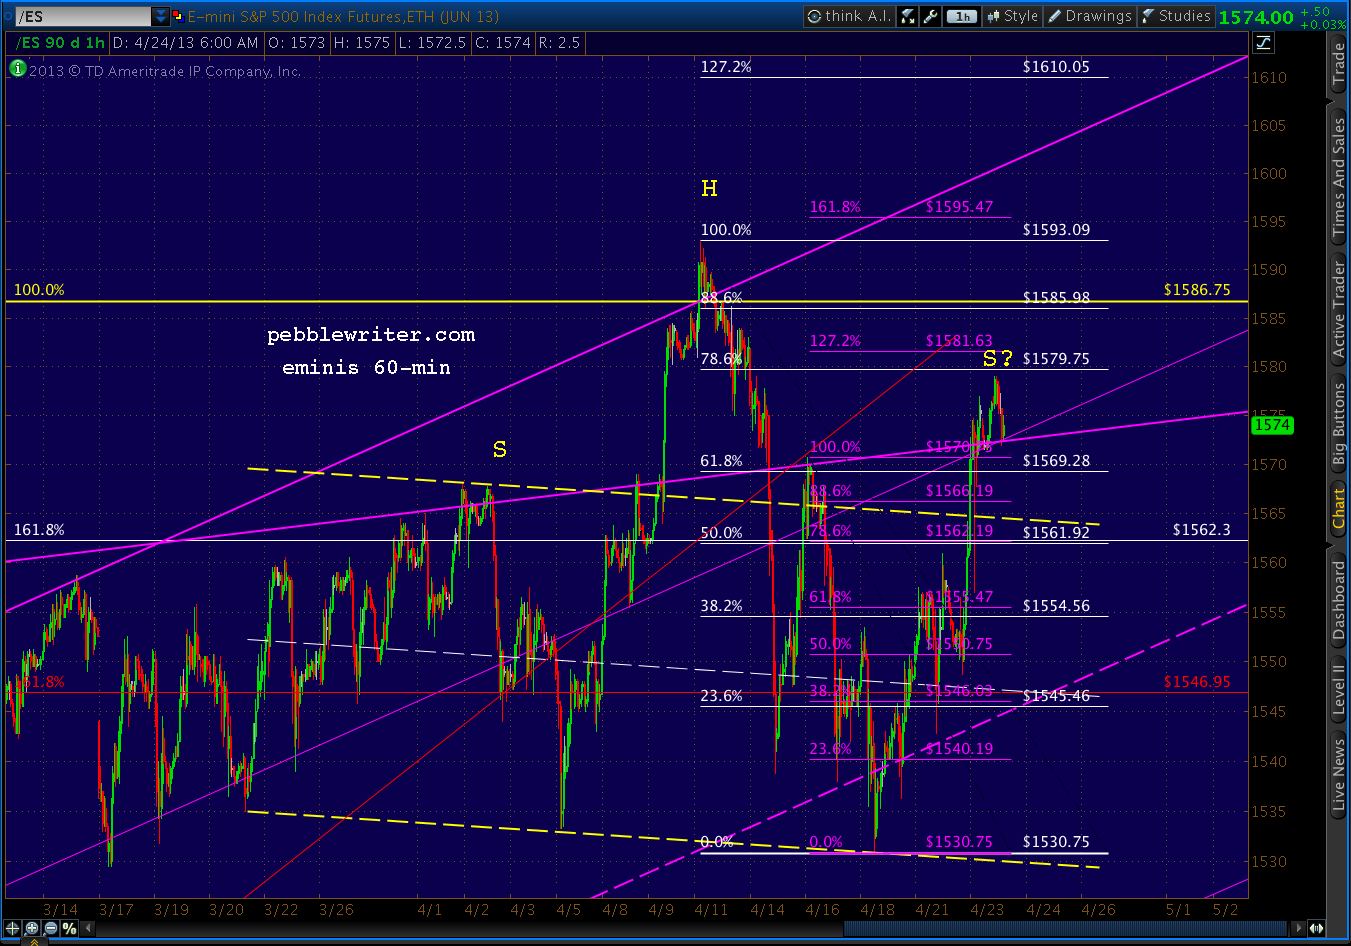
    The e-minis tacked on a few points overnight — almost reaching the .786, only to give them all back with this morning’s underwhelming Durable Goods report.  The H&S Pattern that was looking pretty good at yesterday’s open is now looking a little ragged, with a right shoulder that’s already 15 points higher than the left.

    UPDATE:  9:45 AM

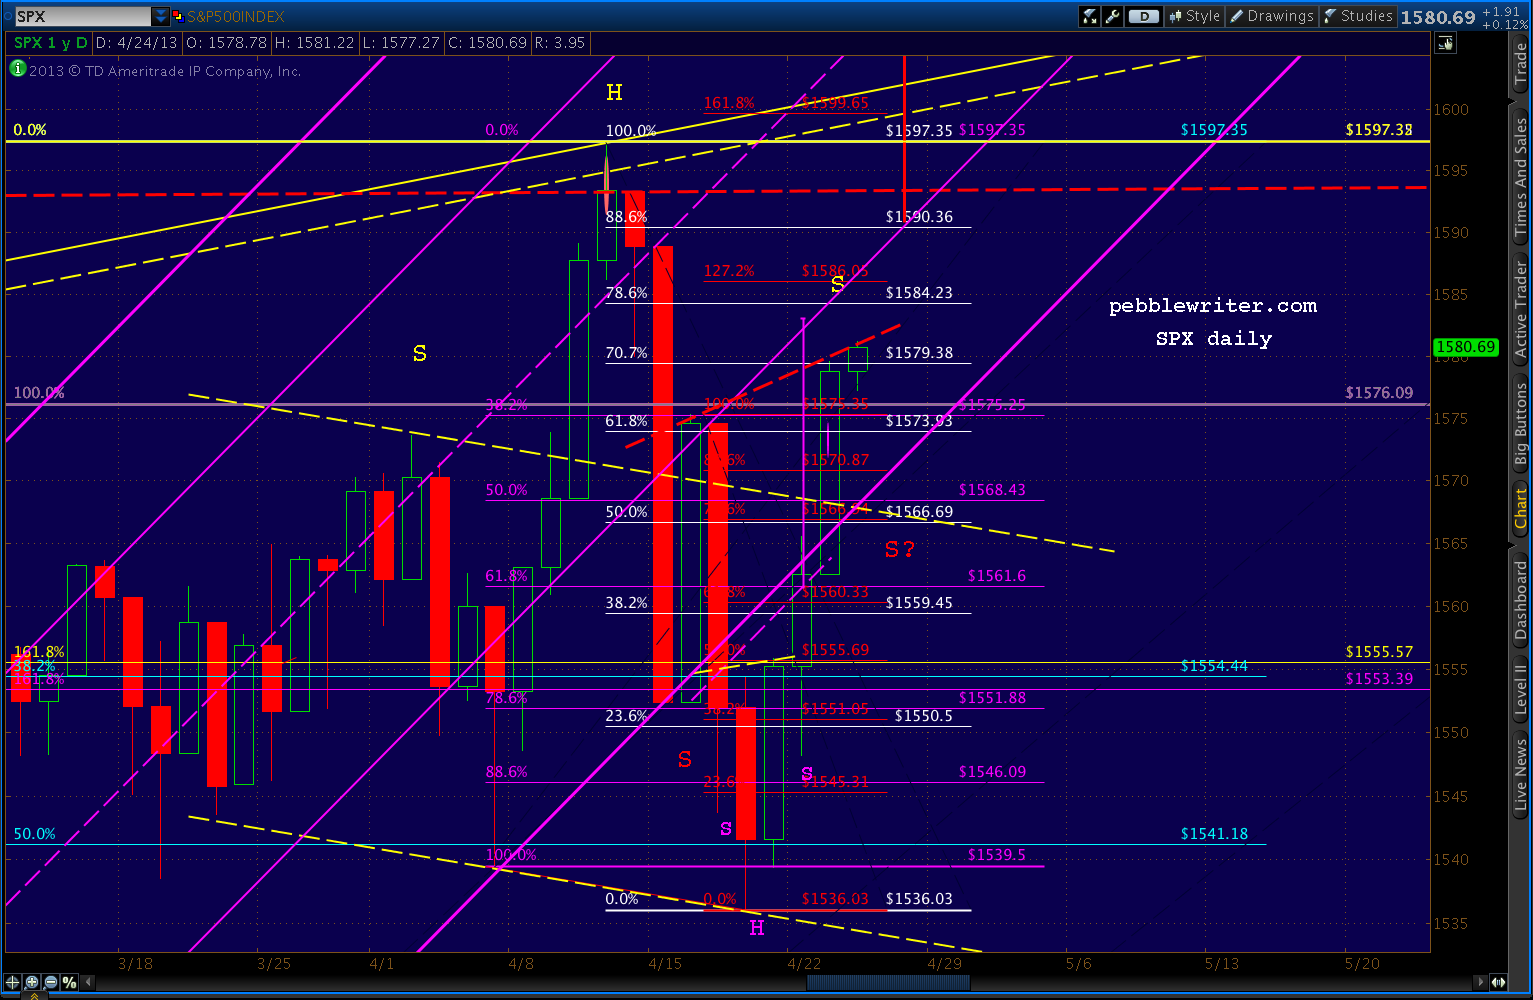
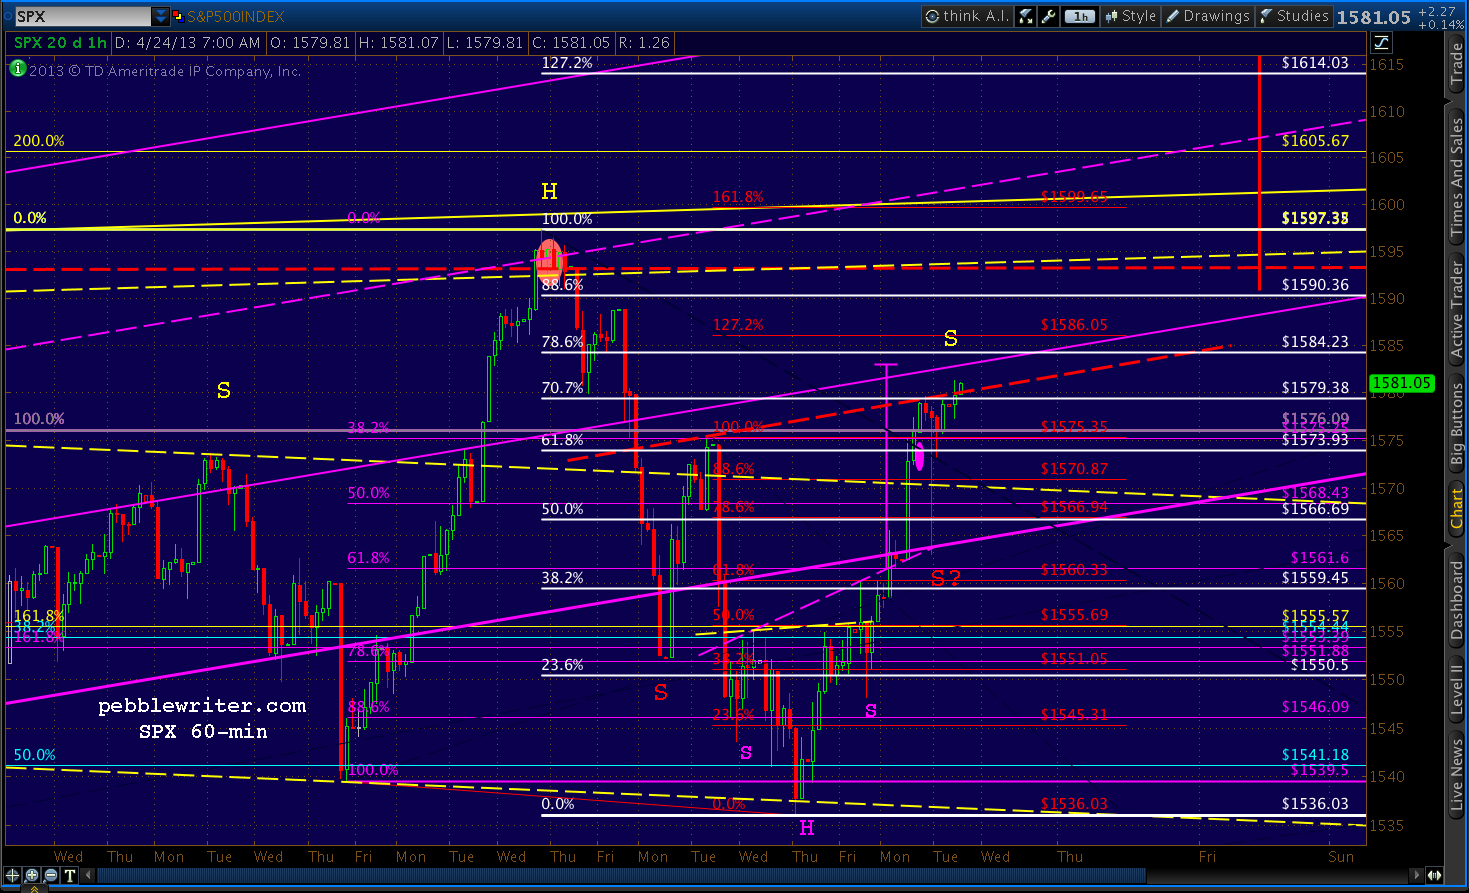
    SPX continues trudging toward the .786 retracement (1584.23) of its decline from 1597 to 1536.

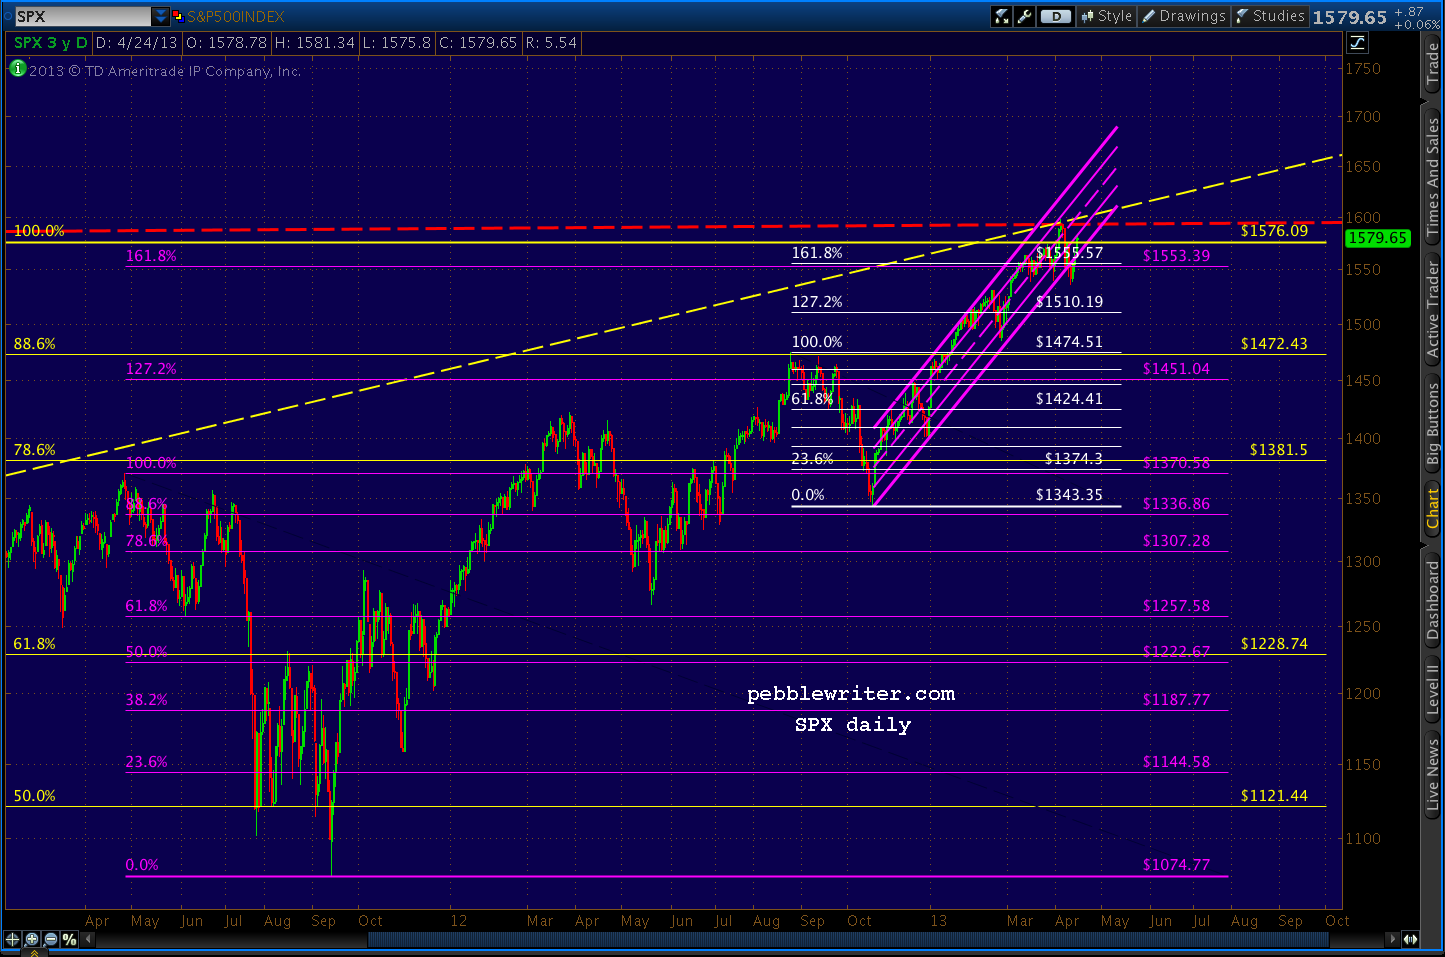
    After plunging beneath the channel that’s guided it from 1343 to 1597 on Apr 17, SPX rallied and re-joined the channel yesterday.  This was a very bullish development, as long as SPX remained in the channel all the way to the closing bell.

    Despite a five minute thrill ride from 1578 to 1563 (the channel bottom) and back, SPX managed to regain and hold the 2007 high of 1576.09 into the close.

    It now sits perched on the neckline of an Inverted H&S Pattern which has either completed or not, depending on whether a 5-minute plunge qualifies as a shoulder.  Short answer — I have no clue.

    Here’s what we do know:

    1. Prior to Apr 17, SPX had been locked into that purple channel below since 1343 on Nov 16 — an 18.9% gain in five months
    2. SPX barely paused when it completed two big Crab Patterns — the 1.618 extensions of the 1370-1074 decline and the 1474-1343 decline (purple and white below)
    3. Instead, SPX exceeded the Oct 2007 high of 1576.09 (yellow)
    4. SPX reversed at 1597.35, almost precisely at a trend line drawn between the 2000 and 2007 highs
    5. SPX fell 3.8%, making a lower low, dropping out of the channel mentioned above and suggesting a H&S pattern that targets 1474 — the Sep 2012 high (white pattern)
    6. It roared back into the channel, retracing almost 78.6% of its drop
    7. In the process, it topped the 1576.09 high and the 1553 and 1555 Fib levels and almost reaching the 1583 target of an IH&S Pattern
    8. Depending on your interpretation, it might also have completed an IH&S that targets 1621.

    What Does It All Mean?

    When I forecast markets, I look for lines in the sand.  I try to determine price levels that, if crossed, would signal a change in trend.  When that trend switches from bullish to bearish, I want to be short.  When it switches from bearish to bullish, I want to be long.

    A channel is one such method that features boundaries rather than absolute price levels.
    As long as prices remain in a rising (or falling) channel, we can expect prices to continue to rise (or fall.)  It’s rather simplistic, but it usually works.  We can make educated guesses as to future price targets based on where the channels point.

    Of course, even well-formed channels (multiple tags on the top and bottom and over a sufficient time period) can’t go on forever.  I look for moments when prices have to choose whether to remain in or leave the channel.  A tag of a top or bottom bound or midline usually create opportunities, though other lines can as well.

    The Real World

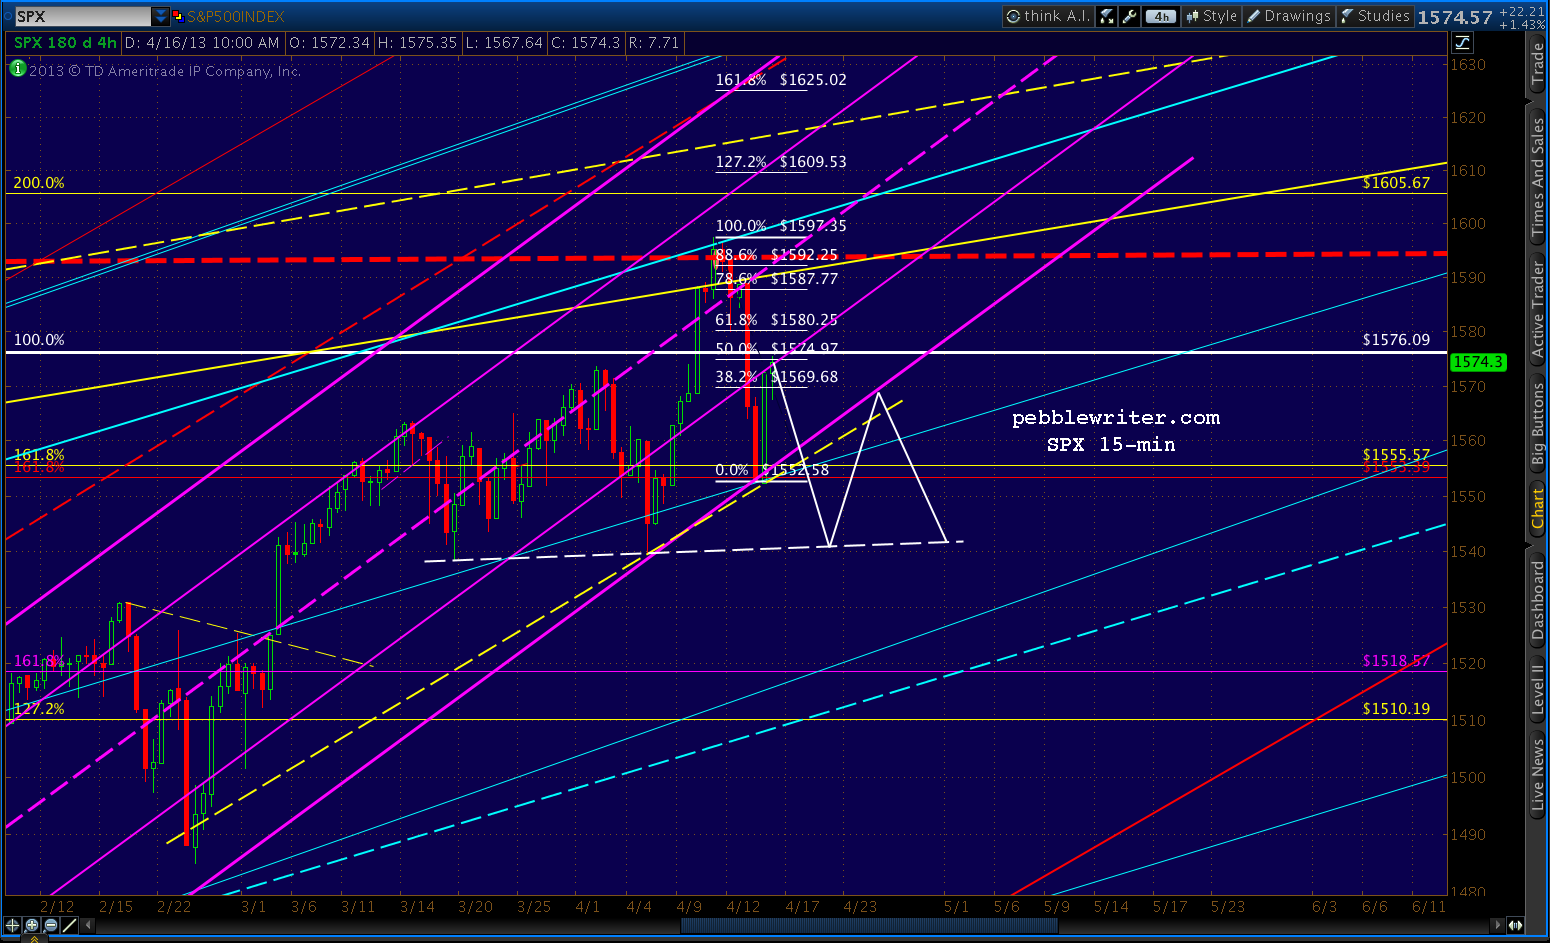
    Recall that we shorted SPX at the 1597 high on the 11th [see: Big Picture], riding down to the channel bottom where I went long at 1554, expecting at least a bounce.  We got one on the 16th with SPX rallying up to 1575 — the channel .25 line.

    We closed our long position, going short the following morning for the trip back to the channel bottom at 1555.  We tried another long position there, but were quickly stopped out as the channel was broken — signalling a bearish trend change.

    So, we shorted again, playing quite a few bounces down to 1540 where we eventually went long in anticipation of establishing a H&S Pattern neckline [see: Dollar Daze.]

    At that point, I expected a back-test of the broken channel.  We got it, reaching 1565 on the 22nd but closing beneath the channel’s lower bound.  Note that this move completed 5/6 of a H&S, but the right shoulder was underdeveloped relative to the left.

    Anticipating an intra-day retracement to 1567 (the .500 Fib) or 1574 (the .618) the next day (yesterday), I stayed long — trying without much success to anticipate the top.  Since SPX topped the .618, the next up on the chart is today’s target: the .786 at 1584.23.

    Going Forward

    With all that as preamble, here’s what I expect going forward.

    continued for members(more…)

  • Charts I’m Watching: Apr 22, 2013

    Looks like we’re getting some follow-through this morning on Friday’s technical rally.  But, this doesn’t appear to be one worth chasing unless it can push up strongly through 1560.

    I’ll play along on the opening with an interim long position, with tight stops for the fizzle that could come quite quickly.  If 1560 is exceeded, look for 1573 or so.

    The dollar pushed above the TL from the prior highs as well as its .618 Fib of the Apr 4 high.  This bodes well for a run to at least the purple midline — probably at the .786 or .886 (83.258 or 83.446.)

    UPDATE:  9:35 AM

    There’s 1560.10, I’ll close the interim long here and revert to full short unless SPX can push higher.

    UPDATE:  9:39 AM

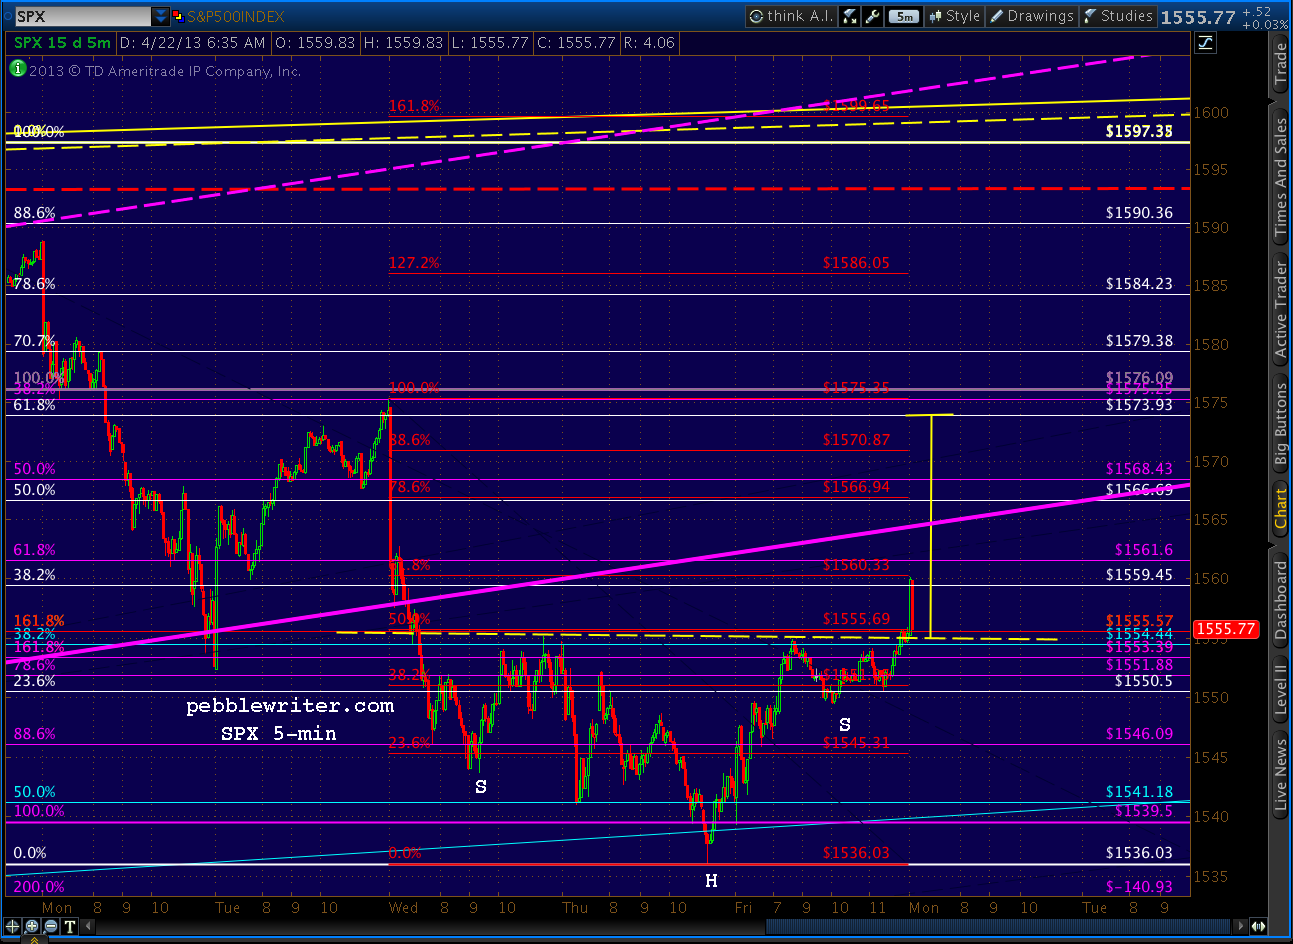
    Got a pullback to the neckline of the small https://pebblewriter.com/inverted-head-shoulders-pattern/ (in yellow, below) completed on the opening.

    I’ll try another interim long position here at 1554, with very tight stops (1553ish) in the event SPX pushes down through the neckline.

    The IH&S targets 1574 — which is also roughly the .618 retracement of the 1597-1536 decline.

    UPDATE:  9:50 AM

    I’m going to allow a little more wiggle room on the stop, as this setup is too good for the bulls to waste.  Hanging in there for 1574.

    UPDATE:  10:00 AM

    The existing home sales won’t make it any easier for more upside, here.

    Pulling the plug on the interim long unless it can push back up through 1555.

    As we discussed Friday, the right shoulder formed thus far is sufficient for the H&S Pattern proposed on Apr 16 to play out.  All we need now is a drop back to 1535 or so.

    But, getting SPX up to 1474 would be a coup for the bulls.  At that point, it would have formed 2/3 of another larger IH&S that targets 1610.  So, don’t expect them to give up this seemingly insignificant pattern easily.

    UPDATE:  11:55 AM

    SPX just shot through 1555 on weak technicals.  I’ll add an interim long position, but wouldn’t get excited about this move just yet.

    It’s questionable whether can push through 1558.74 — the .886 of this morning’s decline.  I’d have to classify it as corrective unless it can break out of the falling white channel.

    UPDATE:  12:15 PM

    Just reached 1558.53, pushed above the channel upper bound for about 3 1/2 seconds, and retreated.  I’ll hold on to the long, but raise stops to 1556ish.  The bulls really need a breakout here.

    *   *   *

    A quick shout-out to John Lounsbury, Managing Editor over at Global Economic Intersection.  He’s celebrating three years of fine reporting on economics and market analysis.  He’s a darn smart guy and fine writer in his own right, but also features some terrific guest writers on a regular basis (they’ve even been known to post occasional pebblewriter.com stuff when they’re desperate.)  Check it out HERE.

    * * *

    UPDATE:  12:40 PM

    SPX just burst through our channel line mentioned above.  This puts the red .786 at 1566.94 on the table — a Gartley Pattern.  Note that this is also roughly the level of the .500 retracement of the 1597 – 1536 decline.

    Assuming SPX will push through 1560 this time (the RSI chart below suggests it will) we’ll look for signs of weakness between 1567 – 1574.

    UPDATE:  2:35 PM

    SPX making nice headway toward our interim target range of 1567-1574.  I’ve had a chance to fine tune some of the charts; and, this move is shaping up pretty much as expected.

    Recall that we shorted at 1597 back on Apr 11, and held went long again at 1541 last Thursday.  SPX is coming up on the .500 retracement (in white, below) of that decline, which is a common enough corrective wave move.

    Note also that the red .786 and light blue 1.618 are very close to that same price level.  While the coincident Fib levels concur on the importance of 1566-1567, it’s the chart patterns that will likely determine the next 100-point move.

    continued for members(more…)

  • The Storm Before the Calm

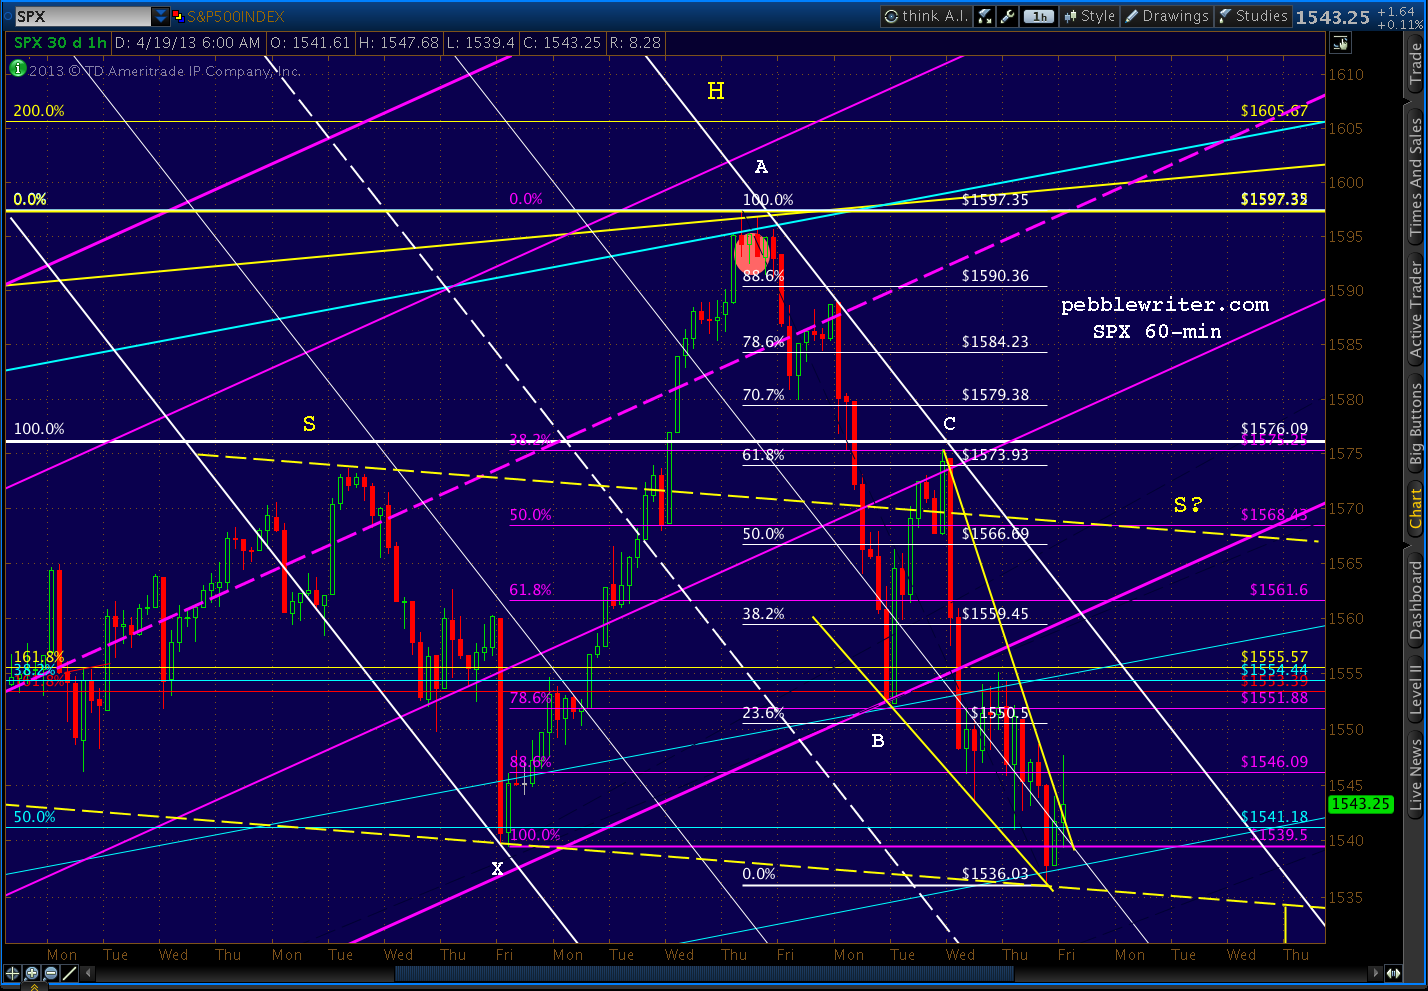
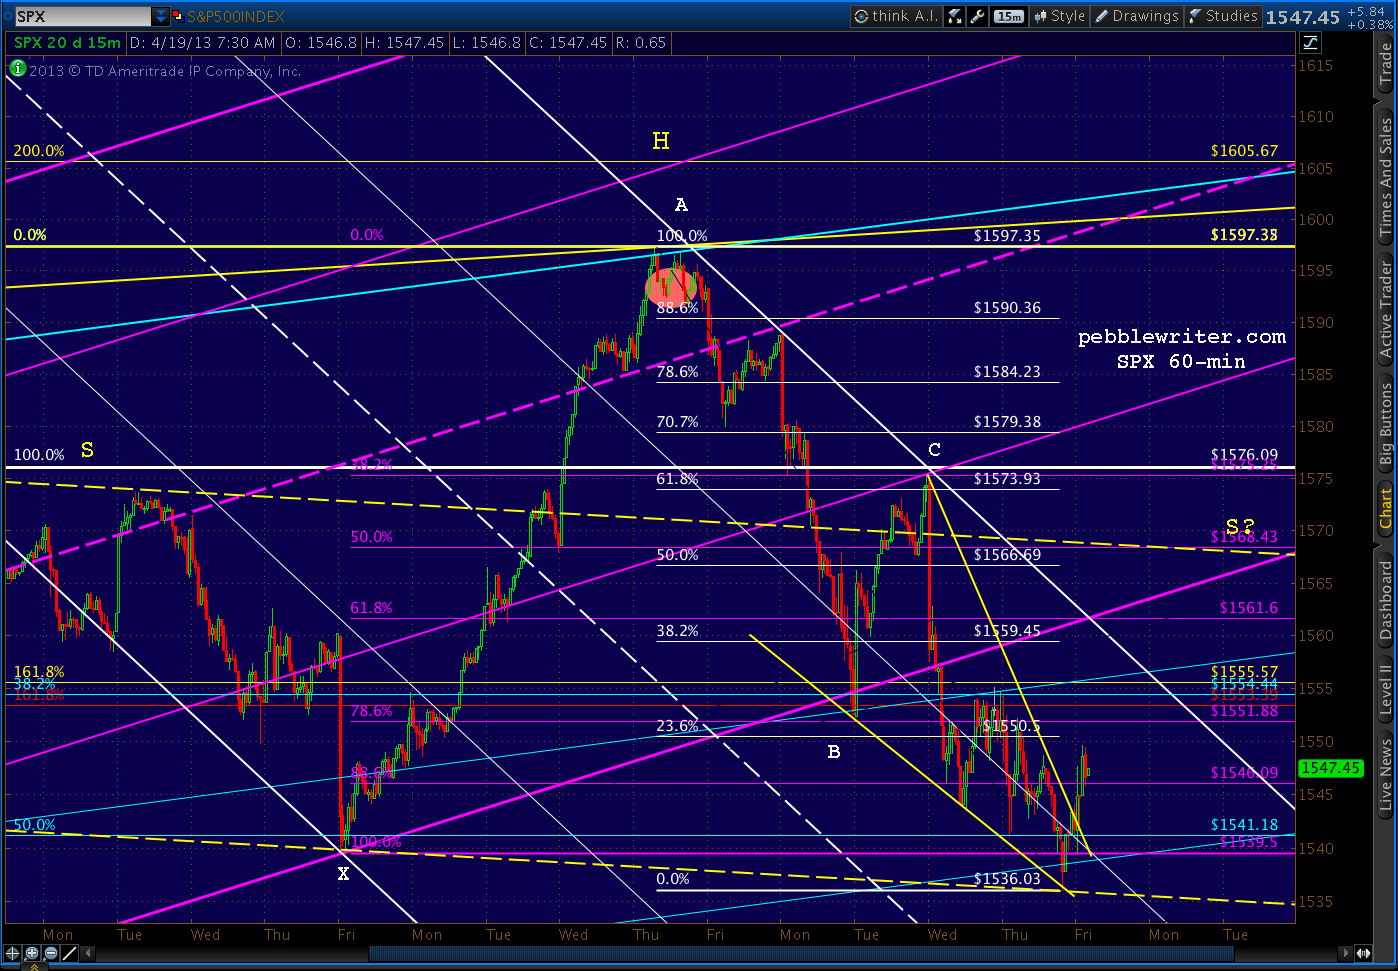
    I’ve been quite bearish since going short on April 11 at 1597 [Big Picture: 11:30 update.]  Yesterday, though, SPX reached our initial downside target of 1540 and, as expected, paused.

    As we’ve discussed, this was an important points for bulls to take a stand.  It was also the ideal spot from which to launch the right shoulder of a Head & Shoulders Pattern as I posted on the 16th.


    So, we closed our short position late yesterday [Dollar Daze: 3:45 update in members section] and played “catch the falling knife” with a long position at 1541. This morning, we’re being rewarded with a nice bounce that should have legs.

    Whether it will form the right shoulder we’ve been expecting, or resume its QE-fueled race to the moon is open to debate.  But, for now, the trend is higher.

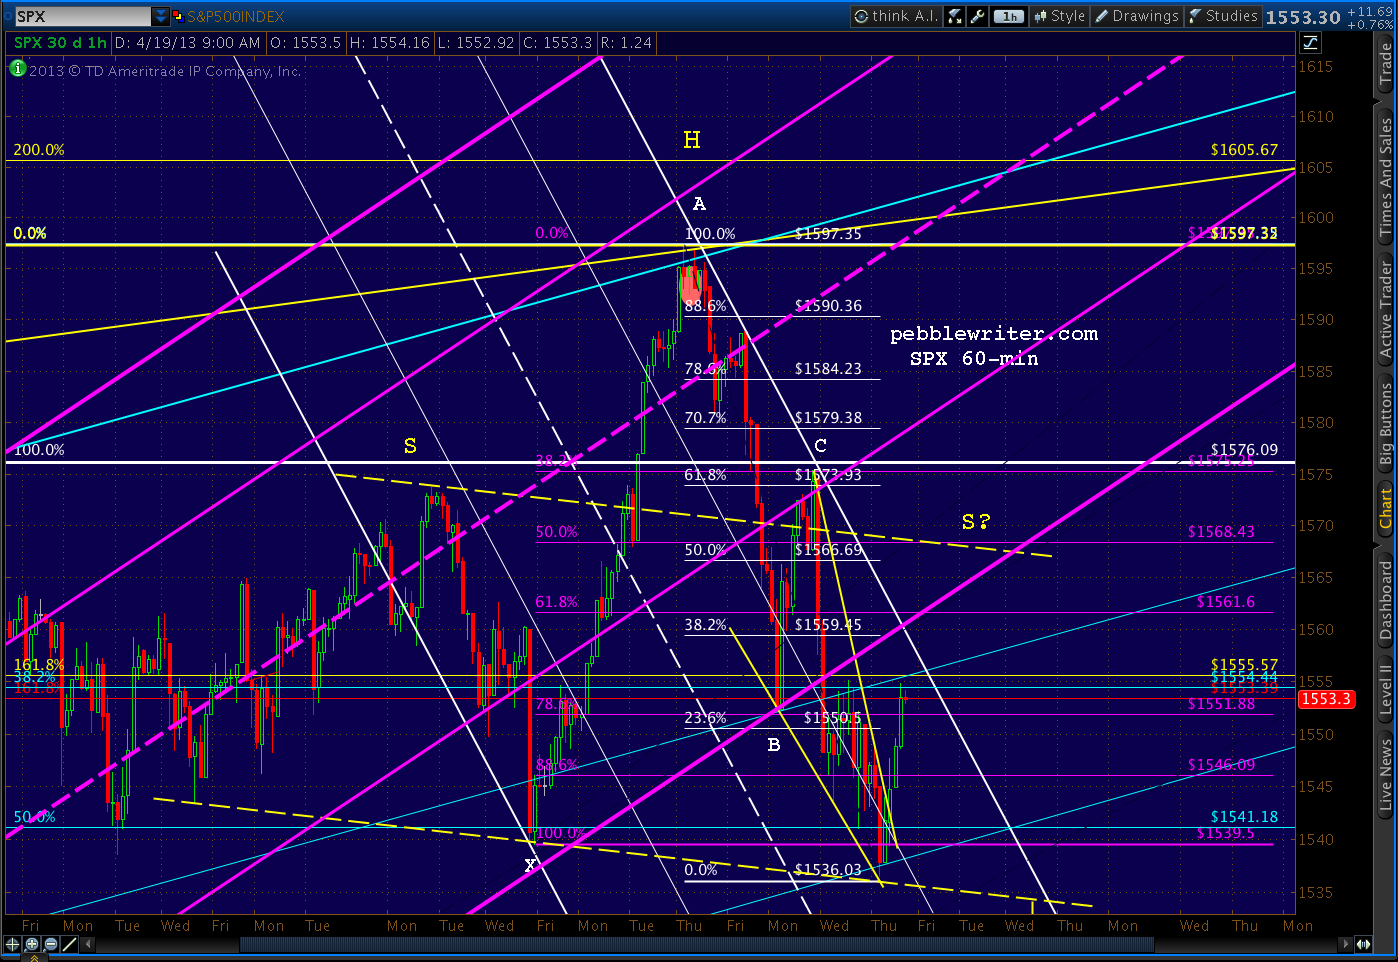
    Note that SPX formed a nice little falling wedge (in yellow above) that, if it plays out, supports the idea of a return to the idealized right shoulder height represented by the dashed yellow TL.

    The falling white channel I’ve slapped on the chart, as regular readers know, probably won’t last.  It’s rare for the initial slope of a decline to be maintained through the series of rallies and sell-offs that comprise a major move.  But, it’s a good initial fit, so it will do for now.

    UPDATE:  10:30 AM

    The ideal right shoulder in a H&S Pattern is the same height as the left.  But, it needn’t be in order for the pattern to play out.  The high so far for the day is 1549.63, which represents a 14 point bounce off the neckline — compared to the left shoulder’s 33 points.

    UPDATE:  12:15 PM

    SPX has reached the important Fib levels of 1553 and 1555 (the Crab Patterns from 1370-1074 and 1474-1343.)  This would be a natural place for prices to reverse, so I’ll close my long position here at 1554 and go short.

    This constitutes a 20-pt rise off the neckline, so it’s technically enough of a right shoulder for the pattern to play out.  And, the bears could really use a H&S Pattern completion to keep the downward momentum going.

    A good reversal here – or, at least by 1574 – and we can write off the 1576-1597 rally as a prank, a juvenile burst of irrational exuberance.

    Bulls, on the other hand, would greatly benefit from a push through the Fib lines that they completely dissed the first time around.  And, they should have mattered.  Take a look at yesterday’s Dollar Daze for a discussion of how the dollar confirmed the sell signal that a few good overnight ramp jobs were able to beat.

    There are other logical turning points as well.  This could quite likely be a short term trade to score a quick 10 points or so — unless 1535 is taken out and the H&S completes.

    Choices, choices.  We’ll take a look at different scenarios below.

    continued for members(more…)

  • Anatomy of a Top: 2000

    The 2000 top shows just how “messy” tops can be.  Here’s the finished picture in perfect hind-sight.  It’s a very crowded chart, but every single pattern had a say in how the top unfolded.

    SPX had zoomed from 442 to 1478 in about 5 years, a not-too-shabby 234% gain for an annually compounded 27%.

    Once SPX broke out of the falling purple channel, it had “permission” to pursue several harmonic patterns in the works.  SPX shot up 66 points in that one day — blowing through every Fib level between .618 and 1.000.

    It finally came to rest at 1458, completing a Bat Pattern at the purple .886.  But, the small white 1.272 was just above at 1477, as was the rising purple channel midline and the 1.272 from a much larger pattern seen below.  An IH&S target waited at 1497 – tantalizingly close to a nice round number of 1500.  And, the all-time high of 1478 from two months earlier beckoned.

    SPX got up to 1477.33 before reacting, falling to 1466 over the next two days.  Close, but not quite.  Someone watching closely might have noticed the Flag Pattern it constructed, targeting 1562.  Someone else probably pointed out the biggest Crab Pattern target of all — the 1.618 extension of the 13% correction from 1420 to 1233 from Jul-Oct 1999.

    On Mar 21, 2000 SPX shot up through the channel midline, the cluster of Fibs around 1477 and, importantly, the 1478 high and raced up toward those higher targets.

    On Mar 24, it reached 1552.87, which cleared the IH&S target at 1497, the purple 1.272 at 1519 and the last remaining Crab Pattern at 1535.  What ultimately stopped it?  The .75 line from the big purple channel dating back to Jul 1999 — almost to the penny.

    Total move: 17% and 227 points in 20 sessions.  Can it happen again?  Stay tuned.

  • RUT: End of the Line?

    RUT has reached the upper bound of a well-defined channel that dates back to 1998.

    It could leak slightly higher in reaching for the top of the large rising wedge and some key Fib levels, but I suspect RUT has reached a turning point.

    continued for members(more…)

  • AAPL: Breaking Out?

    AAPL has bounced nearly 50 points since its Jan 25 low, leading many to wonder whether the worst is over.  When I started this post about a week ago, all the talking heads were talking “breakout.”  We’ll give the old crystal ball a polish and see whether that’s likely.

    When I posted that AAPL seemed to finding support back on the 24th, it was because of the long-term channel (in purple, below) that’s guided its upside since the year 2000 [see: That All You Got?] The top of it, by the way, is up around 1775.

    AAPL bottomed the next day at 435 (one point from our Nov 27 forecast), and obviously still hasn’t broken that channel.  The channel top, by the way, is currently up around 1880. [note: these long term charts are as of Feb 6.]

    As we’ve noted before, there are other long-term channels at play, too.  Note the white channel casts a rather bearish pall, while the yellow channel promises at least a bounce here.  So, which to believe?


    GETTING HERE

    We’ve been very fortunate in forecasting AAPL over the past several months, calling several significant tops and bottoms with decent accuracy.

    Nov 8:  Harmonics Are Your Friend:  

    It looked like AAPL was about to bottom out, followed by a sizable bounce.

    “AAPL should get a brief bump higher as SPX does — perhaps to 600 or 620.  Of course, if it stalls there, it will have formed 5/6 of a huge H&S pattern… “

    It bottomed 6 sessions later when the S&P 500 dropped down to tag our 1344 target  [see: Charts I’m Watching Nov 15.]  From there, we were looking for a bounce to 600.

    Nov 27: Update on AAPL:

    As AAPL approached our 600 target, I anticipated a reversal and completion of a Head & Shoulder Pattern that would bounce first at the neckline before plunging below.

    “A reversal here could quite likely spell a return to the channel bottom — which will be around 434…

    …it’s easy to imagine a scenario where prices drop to [the neckline at] 500 into the end of the year, but can’t quite seal the deal on the H&S pattern…

    If, on the other hand, AAPL breaks down below [the neckline], look for a back test followed by a more serious plunge.”

    AAPL topped out two sessions later at 594 and plunged to the neckline at 501 where it failed to “seal the deal,”  bouncing for two weeks before finally falling below the neckline on Jan 15.

    It back-tested the neckline for a week before taking a “more serious plunge” down to 435, one point from our original Nov 27 target.

    GOING FORWARD

    The purple channel has done its job so far.  The big question is whether it can continue to stave off the damage of the completed Head & Shoulder Pattern.  H&S Patterns commonly back test their necklines.  Back tests can even exceed the neckline, as has AAPL’s in several cases.

    As we’ve discussed many times, AAPL has been in a fairly tight price channel all the way down from 705 (below, in white.)

    The upper bound of this channel intersects with the H&S neckline at about 498-500 around Feb 19 (there is some wiggle room, depending on exactly how the channel is drawn.)  This likely represents the extent of any short-term upside.

    As for the downside, the white channel midline intersects with the purple channel at about 450-452 around Feb 20.  The white upper bound intersects with the purple channel bottom  465 on Mar 18.

    But, note the large red falling channel.  It’s dicey to consider it well-established, since the “top” consists of only one tag.  But, it looks to me like it has potential over the medium-term.  Today, AAPL is testing its 25% line; and, a close above 473 or so would be positive — arguing for the more bullish of the two scenarios above.

    The daily RSI recently poked up through the white midline and the yellow 75% line, but appears to be backtesting both.  This would be consistent with a dip to 450, where AAPL could back-test the white price channel midline and the purple channel bottom (the purple circle).

    From there, the top of the yellow RSI channel beckons — which probably corresponds with a return to test the neckline around 500.  As noted above, this could occur as soon as Feb 19 if prices are to remain in the white channel.

    And, what if prices break out of the white channel?  Keep an eye on the RSI.  A break above the neckline would probably require a break out from the yellow RSI channel.  While, remaining in the yellow channel probably means a period of consolidation until early May, when the purple channel and neckline intersect at about 490.

    One other issue often discussed is the expiration of the 30-day wash sale period.  The biggest volume spikes in the past few months were the plunges of Nov 16, Dec 6, Dec 14 and Jan 24-25.  So, the only remaining relevant buyers who might rush back in are those who sold in the 435-465 range on Jan 24-25.

    Since the stock has gained a few points since then, these sellers might be expected to believe the worst is over and that it’s safe to re-enter at these levels — especially since the rest of the market is setting new highs.

    SUMMARY

    My best guess at this point is a test of the purple channel bottom around 450-455.  If it bounces, it has potential to the white channel top around 495.

    But, it’s important to note that AAPL just closed a huge gap.

    60-min RSI shows support coming up from a channel midline (white) as well as a rising channel bottom (purple.)

    If the channel bottom breaks down, the H&S target is way down around 304 — only a short hop from the yellow .618 at 317 and the white .786 at 307.

    GLTA.

  • Charts I’m Watching: Feb 4, 2013

    The US dollar bounced off the .886 of its Sep – Nov 2012 run…again.  This is the fourth time it has found support in the 78.725 – 79 range, though each subsequent bounce has been lower than the previous one.

    The result is a descending triangle that arrives at the bottom of an uptrend (the white channel below) and a 2nd back-test of the latest channel (red) that was originally broken out of on Jan 2.

    The primary driver has been euro zone weakness, with the EURUSD back-testing the midline of the white channel after a bull run that equaled that of this past Aug-Sep.

    Though, the yen is also pitching in — reaching our secondary price target well in advance of the forecasted date range.

    SPX was off over 10 points this morning, making our decision to short Friday at 1514 appear to have been the right move.  SPX is heading toward the next lower purple channel line, where it will likely get at least a bounce in the 1500-1501 range or the .886 Fib at 1498.77.

    The question is whether the market is just taking a breather or beginning something more significant.  I’ll spend the next hour or so examining the road ahead.

    continued for members(more…)

  • Trading with Harmonics

    The first of a two-part article on harmonics trading strategies.

    Part 1.  January 28, 2013

    Harmonics are a great source of information about the market, but they don’t tell you how or when to trade any more than do MACD crosses or breadth indicators.  So, how do you use them?  This discussion of the basic process might serve as a good starting place for beginners.

    I consider harmonics like trade alerts.  That is, every time we approach an important Fib level, I stop and consider whether the market is likely to react or not, then make a trade decision accordingly.

    There are pages for each specific pattern under the Learn>Harmonics tag on the Home Page.  But, they all relate to one another.  Let’s walk through a real world example.

    SPX has fallen from 1576 to 666 and seems to have bottomed (how to know it’s bottomed is the real trick.)  I draw a Fibonacci Retracement grid on the price range (100% for 1576, 0% for 666) and make sure every important level is showing as on the chart below.  For a discussion of Fibonacci levels, click here.


    ThinkorSwim makes this very easy with a built-in drawing tool, as do many other platforms.  If your platform doesn’t provide it, you might want to think about changing, or at least opening up a TOS account to facilitate your charting (and, no, they don’t pay me to say that.)  You can read about harmonics and study the charts I post, but there’s no substitute for doing your own charting.

    Back to our example: because we went long at the very bottom, we set our sights on the higher Fib levels.   All harmonic patterns are marked using the letters X, A, B, C and D.The inception point (high) is X, the low is A.  B is the first reversal, C is the next, and D is the completion. The location of the reversals relative to specific Fib levels tells us what kind of pattern we probably have.

    Suppose we’ve watched SPX climb all the way up to 956, where there’s a 9% correction down to 869.  Because this reversal occurred below the .618 Fib level, we might have a Bat Pattern on our hands.  Bat Patterns complete at the .886 (1472) so we’ll make a note of that for future purposes and consider 956 a potential Point B.

    We sail right through the .382 and .500 levels, then experience another 9% correction at just above the .500 (1150 to 1044.)  Again, it’s below .618, so it could be signalling a Bat Pattern.  But, it’s a relatively minor reaction, so we treat it as only a potential Point B.

    Now we’re approaching the .618 at 1228.74 — the most important of the Fib levels.  Because the two prior reversals were pretty tame, we might suspect more from this one. We begin to contemplate a short position, and look for other signs of a reversal.

    Because we’ve been watching closely, we notice a smaller Crab Pattern setting up as we approach the .618 (the purple pattern below.)  It features a Point D at 1215.93 — slightly below our .618 at 1228.74.  So, we feel pretty confident about this being a good trade entry.

    Are there other chart patterns such as a rising wedge, channel, fan line, etc. that also hint at a reversal?  In fact, there’s a nice channel that’s formed over the past 9 months, not to mention a broken RSI channel (in red) just shy of the Crab completion.  And, we’re nearing the 1240 target of the Inverted Head & Shoulders pattern completed at the 2009 bottom.

    These would all be good reasons to consider a short.  Taken together, they make for a pretty compelling argument.  Where, though?  Other traders are watching the same charts we are, so there’s a chance the reversal will come a little early.  We don’t wait to wait too long and miss the top.  But, of course, every point too early is a point of lost profit.

    In the end, timing is a judgement call based on many factors, including liquidity, risk tolerance, the type of instruments we’re trading, other positions in the portfolio, etc. and is worthy of its own article.

    Let’s assume we make the decision to open a short position around 1213 on the April 15 — in case SPX doesn’t make it all the way to 1215 or 1228.  We feel pretty good about our decision when SPX is down to 1186 the following day and 1183 the next.  That’s a 2.5% move in two days — not bad.

    On the third day, however, our plan is looking iffy.  SPX gaps up on the open and hits 1208.  Three days later, it pops above the Crab target of 1215.93 and tags 1217, seemingly in search of the .618 at 1228.74.

    Suddenly, we’re underwater by 15 points or 1.25%.  Is it time to bail?  Again, it depends on the type of investor you are.  Options traders might have closed their puts for large profits already, while swing traders might be happy as long as SPX doesn’t exceed 1230-1235.  Buy and hold types might have used the Fib level as a warning of a potential downturn and hedged or lightened up on their long positions.

    Checking our charts, we can see that neither the price nor the RSI channels have been broken to the upside.  In fact, the little red RSI channel which helped convince us of the downside potential shows the latest push higher came with a lower RSI score (negative divergence) and a pretty pathetic back test.  So, we’re inclined to hang in there.

    It turns out to be a great decision.  The following day, RSI plunges through the midline of the purple channel.  SPX plunges 38 points from its high, stabilizes for four days, then really starts falling apart.  On May 4, SPX reaches the white channel midline, a possible bounce spot.  We’ve already made 4.5% since shorting at 1213 less than 3 weeks ago.  Time to bolt?

    To be continued…