Where there was once a falling wedge, there is now a channel. The April 10 breakout that looked so promising completed a Bat pattern and promptly reversed nearly 61.8% of the move from the 13.66 bottom. Is this the end of the ride, or are there bigger and better things in store for VIX?
 I have tentatively added another channel to the RSI to accommodate the latest spike. It would likely guide the next leg down, if indeed that’s forthcoming — which I mostly doubt.
 Of course, every time we complete a Bat pattern with a Point D at the .886, we’re also establishing a potential Point B in a larger Crab pattern. In this case, that would result in a completion Point D at the 1.618, which is 27.12.
That’s an interesting price, because it equates with the 2.618 of the small Butterfly pattern potentially setting up on the hourly chart.
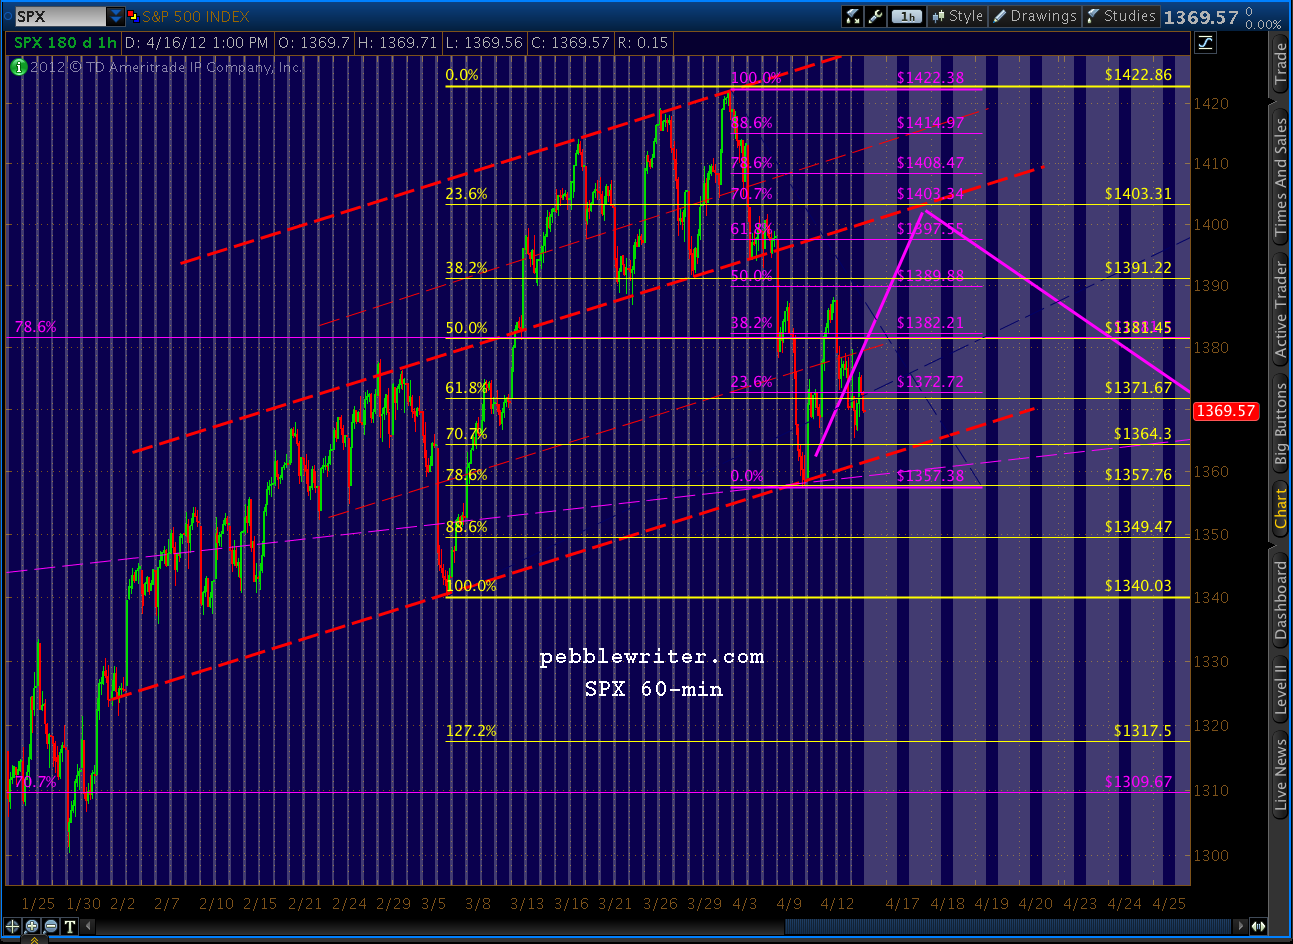
 Things get real interesting when you back out and look for competing or complimentary patterns. On the 60-min chart, we can see that the move off the bottom conforms to a upward-sloping channel (in white) so far. This channel will intersect with the downward sloping main channel (yellow) on Friday — which, of course, is OPEX.
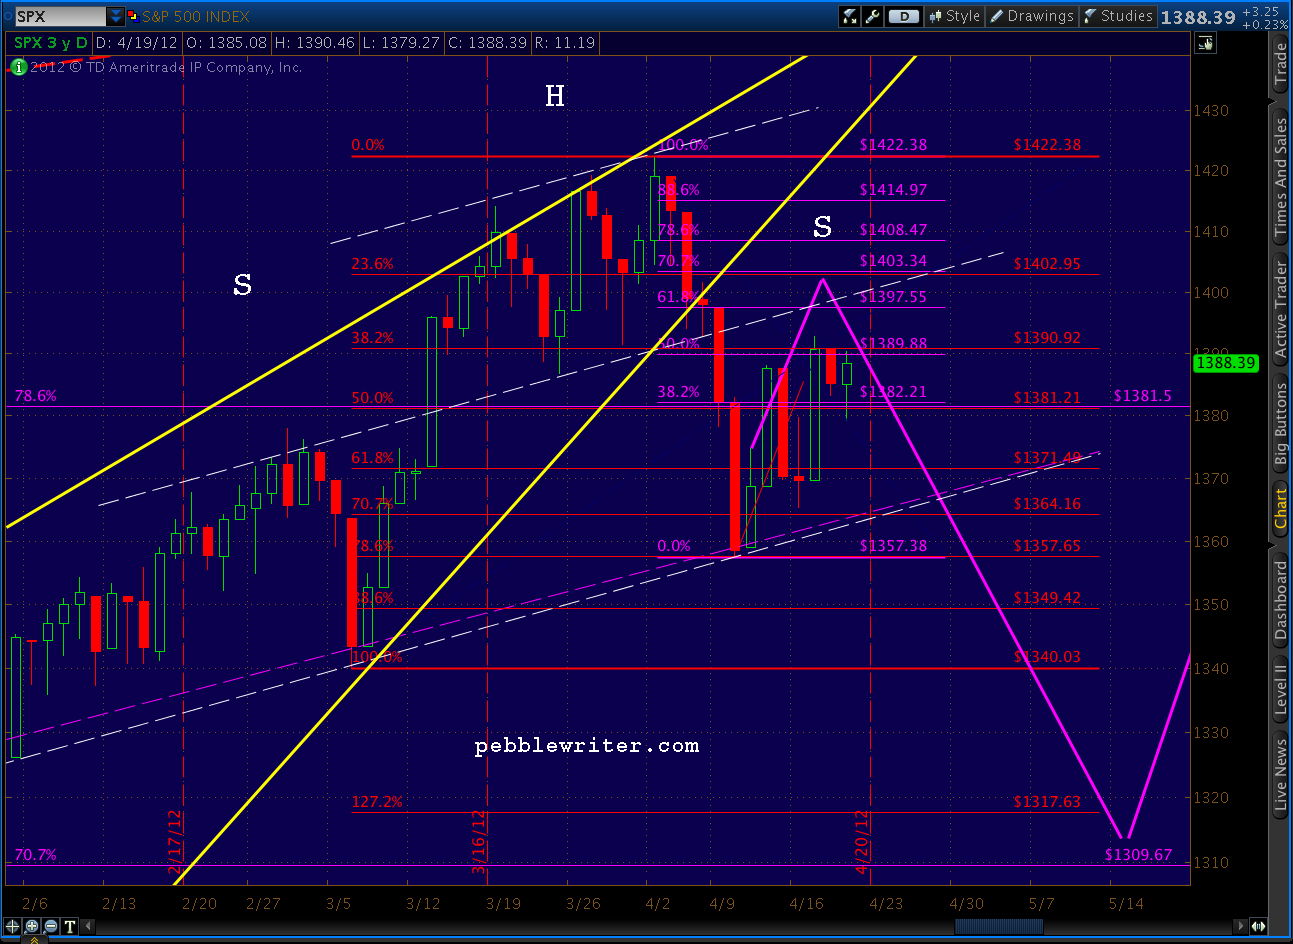
 It’s only fitting that the point at which VIX must commit to one channel or the other arrives on OPEX. The situation reflects the alternatives we’ve been discussing for SPX. The analog we’ve been watching indicates a short-term top is at hand, and we should see a brief but scary sell-off in the next few days. This would correlate with sideways action in VIX, followed by a breakout of the yellow channel to follow the white one — probably topping out at the 27.13 level at the bottom of SPX’s decline to around 1305-1317.
The alternate SPX view is that we go on up and tag the rising wedge’s apex without the sell-off first. There’s certainly enough important news in the pipeline over the next few days to bring either course to fruition. Such a movement in stocks would mean the white channel breaks down and the yellow one holds — knocking VIX back to the 14.5 — 15.8 range.
Of course, such a move would complete most of an inverse H&S pattern (in yellow) and set up the next upside break out. Technically, we have enough of a right shoulder as it is, but a drop to around 16 would be ideal.
In summary, my leading assumption is sideways until OPEX, then a breakout up to the 23-24 range to complete the IH&S that correlates with the SPX’s H&S move down. We should then see a back test of the yellow neckline and subsequent push to the 27-30ish range to correlate with SPX’s move to 1307-1317.
It would be a break of the yellow channel (which has a grand total of two anchor points on its upper bound) that would be similar to the Mar 16, 2011 breakout to 31.28 (see below.) But, such a move would bring it back the midline of the long-term channel that’s been such a magnet for breakouts over the past few years.
That midline, by the way, is in the same neighborhood as the Inverse Head & Shoulders target of 28.20, which would be very doable if SPX were to plunge 70-80 points over the next week.
 But, keep the alternatives in mind. The market is exceedingly hinky lately; and, as much as I like the analog, it’s certainly not guaranteed to play out. As always, please use stops.
Good luck to all.