SPX overshot our initial target by just a couple of points yesterday, reaching the channel 25% line at 1497.29 before getting the bounce I expected at 1499/1500. Note that SPX completed a Bat Pattern down to the .886 in the process (larger white pattern.)
The .618 Fib of the decline from 1530 is up ahead at 1518.09 — also the 1.618 of the 1422-1266 decline last summer (1518.57.) It intersects with the channel midline either later today or early Monday.
Daily RSI reached the white midline as we expected, and is currently backtesting the purple midline. It’s still too early to say whether the new falling channel I sketched in yesterday is legit or not.
The dollar is backtesting the channel line it broke through Wednesday after completing a Butterfly Pattern (the small white grid) to the 1.272, but the 1.618 awaits at the confluence of the purple 1.272 and red .618 up around 82.1-82.2 after the backtest is complete (not yet, I think.)
The big question: what happens after the backtests are complete?
As expected, equities have sold off since tagging the 1.618 Fib of the July 7 – Oct 4, 2011 sell off — dropping as low as 1522.19 this morning. While it’s gratifying to see a reversal at a major Fib like this, it won’t mean much until SPX can make some new lows. I’d be thrilled just to see the purple channel midline broken. I remain full short from 1530.50.
There’s great interest in the Fed minutes due out at 2 EST. Will the new FOMC composition affect the language re QE? How did they take last quarter’s GDP decline?
Housing starts and permits were released this morning. Overall, starts fell 8.5% since December. But, it was multifamily residential that was really responsible — declining 27% from Dec 2012 nationwide, an alarming 41% in the Northeast and 62% in the Midwest (versus 16% and 30% in last year’s Dec/Jan comparison.) The South and West regions rose modestly, as did permits.
The EURUSD has found support at the .886 (yellow pattern) of the Feb – July 2012 selloff. The rally fizzled several weeks ago at 1.3710 — just above the Feb highs — after initially reversing at the .786, hinting at a Butterfly Pattern objective of 1.3877. This is also the 2.618 of the white pattern and the .618 (1.3832) of the purple pattern (May 2011 to July 2012 decline.)
If the pair manages to hold the .886, it augers well for a move up to that target level. The next white channel level to intersect 1.3832 is the midline around March 18-20. The bottom of the white channel is currently around 1.3250.
The dollar, in the meantime, has retraced the losses sustained the past two days. In the process, it reached the midline of the white channel since Feb – so, we’ll be on the lookout for resistance.
Remember, DX RSI broke out of a daily channel (red, below) on Monday and back-tested it yesterday. It also successfully back-tested the midline of the rising purple channel and is poking up above the yellow 75% line — so, the upside case is clear.
What, then, would a dollar break-out mean for stocks?
Quick aside: just read the FOMC minutes from stem to stern (available here) and there’s nothing of any importance that I can tell. This is really no surprise, given that the last statement was virtually identical to the previous one. Here’s the discussion of the statement:
The media is reporting “increased concern” about the level of QE and inflation, but there is very little change in the outlook and the hawks are still vastly outnumbered by the doves. I suspect that as long as inflation stays under control, and the dollar remains in a trading range — meaning no new pressures or relief for importers/exporters — the FOMC will leave things pretty much as they are.
Getting back to the dollar and equities… It’s always interesting to compare the DX and SPX.
Stocks are a mirror image of the dollar through from 2010 through October 2011. At that point, however, they generally move in tandem — except that, as DX forms a pretty docile channel, SPX leaps out and forms a rather extended rising wedge.
DX has been locked in a trading range between the .382 and .618 of its decline into May 2011, while SPX has obviously blown through its May 2011 highs.
Since last September, the comparison is especially interesting. DX spent about 6 months bouncing between the .382 and .500 Fibs, while SPX retraced 127.2% of its 1474 to 1343 losses (actually more, but it looks like it’ll probably back test to the 1.272 today.)
Now, if DX starts to make a move, how will SPX react? Will it react? The dollar will need a serious push to get through current levels, since today’s equities weakness/dollar strength produced a Bat Pattern completion at the .886 — just as DX RSI also reached the next higher channel line.
While, SPX has broken channel support…
…even though prices reached a potentially important channel midline.
In the end, I suspect it all spells a breather for SPX’s downturn and DX’s strength – at least until the RSI’s are reset and each can take yet another stab at a real breakout/breakdown.
I’m holding with yesterday’s short-term forecast/scenario [the 2:45 update], but am open to revision if SPX can push strongly through the channel midline. I should get a chance to post again tomorrow morning.
ECRI’s Weekly Leading Indicator (WLI) came out Friday at 130.2 — up from 129.6 the week before. Further, they reported that the index’s annualized growth rate increased from 8.2 the previous week to 8.9% — the highest since May 2010. I wondered: are they retracting their Sep 2011 recession forecast? Are things really getting better?
CAN’T WE ALL JUST GET ALONG?
There’s currently an argument raging between various economists and analysts as to whether the US is still in/dipping back into a recession or is on the mend. ECRI is pretty sure we’re in one, while folks like Doug Short and, of course, the mainstream media think not.
There’s no question that we’ve seen an uptick in several economic measures. My own thesis is that most of these have been not secular, but cyclical swings. In other words, I don’t yet see evidence of a sustainable trend change, only natural swings from one side of a channel or wedge to the other.
Here’s an example I posted last week. Total Confidence has traced out a pretty solid-looking channel, while the Present and Expectations indices have formed expanding wedges (and are nowhere near their upper bounds, especially given the recent downturns.)
underlying chart from briefing.com
Hardly a day goes by when I don’t second guess myself. Is all the “good news” just one big, well-coordinated head fake or am I missing something? I spent much of the weekend studying ECRI’s historical WLI (who says technical analysts don’t live exciting lives!?) and found a lot to think about. First, a brief primer on Harmonics.
HARMONICS
Regular readers of pebblewriter.com (heck, even the irregular ones) know all about Harmonics and that the corrections experienced in April 2010, May 2011 and Sep 2012 correspond to the important Fib levels of 61.8%, 78.6% and 88.6%.
For the uninitiated, measure the drop from SPX 1576 (Oct 2007) to 666 (Mar 2009) and multiply it by a Fibonacci 61.8% and you get 1228.74. SPX reached 1219.80 in April 2010 (within 10 points) and promptly sold off by 17% over the next three months.
In May 2011, SPX peaked about 10 points away from the 78.6% Fib level (completing a Gartley Pattern) and plunged 21.6%. And, in September 2012, SPX reached the 88.6% Fib level (completing a Bat Pattern) and corrected by almost 9%.
Those of us who follow Harmonics were well aware of each of these downturns well in advance [see: HERE, HERE and HERE] and profited nicely from the market’s plunges. Those who rely solely on fundamentals or [involuntary shudder] the mainstream media…not so much.
THINGS THAT MAKE YOU GO “COOL!”
While I had noticed the WLI’s channel-like general decline before, I never noticed that it also complied with the rules of Harmonics. From its all-time high of 143.73 in Jun 2007, the WLI plunged to a low of 105.40 in Mar 2009.
Like SPX, it found its footing (thanks to QE1) and started higher. Its first big pause was in Oct 2009 at the 61.8% Fib level. It paused again in Jan 2010 near the 70.7% Fib, and eventually reached the 78.6% level in April — completing a Gartley Pattern as SPX had finally retraced 61.8% of its drop.
One could infer from the mismatched Fib levels that the economy — as measured by ECRI’s leading indicators — was ahead of the market at this point. The WLI had retraced 78.6% of its drop, while SPX had only retraced 61.8%. In any case, they both suffered from the removal of the QE drip – SPX shedding 17% and WLI 11%.
When the Fed realized their patient would flatline without more QE, they were back with QE2. The market took off, reaching the 78.6% Fib in May 2011. This also completed a Crab Pattern, a 161.8% extension of the amount of the Apr-Jul 2010 slide.
The WLI, however, retraced only 78.6% of its slide since its 2010 high. In other words, the market was now officially ahead of the economy.
Following the expiration of QE2, SPX plunged 21.6% to 1074 through October 2011, while WLI gave up 8.9%. From there, SPX climbed to 1474 primarily on Fed jawboning and promise of more QE — which it finally delivered the day before the 1474 high.
The timing was no doubt an effort to send the SPX soaring right through the 88.6% Fib retracement of the 1576 – 666 crash. I seriously doubt that “two points over” was what they had in mind (the market sold off anyway, correcting a respectable 8.8% to 1343.)
The WLI, in the meantime, topped out at 127.77 — only an 88.6% retracement of its decline from its previous high in 2011. Again, the market was outpacing the economy.
IS IT OR ISN’T IT?
The world of market prognosticators is, as always, divided. There are those who believe the economy is improving, and the market – as a leading indicator itself – is all the proof we need. Then, there are those who believe the market is priced well in excess of levels justified by the underlying economy — which remains in or is dipping back into a recession.
Whether QE has “saved” the economy or not, I don’t know of any respected economist or technician who doubts that it has significantly goosed (i.e. “manipulated”) the markets. And, we should pay attention to the disconnect between the markets and the economy as evidenced by the SPX/WLI comparison.
The WLI just hit an important Fib level (88.6%) after demonstrating that it does, indeed, pay attention to such things. This occurred at the same time that the S&P 500 hit several important Fib levels and is thus, by my reckoning at least, poised to correct [see: Satisfaction.]
We all know the old truism “the market isn’t the economy.” However, another quarter of negative GDP following the tax hikes recently enacted and spending cuts in the works would certainly remind investors that the market and economy are, indeed, joined at the hip.
I care about the economy because I have children. The Fed’s unprecedented experiment in QE will quite possibly end very badly for the country, for my children and for yours. But, there ain’t much We the People can do to influence Fed policy. They don’t answer to us or our political “leaders.” So, we play the cards we’re dealt.
As an investor, my goal is to capitalize on whatever the market throws at us — regardless of how manipulated it might be, and regardless of what economists call the current business cycle. If depression or hyper-inflation come along, we’ll hopefully see it coming and be well-positioned.
Are we still in or dipping back into a recession? Will the current QE4-ever result in another 2009-2011 run, or does the market’s yawn last September signal the end of QE’s effectiveness? We’ll find out in time. In the meantime, we have some very good tools at our disposal that have provided excellent returns in a very difficult market. I’ll continue to call it as I see it, and appreciate having you all along for the journey.
Alice laughed: “There’s no use trying,” she said; “one can’t believe impossible things.” “I daresay you haven’t had much practice,” said the Queen. “When I was younger, I always did it for half an hour a day. Why, sometimes I’ve believed as many as six impossible things before breakfast.” ― Lewis Carroll, Alice’s Adventures in Wonderland
The market never ceases to amaze me. Despite all the ingredients being in place for a sizable correction, it’s sailing along as though everything were copacetic.
Negative divergence abounds. The correlated currencies are all selling off. Gold is down. Silver is down. Even AAPL is down. Numerous indices have completed bearish Harmonic or Chart Patterns.
The Fed let slip yesterday that the adrenaline drip will soon be removed — leaving banks without a buyer for their underwater mortgages and the stock market without any downside protection. They’ve finally admitted what we’ve all known for some time: QE’s effect is diminishing, and the risk is growing.
The budget showdown is still ahead (the part of the fiscal cliff that really matters.) The most fractured Congress in modern history, which utterly failed to resolve the important issues, will now turn the task over to an arguably more partisan Congress.
The country’s AAA credit rating is hanging by a thread at both Moody’s and Fitch. A downgrade by either would require massive selling by institutions which require at least two AAA ratings in order to comply with their investment policies (especially insurance companies.)
Unemployment has reportedly declined, but only because we no longer count the dejected job seekers who are leaving the work force in droves. Include them, and the actual picture is startlingly bleak. (source: Shadowstats.com)
The EU is officially back in a recession (though it never really left.) Its banks are being kept afloat by the ECB/ESM, which is exchanging (somehow AAA) paper backed by shaky sovereigns for junk sovereign debt as fast as it can. Meanwhile, unemployment continues to soar.
The big 2013 headline that isn’t (yet) is the global derivatives debacle: $700 trillion — over 10 times the global economy — of unregulated, unpriced, unreported private contracts which have been sliced and diced so many times that no one has the slightest notion what the risk really is — except that it dwarfs the capital of the banks that hold it.
In my opinion, the onlythings keeping the economy and the market afloat are the unrelenting screech of MSM fairy-tale “good news” and the Bernanke Put (the Fed’s money printing and plunge protection operations.)
As long as these two factors can outweigh the negative fundamental picture, the market stands a good chance of rising. Take one of them away, and the resulting crash will be swift and severe.
That said, I’ve spent the past two days assessing the current state of our analog and forecast. I’ve quantified it as best I can in an attempt to eliminate my admittedly negative bias. I’ll lay it out over the next several hours, a few charts at a time.
If you’d rather skip to the punchline, I’m still bearish. In the absence of a push through 1474, I think we’re in for a sizable correction and remain short from 1462. If 1474 is broken, everything changes.
For members who enjoy getting their fingers dirty, stay tuned.
* * * * * * * *
About an hour ago, we completed a Bat Pattern which is nestled inside of a Bat Pattern which is nestled inside of a Bat Pattern.
UPDATE: 3:15 PM
RSI channels show how much is riding on this moment. A push through the top of the purple channel brings the red channel mid-line into play. Could it correlate with 1474, or maybe just the next channel line on the intra-day?
I’m not sure. The intra-day 1.272 is 1468.17 and the 1.618 is 1471.61. A double-top would be a real nut-buster.
All I know is there’s still negative divergence across the board, so I don’t expect the red mid-line to be broken.
My apologies for the delay in getting the forecast charts up. They’ll have to wait until after the close. I’ve been distracted by the melt-up, checking and re-checking my charts to see what I might be missing.
The US dollar remains in a rising channel within long-term channels that point to very different outcomes.
The rising white channel intersects just ahead with the larger falling white channel upper bound, the rising red channel mid-line and the 75% bound of the falling purple channel.
Whether the red or purple channel carries the day will depend largely on whether the ECB or the Fed can deflate its currency the fastest.
But, the intermediate-term picture is clear: if DX can hold the white channel, the next move should be much higher.
SPX might be tracing out either a flag or pennant pattern on the 15-min chart. While either could portend higher prices (2/3 of the time), a flag would mean lower prices first — probably down into the mid 1370s.
At first blush, the market seems to be respecting the last high of 1380.39 on July 19. I suppose it makes for a more positive wave structure.
But, I suspect the bigger worry for bulls is the Fib .786 at 1381.50 (in yellow). This retracement from the 1576 to 666 plunge (Oct 2007 – Mar 2009) was only recently exceeded again, and a real, live bull market shouldn’t have any difficulty retaking and defending it. Here’s the big picture, again:
Many readers have been asking about oil. It’s not that I haven’t been interested, it’s just been a real bear to analyze. Here, after a dozen hours of racking my brain, is where I see it.
Like many stock indices and currencies, Crude Light (CL) is at a critical stage. It reached 114.83 after breaking out of a diamond pattern in April 2011, only to back test the diamond six months later at 74.95. It then retraced .886 of that plunge, setting a lower high of 110.55 in February before plummeting once again as low as this morning’s 81.21 (the .886 is just below at 79.01.)
CL now balances on a precipice, where a move in either direction is likely to be huge. We’ll examine why, and which course is more likely.
When Wells Fargo CEO John Stumpf sleeps, he dreams — like all good bankers — about numbers. He probably doesn’t dream about the number 600 — the number of foreclosure packages signed each day by his robosigners. He probably doesn’t dream about 14,420 — the number of conveyance claims fraudulently submitted to HUD in exchange for $1.7 billion from the FHA [Inspector General report.]
And, he almost certainly doesn’t dream about his share of the laughably small $25 billion penalty he and his fellow bankers might have to pay to slough off legal liability for the millions of Americans they’ve helped make homeless (don’t know why they’re bellyaching…they’re all getting $2,000!)
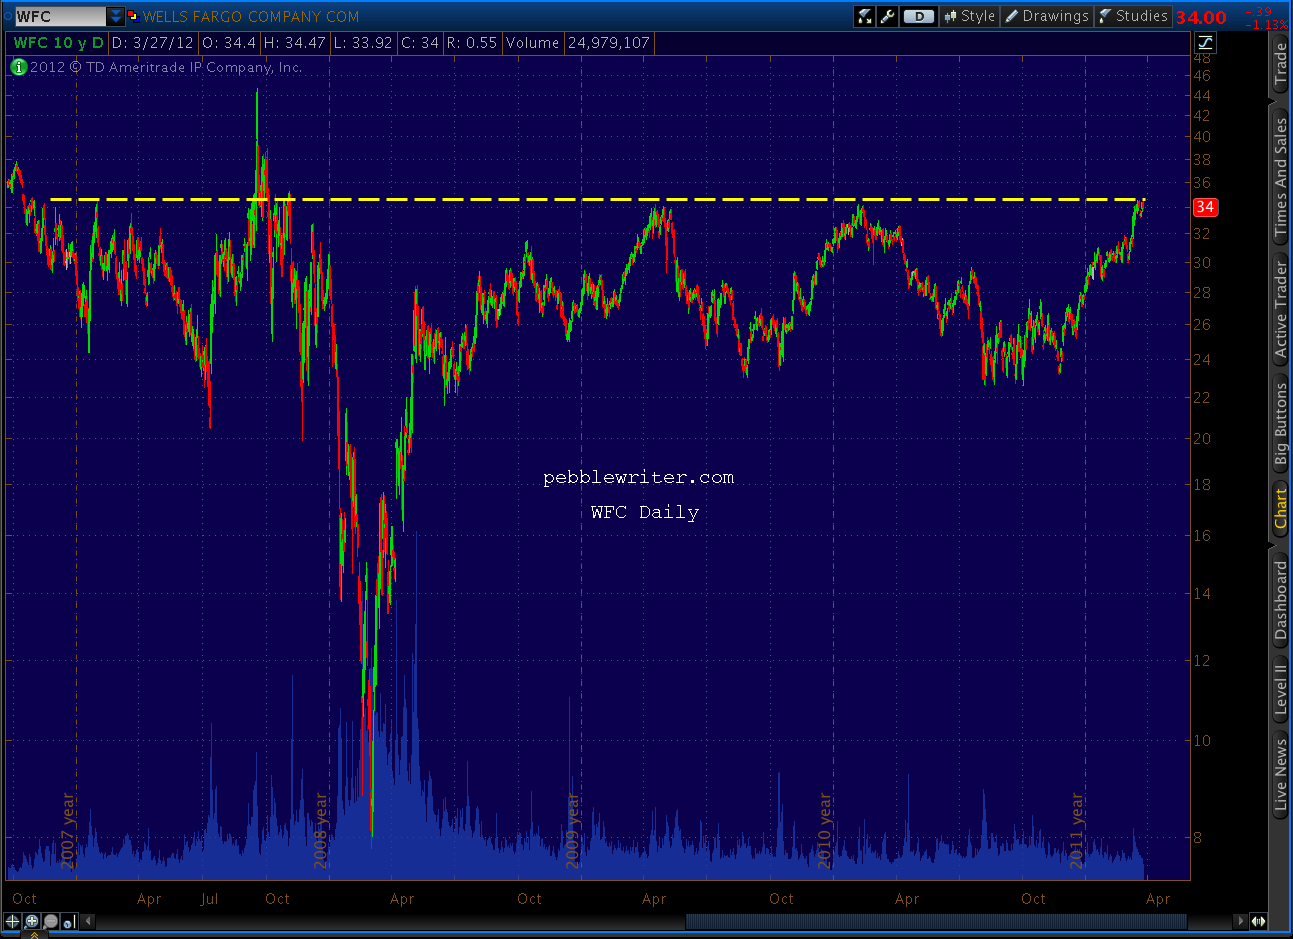
No, I imagine the number he fixates on is 35 — the third rail around which his stock seems to go into spasms every time it gets close. I’m exaggerating, of course; it’s only happened three of the last four times since November 2007. The other time, in September ’08, the stock soared right through 35 to nearly 45. That would be great — except it plunged to 7.80 six months later.
See that yellow resistance line? At least that’s what we call it. To Stumpf, it’s a 625-volt reminder of all the ugliness of the past five years: bailouts, Occupy Wall Street protests, and that humiliating testimony before Congress (what’s a fella gotta do to buy off a few Congressmen?)
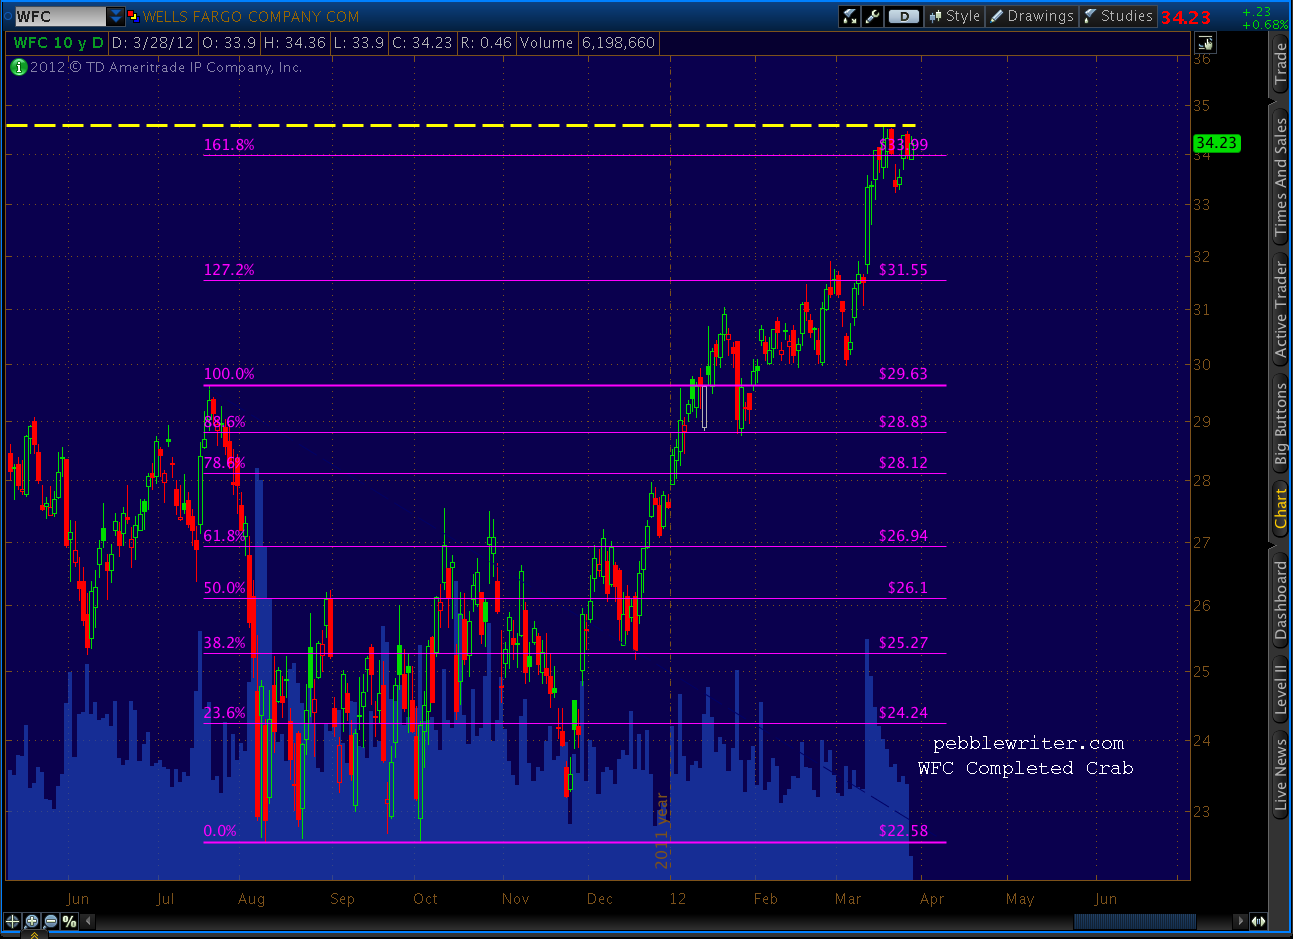
Stumpf might be dreaming about 35 a lot this week, as the stock’s edging toward that buzzing rail yet again. It’s really crummy timing for the stock to have completed a bearish Crab Pattern.
And, darn it, did the SEC have to pick this week to file that subpoena to compel him to hand over the documents he promised in regards to a $60 billion fraud investigation? Now, with earnings coming up in a couple of weeks?
That reminds me of another number, 13 — as in the number of times WFC got zapped after reporting earnings in the last 17 quarters. Earnings reports that came in the vicinity of that third rail have been particularly eventful.
Let’s not forget 6,867,990 — the number of shares of Stumpf’s WFC stock and options that’ll be worth considerably more if the 35 price point is breached. A 22 cent bump will make up for the horrendous pay cut he’s suffered over the past two years (from $21.3 million to $19.8 million, and we all know how tough it is to live on a lousy $54,000 a day!)
Hey, how about $85 million — the amount the Federal Reserve Bank fined Wells Fargo last year?
And, $25 billion — the low-interest loan the Fed slipped Wells Fargo a few years back when its survival seemed iffy.
Which brings to mind $29.4 million, the amount the money-center banks spent on lobbying in 2010 (not including the ABA.)
Then there’s $19.8 billion — the amount of hyper-hypothecation exposure on Wells Fargo’s books, 17% of Tier 1 capital?
Which reminds me — $1,274,000,000 in pre-tax trading losses for 2011.
And, lest we forget — $2.8 trillion notional in derivatives on the books.
I could go on all night, but I think you see where I’m going with this. We should all keep John Stumpf in our thoughts and prayers; with all those numbers to think about, the poor guy might have trouble getting a good night’s sleep. Somehow, I think he’ll manage as long as he sees $35 in the rear-view mirror…and soon.


 UPDATE: 09:30 AM
 Daily RSI reached the white midline as we expected, and is currently backtesting the purple midline. It’s still too early to say whether the new falling channel I sketched in yesterday is legit or not.
 The dollar is backtesting the channel line it broke through Wednesday after completing a Butterfly Pattern (the small white grid) to the 1.272, but the 1.618 awaits at the confluence of the purple 1.272 and red .618 up around 82.1-82.2 after the backtest is complete (not yet, I think.)
 The big question: what happens after the backtests are complete?