Tag: crab

  • The Road Ahead

    I’ve taken advantage of a relatively quiet morning in the markets to finish mapping the road ahead.  There are quite a few harmonic patterns in play right now.  My practice is to map all the apparent possibilities and look for confirmation (or lack thereof)  between patterns — and then look for ways in which they agree or not with all the chart patterns, channels and analogs I’m watching.

    It’s fairly exhaustive, so takes a fair amount of time.  I hope to post the results in the next hour or two.   In the meantime, the short-term forecast is still for increasing prices.  This morning’s chop does nothing to change that, but does illustrate the importance of using stops.

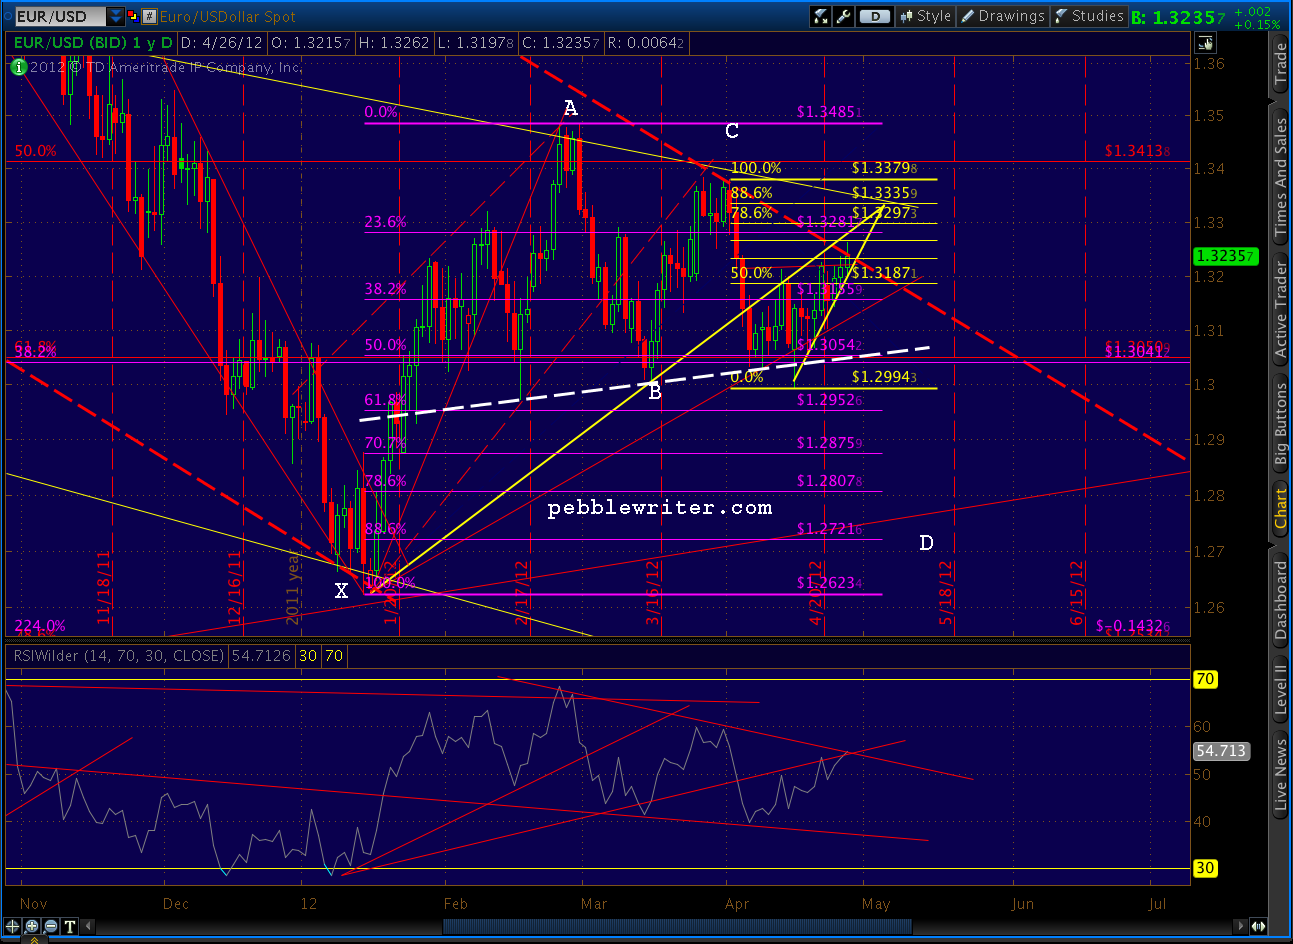
    Like yesterday, l will occasionally post short-term trading opportunities.  For traders so inclined, the idea of shorting at 1328 and buying back at 1298 is a great trade.  But, it requires a certain degree of vigilance.  For the buy and hold crowd who aren’t interested in 30 point blips, feel free to ignore such forecasts.

    Whichever camp you fall into, please remember to use stops at all times.  These are very precarious times, where unforeseeable events capable of moving markets are unfolding daily.  Please don’t get caught with a significant portion of your net worth hinging on any particular forecast — mine or anyone else’s — without protection.

    For those of you who who haven’t yet signed up, prices are going up at midnight tonight (PST.)   Current members are not affected, of course.  And, as before, the first 100 annual members are grandfathered for the life of the site.  If you’re a quarterly or semi-annual member, you might want to consider upgrading to annual.  To sign up, click here.

    Stay tuned.


    Update:  2:30 PM

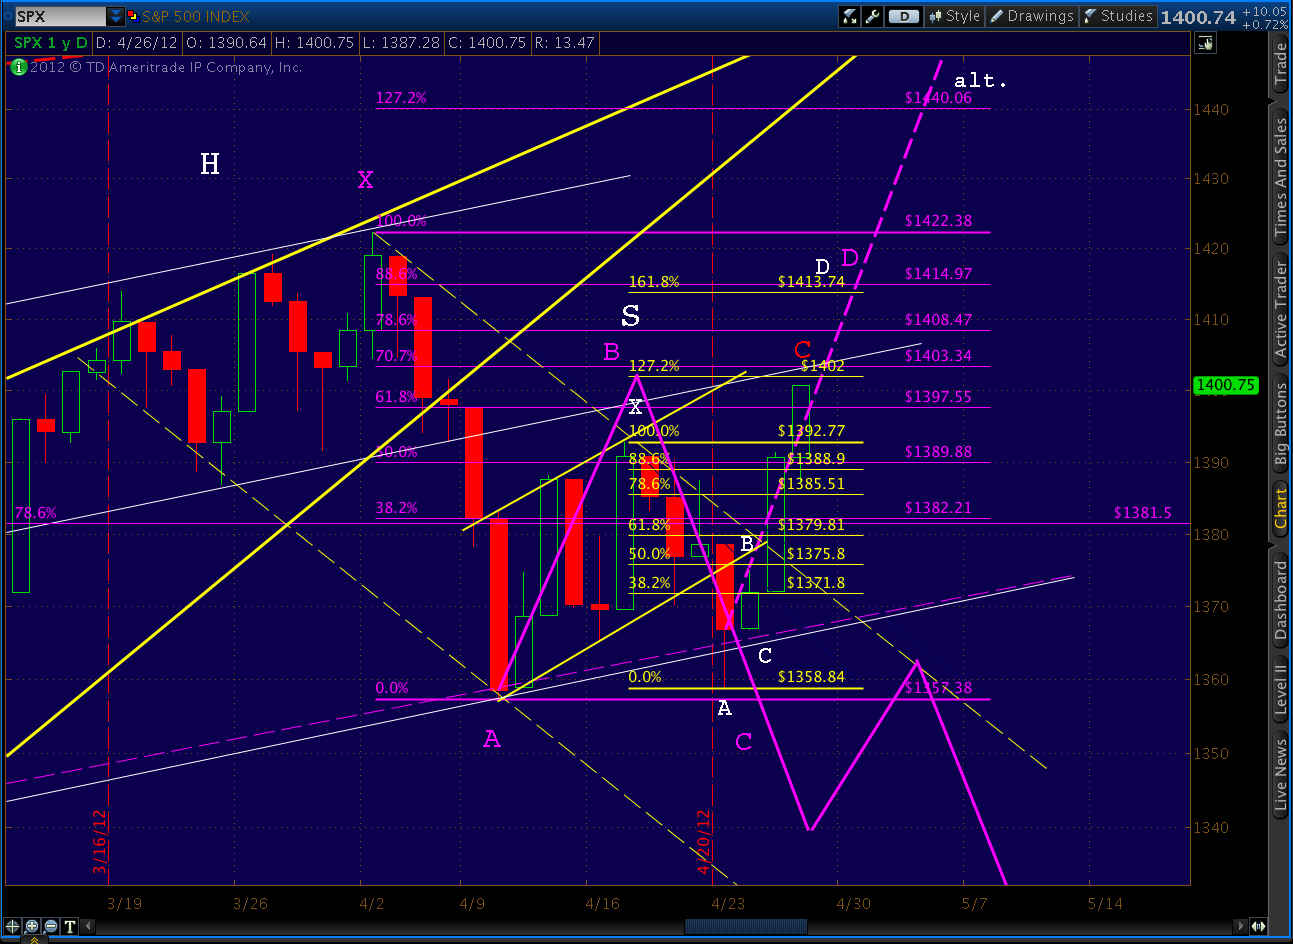
    The 5-min RSI just broke out from a falling wedge on positive divergence.  If it can stay above the upper bound this morning’s decline should be erased, and then some.  Watch for a back test of the wedge, which would correspond with a back test of the little red trend line at around 1311.

    Still working on the longer term picture.  I’ll send a message as soon as it’s posted.  At this point, all members should be receiving an email within minutes of when a significant post or update is posted.  Please let me know if you’re not receiving these messages.

    I’ve put the texting option back in the sidebar to the right.  Just enter your cell phone and service provider and you’ll be notified of new posts.  Note:  it doesn’t notify you of post updates, just the initial publishing of a new post.

    UPDATE:  4:05

    That worked out pretty well.  The falling wedge paid off as advertised, turning an 8-pt decline into a 2-pt gain at 1310.50 — just a smidge below our 1311 target.  I hope readers were able to take advantage of it.

    Since I didn’t complete the longer-term picture before the close, I’ll work late this evening and try to get it up before turning in.

    BTW, I get a number of emails during the day from readers, and I’m good with that.  But, I much prefer that anything market related — questions about strategy, investment options, etc. — go into “comments” on the post.  I’m likely to see them more quickly, and more importantly, your fellow readers might benefit from the discussion.  Thanks!

  • Say What!?

    I wasn’t sure what to write about today until I got a great question from a reader, who hopefully won’t mind my reposting it here:

    Pebble, I enjoy your analysis, but are you really saying you bought at the low on Friday and you sold at the exact high yesterday?

    “After scalping a quick 36 points (going long Friday at 1292, selling at yesterday’s high of 1328.49) I got a little cocky and went long again at yesterday’s low of 1310 — even though it didn’t quite reach my 1309 target.  I got stopped out on the opening and am looking for a good re-entry point — probably just above 1300 from the looks of the 15-min chart.”

    DeMark 15 min is saying we will have a bottom shortly in the SPX.

    Lately I’ve been very, very fortunate in my forecasts and trading.  As readers know, I’ve been calling for a decline to 1288-1323 since April 9 [see: New Analog I’m Watching].  On May 6 [see: So Far, So Good], I refined it to 1295 and wrote:

    Remember, our target is 1288-1323, although 1288 has been fudged to 1295 simply because a dip below 1292 would be problematic for the bulls from a wave count perspective;  i.e., I think they’ll pull out all the stops to avoid it.

    In between, the market hit my upside target of 1415 on the nose, and just about every interim target on the way down.  We arrived at 1295 only two days later than my forecast from six weeks earlier (the purple line below.) So, trust me when I say I was fairly confident going into last Friday’s session.

    We were completing a Butterfly pattern at 1289.14, a Crab pattern at 1288.69 and were approaching a Head & Shoulders target of 1289.  And, a number of other indicators I watch were all screaming “here comes a bottom.”  I really, really expected a bounce.

    I had orders ready to go when we hit 1295. I drew a little trend line coming down the face of the RSI on the 5-min chart (purple dotted line, arrow A on chart below) and waited for it to be broken.  When it did, I started selling short positions (at around 1295.)  When RSI back-tested and showed positive divergence, SPX was around 1292; so I took a deep breath and started loading up longs (albeit with fairly tight stops, in case I was massively wrong!)

    Was I nervous?  Enormously.  In my nervousness, I devoted practically an entire post [see: Message in a Bottle] to the fact that I’d written myself a note in an April 12 post [see: Analog Details] to bolster my confidence in what I knew would be a very nervous moment a month later.  But, yes, after catching the very top, I caught the very bottom.

    As to 1328, that was much easier. As I wrote yesterday morning [see: On Track] my 1330 target was based on the previous H&S neckline.  But, I was also watching the Fib levels (red Fib lines above) and RSI activity — which was flashing overbought from the word go.

    The rise started slowing as we approached the .500 at 1328.82.  I felt we would probably build a Bat or Crab pattern to the upside, so a turn anywhere between .382 – .618 made sense.  Here we were, slowing at the .5000.  Hmmm…

    I went to the shorter term charts (5-60 minutes) to see what they were doing and noticed a trend line was in danger of being broken on the 5-minute RSI (note the red dotted line that runs roughly from A to B.)

    Within the next 15 minutes or so, that trend line was broken, and back-tested (the yellow arrow.)  That was all I needed to confirm a good entry point; so, I went short — with stops a little over 1330 just in case.

    And, it worked out pretty well — except that I got cocky and traded at the end of the day yesterday when SPX very nearly hit my 1309 target (it was my birthday, I was loopy on pineapple upside-down cake.)  Had I looked at the 5-min chart again, I would have waited.

    So, I got stopped out this morning at around 1305 and sat out until 1296-1298 (discussed at 10:40AM, occurred at 12:25PM) which so far is looking like the right move.  Note the back test of the channel — setting up more positive divergence.  I have stops in just below 1292 just in case, and still believe we’re in for lots of chop.

    With respect to DeMark, I know a lot of folks who follow him, and it seems we’re often of the same opinion.  But, I’ve never studied his methodology and don’t really keep track of his forecasts.  I do take some comfort — especially when taking a contrarian view — when smart people express concurring opinions.

    I sat watching my daughter play volleyball all weekend and ran into another dad who’s very smart and also in the investment management biz.  He asked how I’d done in the markets lately, and I started to tell him about catching the rise to 1422, the decline to 1357, the rise to 1415, and the decline to 1292.

    As I went on, I could see the word “bull****” forming on his lips.  I stopped talking and went back to watching volleyball.

    Good luck to all.


  • Moment of Truth

    ORIGINAL POST:  4:30 AM

    The analog I posted on April 9 [see: New Analog I’m Watching] accurately forecast the move from 1422 to 1357, back up to 1415, then down to 1292.  As detailed in the last post [see: Why Bother], merely selling short SPX at the tops and buying in at the bottoms we forecast would have earned investors over 17% versus negative 9.4% for a buy and hold strategy.    That’s a differential of 26% that gets the new pebblewriter.com off to a great start.  Now, will it continue?

    (more…)

  • Searching for a Bottom

    UPDATE:  1:45 PM

    So far, SPX has obliged us by tagging every one of our targets.  The 1310 Fibonacci .707 retrace [see below] of the 2007-2009 collapse is our current intra-day low, and we’re presently sitting at the 1.272 target of the Butterfly incorporated into the analog I first posted on April 9 [see: New Analog I’m Watching.]

    As I mentioned yesterday, I think there’s a very good chance we get down to 1289-1295 (depending on whether they can defend the very important 1292.)  As oversold as things are getting, I wouldn’t even think about going long except, perhaps, to play a bounce — unless we’re able to break out of the acceleration channel on the 60-min chart.

    It’s the dashed red channel that’s guided prices since 1415 (ignore the solid purple line, that’s just our forecast from April 10.)

    UPDATE:  10:05 AM

    Philly Fed numbers aren’t pretty, with a 5.8% drop versus last month’s 8.5% increase.  Especially troublesome is the 6-month outlook, which has plunged from 33.8 to 15.0.

    A negative 5.8%  is bad enough in and of itself, but it looks especially ugly compared to consensus: +8.8-10.0%.

    The Conference Board Leading Economic Index also missed, showing a 0.1% decline versus expectations of a 0.2% gain.  This is the first drop since last September.

    If it looks like the leading economic indicator line hooked down over the past few months, that’s because it has.  Note the monthly rates of change — trending down from +0.7% in Feb to +0.3% in March and now -0.1% in April (not the sort of behavior you want to see in a recovering economy.)  Here’s the official explanation from the Conference Board:


    ORIGINAL POST:  9:39 AM

    I’m watching the RSI for clues as to which of our targets SPX will settle on.  Remember, the range is 1295-1323, though the number of unfolding events that could overwhelm our forecast is growing.

    The daily chart shows several parallel trend lines that might provide the final stop.  But, of course, lower stock prices often occur on a higher low in RSI — a phenomenon known as positive divergence, and a sign of a potential bottom.

    Here’s a little better detail on RSI:

    The white dashed trend line (7) is next up.  It stopped moderate declines in April, September and November of last year and probably corresponds with our 1317-1323 target.  Remember, 1323 is the small (yellow) Crab Pattern’s 1.618 and 1317 is the larger (purple) Butterfly’s 1.272.

    The purple dashed line (8) is associated with the declines in November of 2010 and a secondary dip in August 2011 and probably corresponds with either 1300 or 1317 on SPX.

    The yellow dashed line (9) stopped the plunges in March and June in 2011, and provided the higher low for the actual August 2011 1101 bottom.  March 2011 is the analogous point in the analog we’re watching.

    Surfing these RSI channel lines is an inexact science, because turns rarely occur exactly in line with previous highs/lows.  There’s a relatively high margin of error, say 5-8%.  So, it’s possible that yesterday’s RSI low could be considered to have tagged the white line.  If we get a strong rally off the Philly Fed survey or Conference Board numbers at 10am, we’ll call it that way.

    There is one other Fib level we haven’t talked about much — the .707 from the 2007-2009 decline is just ahead at 1309.67.   Many investors aren’t even aware of the .707, so it’s often completely left off charts.  But, this is a long-term pattern, so it could easily come into play.

    Last, the 60-min RSI shows a pretty good possibility of a bounce in the 1317 range.  Between 1323 and 1317, 1317 belongs to the larger and more important pattern — the Butterfly.  So, unless the Philly Fed survey is atrocious, we should get some kind of bounce there.

  • Still on Track

    ORIGINAL POST:

    In yesterday’s post [see: Two Targets Down], I theorized we would go up and trace out a right shoulder to complete a small H&S pattern in the right shoulder of the larger (completed) H&S.  So far, that’s exactly the way it’s playing out.

    As discussed, the perfectly-formed shoulder would take prices up around 1370 — a shoulder line parallel to the neckline, as well as the neckline of the larger H&S pattern.

    The 60-min RSI chart from May 8 forecast a back test of the solid yellow TL intersecting with the downward sloping yellow channel.  We got that, along with a clear rising wedge in the RSI to go with the triangle in SPX itself.

    From a timing standpoint, the ideal pattern will take 3-4 more days to play out — though there’s enough of a right shoulder now to consider it legit.  The target looks to be about 65 points below wherever we break back through the neckline, probably around 1275 (1340-65=1275).

    This is actually lower than the larger pattern’s target of around 1295.  I favor 1295 simply because I think the bulls will throw a fit if we threaten to take out the 1292 October highs.  Some of you more savvy Elliotticians know better than I what turmoil that would bring to the bullish case.

    More later.


  • New H&S Pattern

    Nothing to do with markets per se, but this kind of story really makes you stop and think…  Anyone who thinks the same couldn’t be done just as easily with a FAB-250 from a Skyhawk is deluding themselves.


    UPDATE:  3:40 PM

    The H&S neckline back test we discussed in the 2:20 post below is likely complete.

    Note that the head of this little H&S pattern came at the 1.618 extension of last week’s 1392-1358 decline — in other words, a Crab pattern (drawn in yellow.)  And, it’s nestled in the C and D legs of the Bat pattern that completed at 1415 (the purple pattern.)

    After weeks/months of normally reliable patterns busting left and right, it’s so nice (not to mention profitable) to see patterns play out the way they should.

    UPDATE:  2:20 PM

    SPX traded through the small neckline and seems quite content to pause at the small fan line I posted about this morning.  It’s line k-4 on the chart below, and just so happens to correspond to the SMA 10 on the daily chart (1390.81.)

    In H&S patterns, neckline breaks are often followed by a back tests.  If the NFP print in the morning is lousy, we should head down to 1372 pretty quickly.  If the numbers are great (or the market perceives them as guaranteeing another round of QE), the pattern will bust.

    UPDATE:  1:15 PM

    Be cautious with this smaller pattern, though.  The 60-min chart shows a distinct possibility of a bounce at the neckline (as happened with the larger pattern.) Focus on the bold, yellow TL on the RSI below.  I would suggest anyone considering piling on shorts protect themselves, as always, with tight stops.

    UPDATE:  12:30 PM

    Over on the right shoulder of the Head & Shoulders pattern we’ve been watching is a… H&S pattern.  It would complete somewhere just below 1394 and targets 1372 — the (wait for it…) neckline of the larger pattern.

    Ever get the feeling the market is just toying with you?  Seriously, though, this fits rather well with the RSI indicators, which as I posted earlier, support the idea of another test of the neckline.

    If we get crazy positive non-farm payroll numbers in the morning, all bets are off.  Barrons is reporting consensus estimates of 165,000 (below), while Briefing.com estimates 140K.


  • Next Stop 1462? April 27, 2012

    Yesterday we explored the alternate path in detail, noting that one of the two RSI trend lines we’ve been watching had broken, and the second was coming into play.

    There is the possibility that the downward sloping red, dashed TL will catch it on the way up, but the yellow TL just broken was a major feat.  A close above the TL would imply a definite momentum shift.

    This morning, the second (red, dashed) trend line just gave way, lending more credence to the alternate path higher if — and this is key — we can manage to close above it.

    As can be seen on the chart above, there’s very little in the way of resistance between here and 1462.  We’re at the H&S shoulder line now, and it’s possible that the pattern will still play out.  But, as discussed in Bulls Fight Back, the pattern will start looking lopsided with much higher prices or passage of a few more days before it resolves.  It fails definitively at 1422.

    Harmonics give us some ideas as to the path forward and potential turning points.

    Here’s the bullish case — a Crab (the larger purple pattern) with the 1.618 At 1462.55.  There’s a good possibility that we’d see a reaction at 1414, which is the .886 of a Bat pattern and the 1.618 extension of the smaller Bat (in red, labeled in white) that’s nestled in the last two legs of the larger purple pattern.

    But the ultimate target is Point D at the 1.618 extension of 1462.  This is the apex of the rising wedge pattern (yellow) we’ve been in since 1074 and intersects with the SPX channel mid line (red, dashed.)

    Yet, there are plenty of reasons for the market to turn down and complete the H&S pattern, including the very faint possibility that reality sets in.  Here’s the bearish case — a Butterfly (in red) — that points to a low of 1305-1317.  BTW,  red Point C can go as high as Point A, but no higher, in order for the pattern to hold.

    That red, dashed channel mid line at which either alternative ends is a biggie.  Here’s the view of the past 20 years…

    And, the even more stunning view since 1935…

    There’s the possibility of a slight miscalculation when graphing anything over 77 years.  So, when I say it comes in at 1462, that’s an educated guess based on my best interpretation of what I can see.  But, it’s helpful to know that it corresponds with the Crab patttern 1.618 –and is darned close to the Fibonacci .886 retracement level of the 2007-2009 drop at 1472.

    I believe we’re destined to tag that line again before the next big downturn.  But, whether we get there directly from here or after a more extended wave 4 is not clear to me at the moment.  For now, the momentum is clearly with the bulls, especially when we can rally off of horrid economic numbers.

    Personally, I’m reigned in quite a bit right now — at least until the picture is a little clearer.

    **************

    The EURUSD has also defied logic, gaining slightly on the day to the point where it’s exceeding the channel that’s guided it for over a year.  But, the last month has traced out a Gartley that could see prices reverse around the .786 retracement of 1.3297.  Our high for the day so far is 1.3269.

    Stay tuned.

  • On the Verge: April 26, 2012

    UPDATE:  5:35 PM

    S&P cuts Spain two notches, from A to BBB+, based on contracting economy…cites declining disposable income, private sector deleveraging, front-loaded fiscal consolidation and an uncertain outlook for external demand in many of Spain’s key trading partners.


    UPDATE:  3:25 PM

    Here’s a close up of the alternative path, which looks stronger with every uptick.  I haven’t altered its course since first charting it a couple of weeks ago.  Remember, it remains only an alternative until the H&S pattern busts.

    As we originally discussed, the thick, red dashed line is our target.  It’s the center line of a channel that goes back to 1935.  Really.  The rising wedge apex intersects with it at around 1462, which is the 1.618 extension of the purple Crab pattern detialed below (Point X at 1422.38).

    FWIW, it’s also the 3.000 extension of the small Crab pattern (yellow) nestled in the B-C-D legs of the larger Crab.

    UPDATE:  3:15 PM

    Interesting that today’s ramp has come without any help from the euro zone.  EURUSD continues to stall at the channel line discussed in this morning’s update on the euro.

    ORIGINAL POST:  1:45 PM

    Yesterday we examined the fact that SPX had broken a 26-session channel and was in danger of following our alternative forecast higher — the purple dashed line marked “alt.” in the chart below.  Remember, that alternative calls for a strong move to 1462-1472 in short order, while the analog calls for a breakdown first.

    We took a close look at the RSI trend line that, broken back on the 5th when the rising wedge was broken, was being back tested big time.  I mentioned I’d be watching it like a hawk, as I felt it would hold the key to which way this confusion resolves.

    As of right now, that RSI trend line is being broken.  While it’s possible this is an intra-day head fake, I’m not so sure that I’m willing to bet cold, hard cash.  Note the highlighted circle on the RSI portion of the chart below.

    And, expanded here…

    There is the possibility that the downward sloping red, dashed TL will catch it on the way up, but the yellow TL just broken was a major feat.  A close above the TL would imply a definite momentum shift.

    From a bearish perspective, one small Bat pattern that indicated more downside busted when we moved above 1392.  The larger Butterfly (labeled in red) will need its Point C moved over to today’s high, but won’t bust until/unless we exceed 1422 (where C > A.)

    From a bullish perspective, the Bat/Crab pattern marked below in purple correlates very well with the smaller yellow Crab — which, until this morning, was just a Bat.  Remember, Bats terminate at the .886 retracement, and Crabs at the 1.618 extension (or more).

    The small yellow Crab’s 1.618 is 1413.74, while the larger purple Bat’s .886 is 1414.97.  When two targets are in such close proximity, it lends additional credence — all else being equal.    Technically, we could get a move to 1414ish and still have a valid H&S pattern, but as we discussed yesterday, it puts additional strain on the pattern — and the analog — playing out, unless we see a very quick reversal.

    As we approach 1400, the market should at least pause.  It’s the original H&S “idealized” shoulder line, the 1.272 of the small Crab pattern, and a nice round number.  But, unless we reverse in the next hour and see that RSI dip back below the TL, I’m increasingly positive about a move to at least 1414-1415 to fulfill the Crab and Bat.

    Remember, this is still a back test of the rising wedge.  But, I’ve been studying rising wedges a lot lately; and, as we discussed many times [see: In a Fix], it’s not uncommon for a back test to go on up and tag the original apex — faking out all who were playing the broken wedge.

    More later.

  • Update on EURUSD: April 26, 2012

    A couple of days ago, I updated all the EURUSD charts [see: Update on EURUSD], commenting that the pair was approaching a crucial test of the channel that’s guided it for the past year or so.  With this morning’s mildly positive action, things have gone about as far as they can.

    Note in particular the dashed, red channel and the corresponding RSI trend line.   It looks more like a very strong back test than anything else.  If so, and things get going on the downside again, we should finally complete the H&S pattern (lots of those lately) and reach Point D (1.2721) of the presumed Bat without any difficulty.

    One thing of particular interest to bears is the series of fan lines from the Jan 16 lows.  Each has very clearly provided stair steps lower over the past two months.  The latest to be back tested is highlighted in yellow and happens to form half of a rising wedge over the past 16 sessions.

    This rising wedge is about 2/3 of the way to the apex (1.3335), which is also the .886 of the little Gartley or Bat that’s under construction.  We reached the .707 earlier this morning, poking just above the red, dashed channel line intra-day.

    A close outside the channel and above the RSI TL would be wildly positive for the euro; I must admit, I just don’t see that happening given the conditions in the euro zone vis-a-vis the craptastic picture everyone’s painting on this side of the pond.

    More later.

  • Analog Update: April 24, 2012

    The analog we’ve been watching since April 9 is playing out nicely so far.  We got the original bounce at 1357 as forecast, followed by a rise to the middle of our 1380-1400 target range.  The H&S pattern we expected did, in fact, set up and complete yesterday.

    Now, we’re back testing the little channel (solid yellow) formed by the right shoulder.  It was broken during yesterday’s plunge.

    As we discussed yesterday, if the wheels fall off the analog, it’s going to happen here — at the H&S neckline.  A hard bounce would likely send SPX up to tag the initial rising wedge apex at 1462-1472 (the purple dashed line.)  It can be viewed as a Crab pattern with the 1.618 at 1462 (in purple, points not marked.)

    But, I think we’re more likely to see the analog continue to work.  The key will be a failure of this morning’s rally/back test and a close below 1363.  Note that we’ve also established a channel to the downside (red, dashed) that coincides nicely with the harmonic picture.

    The pale blue Bat/Crab indicates a potential to 1335-1340, which would be a nice spot for a back test of the H&S pattern itself.  From there, the larger red Butterfly pattern takes over, with potential to 1317 (the 1.272) or 1289 (the 1.618.)  Though, a drop below last October’s 1292 would be a challenge.

    The key levels I’m monitoring today are 1378 — at which point the back test starts to intrude into the previous channel, and 1382 — at which point the larger red, dashed channel is jeopardized.

    Good luck to all.