

About a month ago, as part of the series of charts inspired by our latest analog [see: Analog Details Feb 7, 2018] I hazarded a forecast for RUT that called for a rebound to the rising white channel (which had recently broken down) by Feb 14, a retracement on Mar 1, and a subsequent rally back into the rising white channel.  The only serious uncertainty at the time was whether ES’ tag of its SMA200 was sufficient — or whether SPX would need to follow suit.
In any case, SPX did go on to tag its own SMA200 the following day, meaning RUT posted a slightly lower low before rebounding. It reached the white channel on Feb 14 as expected, but continued leaking higher for several days before putting in a low as scheduled on Mar 1. Since then, it has nonchalantly rejoined the rising white channel as though nothing was ever wrong. It has done this many times in the past, of course. So, that’s not terribly noteworthy.
What is interesting is that the Feb 9 plunge facilitated an important backtest that should help determine whether it has further upside ahead. What’s fascinating is the extent to which nearly every one of RUT’s twists and turns has been driven by algos.
The precision of these moves leaves little doubt that they’re by design. No random walk, here.
continued for members…
As it happened, RUT missed its own SMA200 by 0.23 on Feb 6. So, that subsequent dip allowed it to officially bounce off the important support.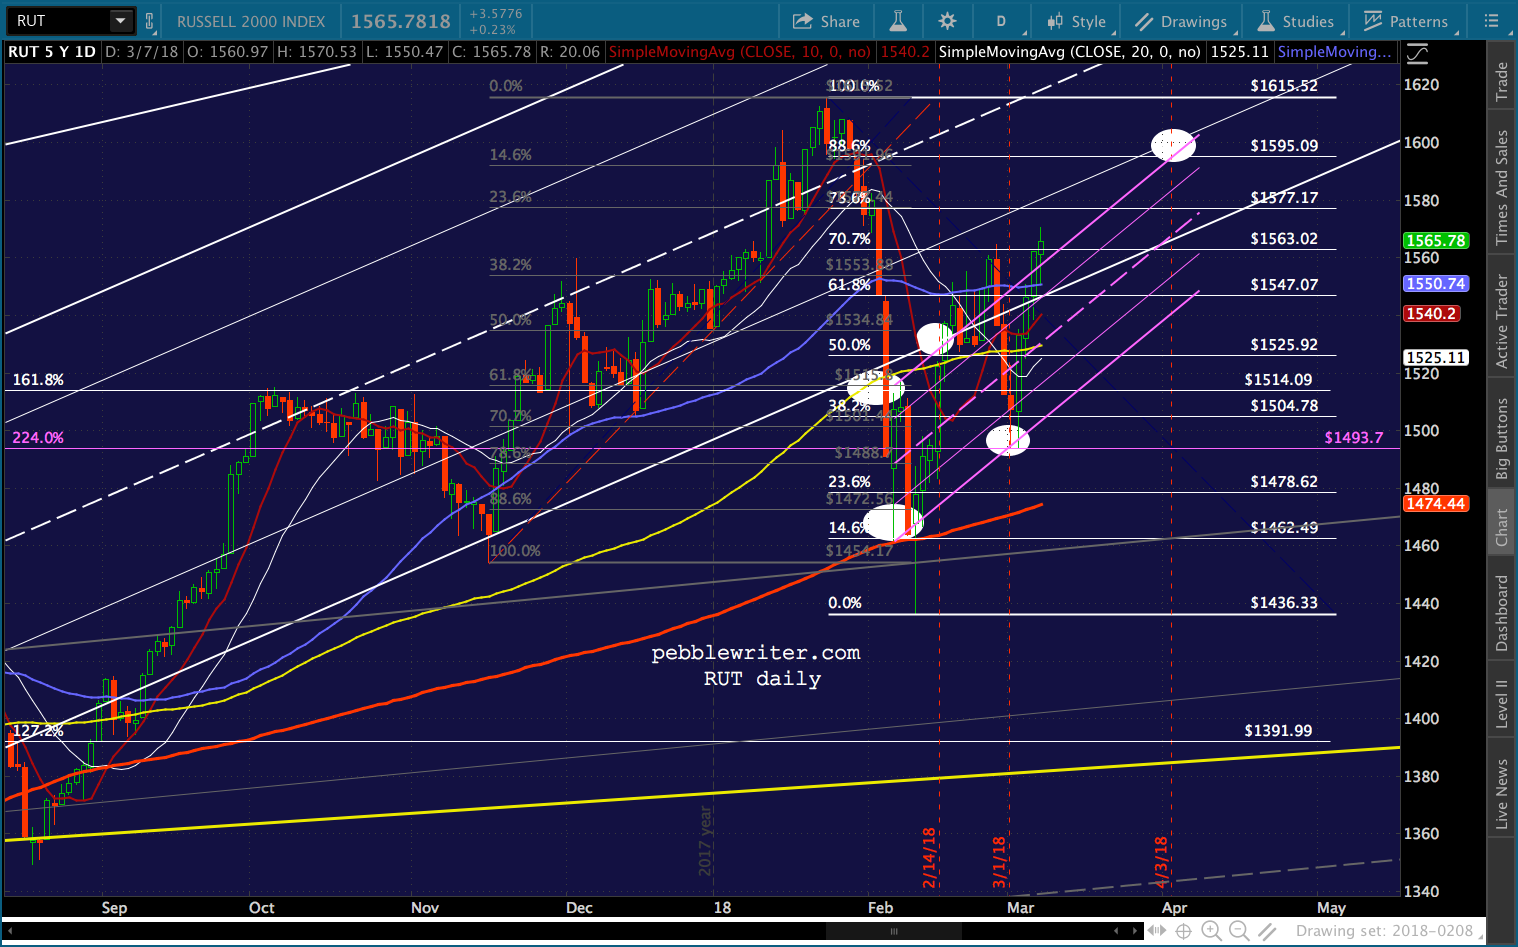 Let’s review the big picture. Like SPX, RUT faced an existential crisis around the US election in 2016. The rising red channel from ther 2009 lows had broken down and was backtesting at the .886 retracement of the drop from 1296 (yellow arrow.)
 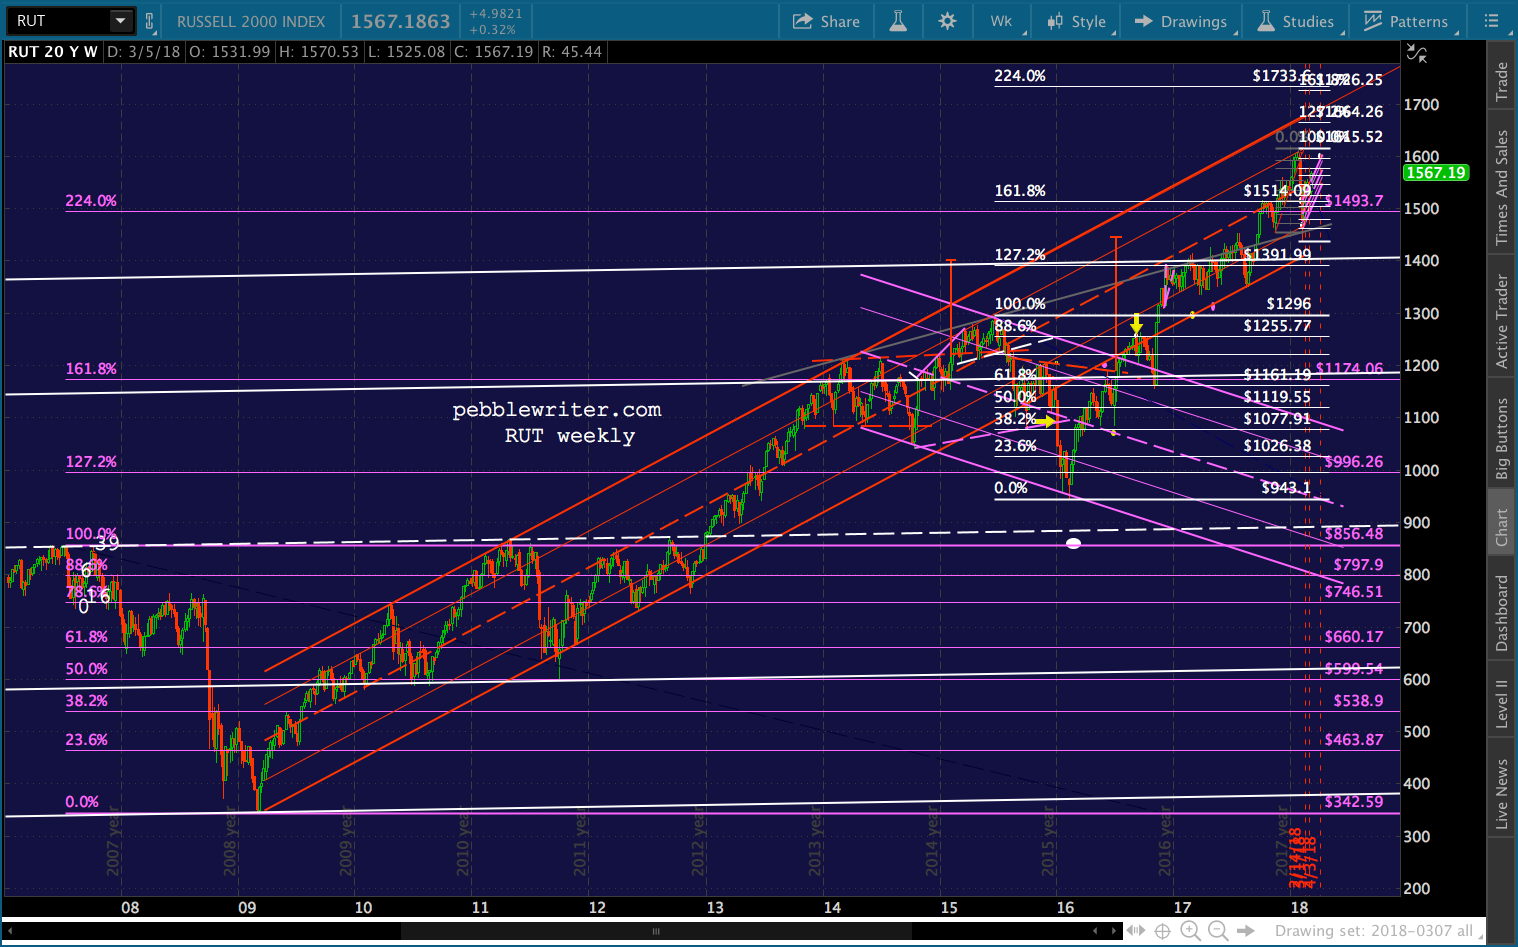 It had broken out of a corrective falling channel (purple) and completed a second IH&S (after the 2014 one failed.) But, the backtest of both the channel and the IH&S neckline failed in early November.
While the S&P futures fell 4.5% on election night, RUT eminis fell 5.8%, plunging through the SMA200 . This would have meant a failed breakout, followed by a reversal at the top of the purple channel. 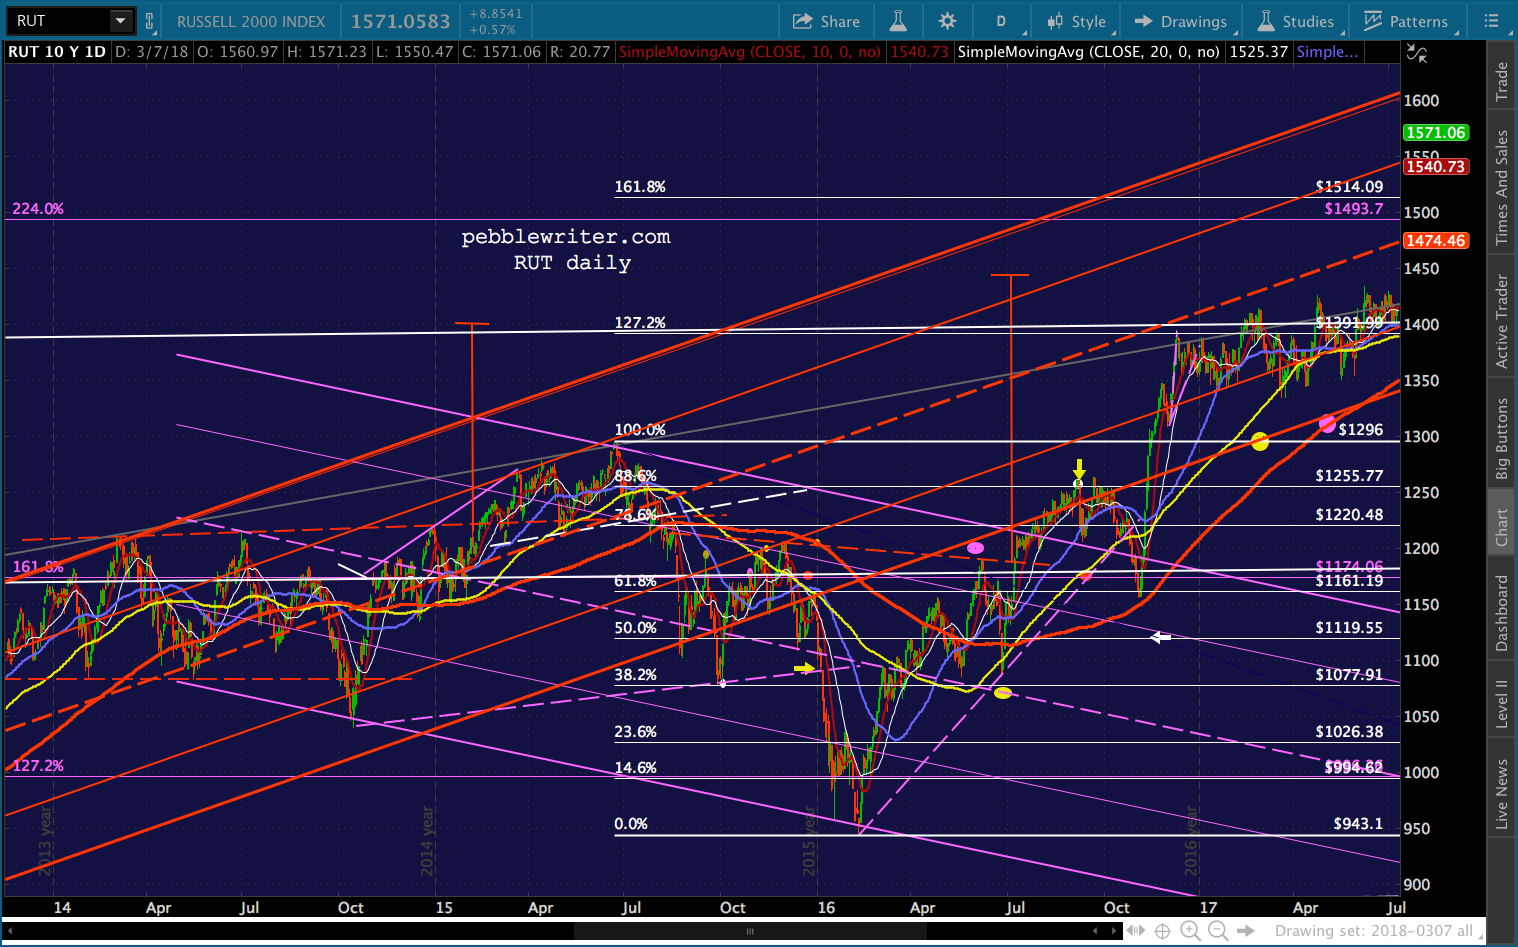 Thanks to USDJPY’s 17% spike, CL’s 55% spike and VIX’s 63% collapse, RUT broke out of the falling purple channel, rejoined the broken red channel, and went on to test its 1.272…multiple times over the course of 7 months, actually.
What it was really doing was marking time until the SMA200 came along. When it finally rose above the level of RUT’s recent lows in Aug 2017, RUT relented and tagged it and the bottom of the red channel at the same time.
From then on it was a matter of leaping past the 2.24 and 1.618 at 1493 and 1514 (thank you, VIX.) It topped out at the red channel .786 line, fell to the .236 line and SMA200, and is on its way to the .886 at 1595.09 (or higher.)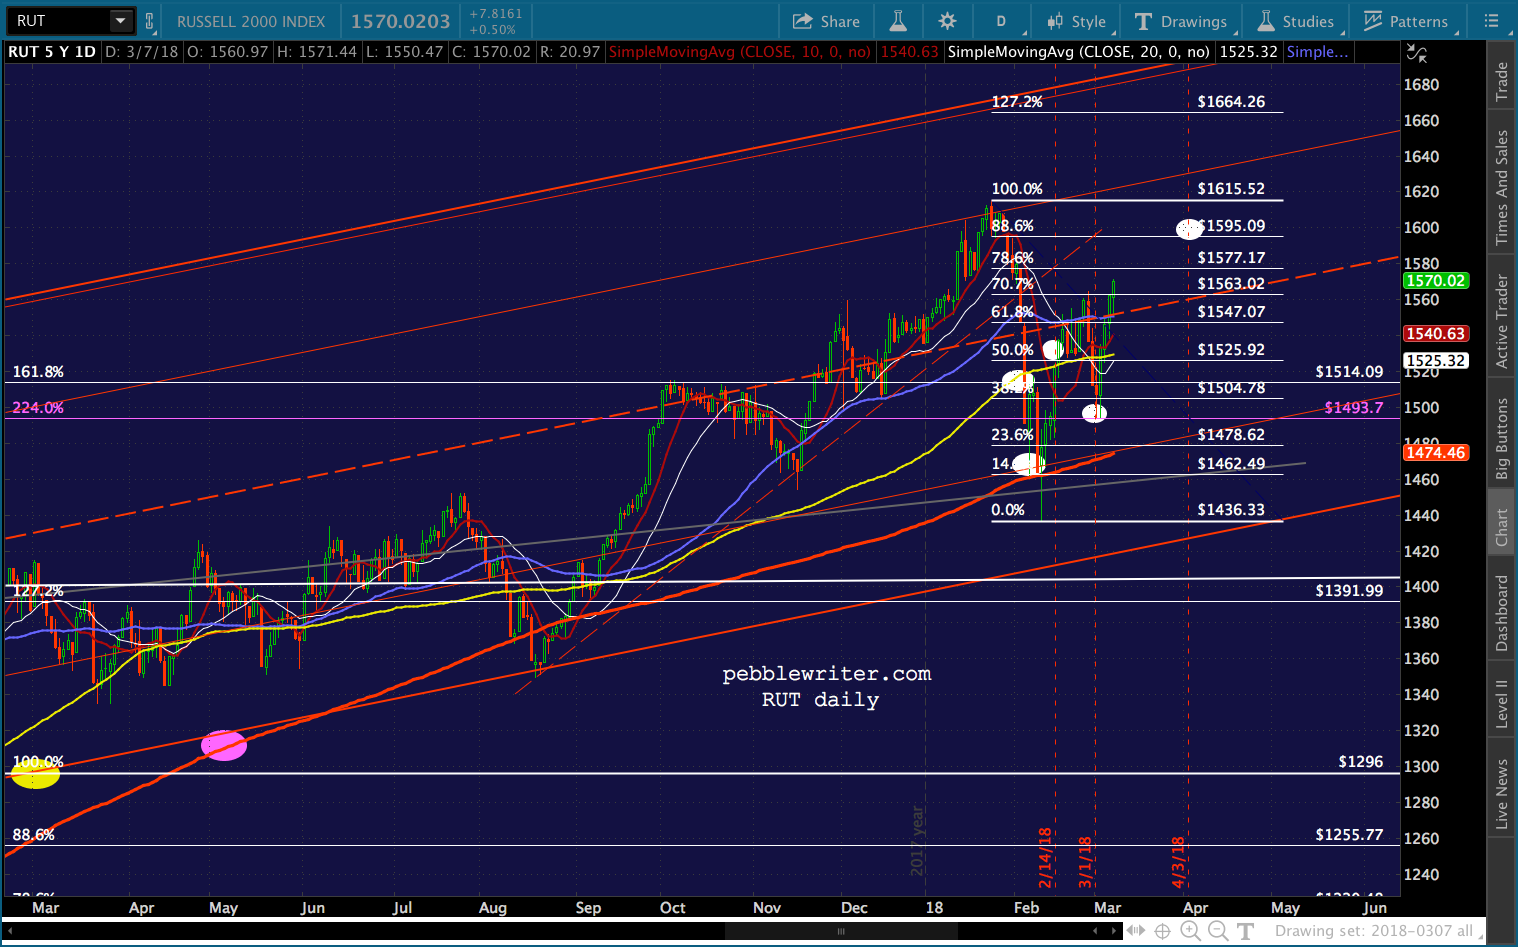 As with the other indices, the analog will continue to work…until it doesn’t. If investors and algos can’t be duped into bidding it up to new highs, whether tomorrow or a month from now, then the analog says it’s in for a huge drop.
 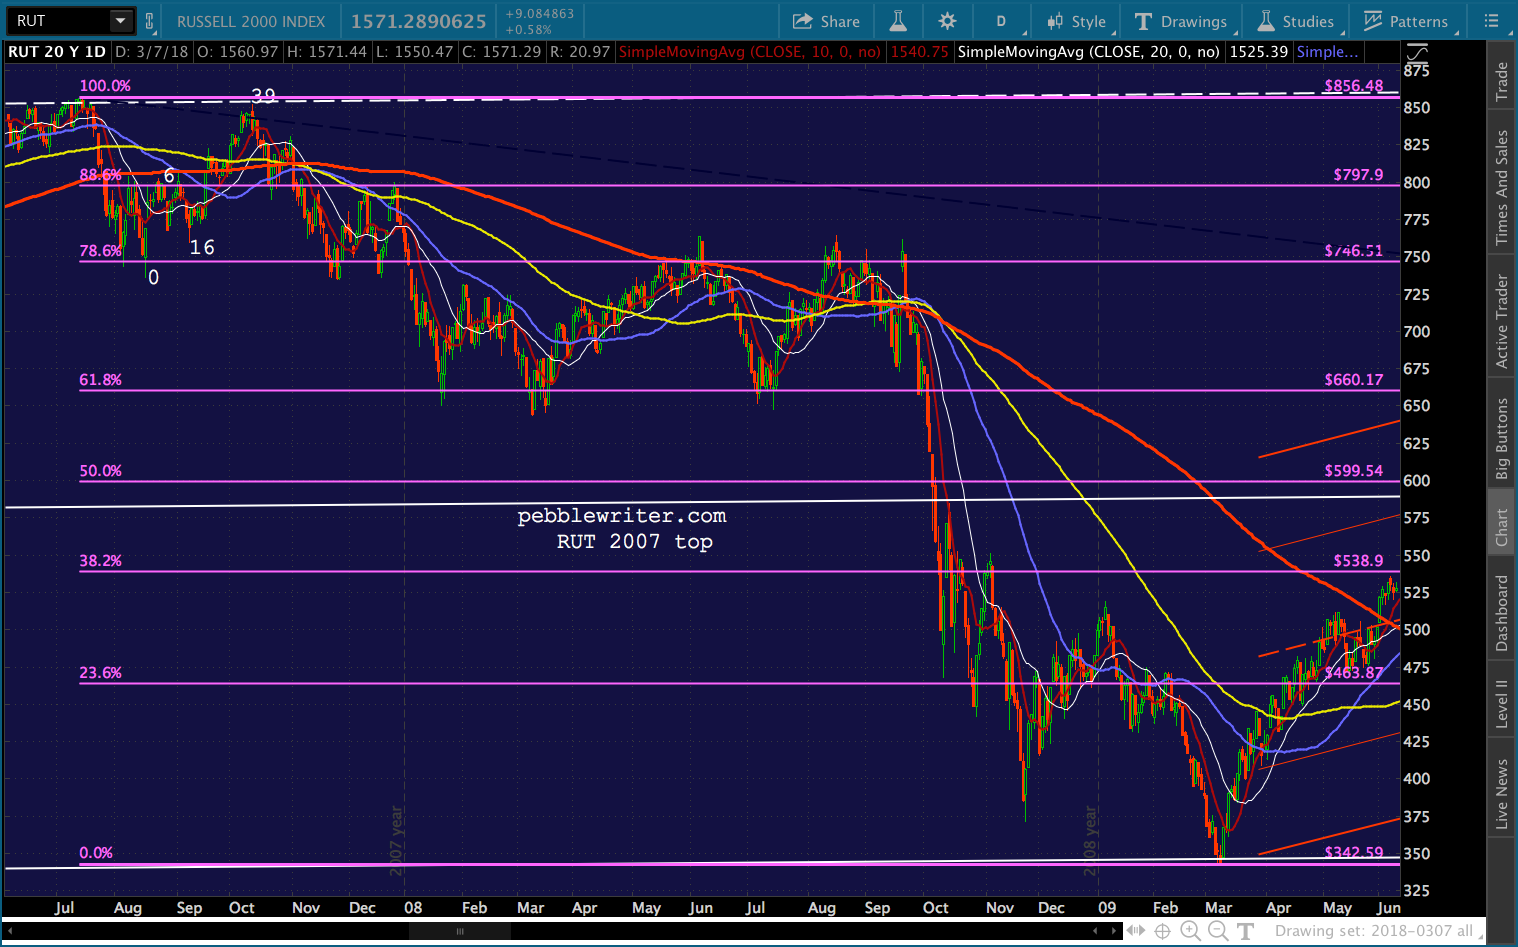 If, as I suspect, TPTB learned something from 2007 and have a few tricks up their sleeves, then RUT should be on to new highs. They’ve obviously become really good at manipulating VIX, CL and USDJPY at just the right time to overcome whatever resistance the charts offer.
Our analog suggests we’re repeating 2007. RUT, on the other hand, suggests we’re repeating 1987. The recent plunge merely backtested the yellow TL connecting recent highs.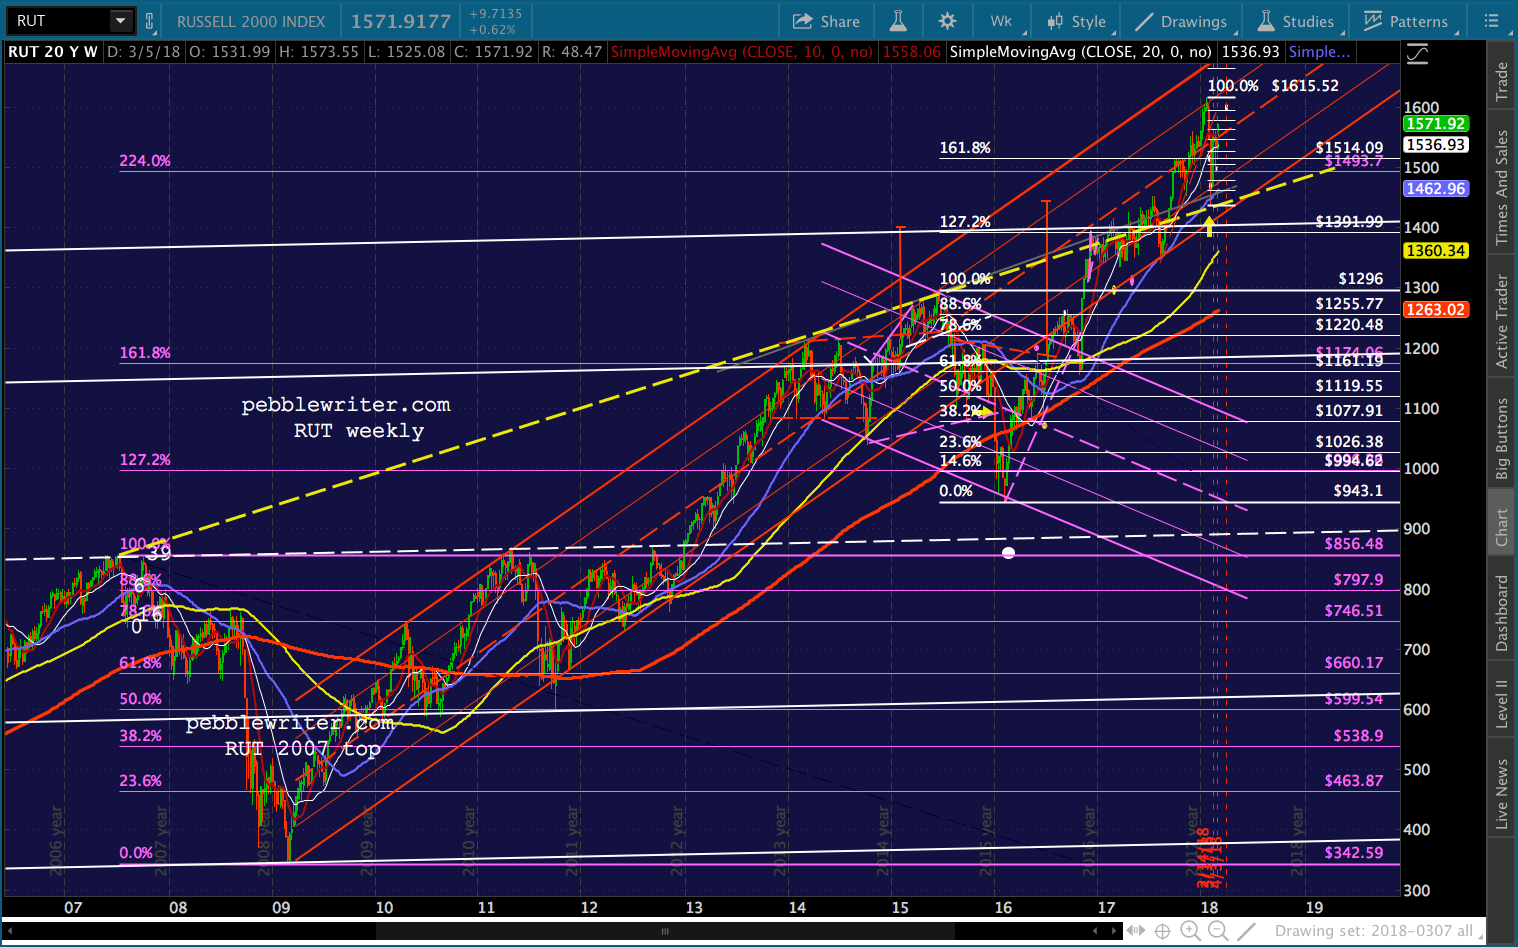 The same thing happened in 2014, when the (purple) TL connecting the 2000 and 2007 highs was backtested.
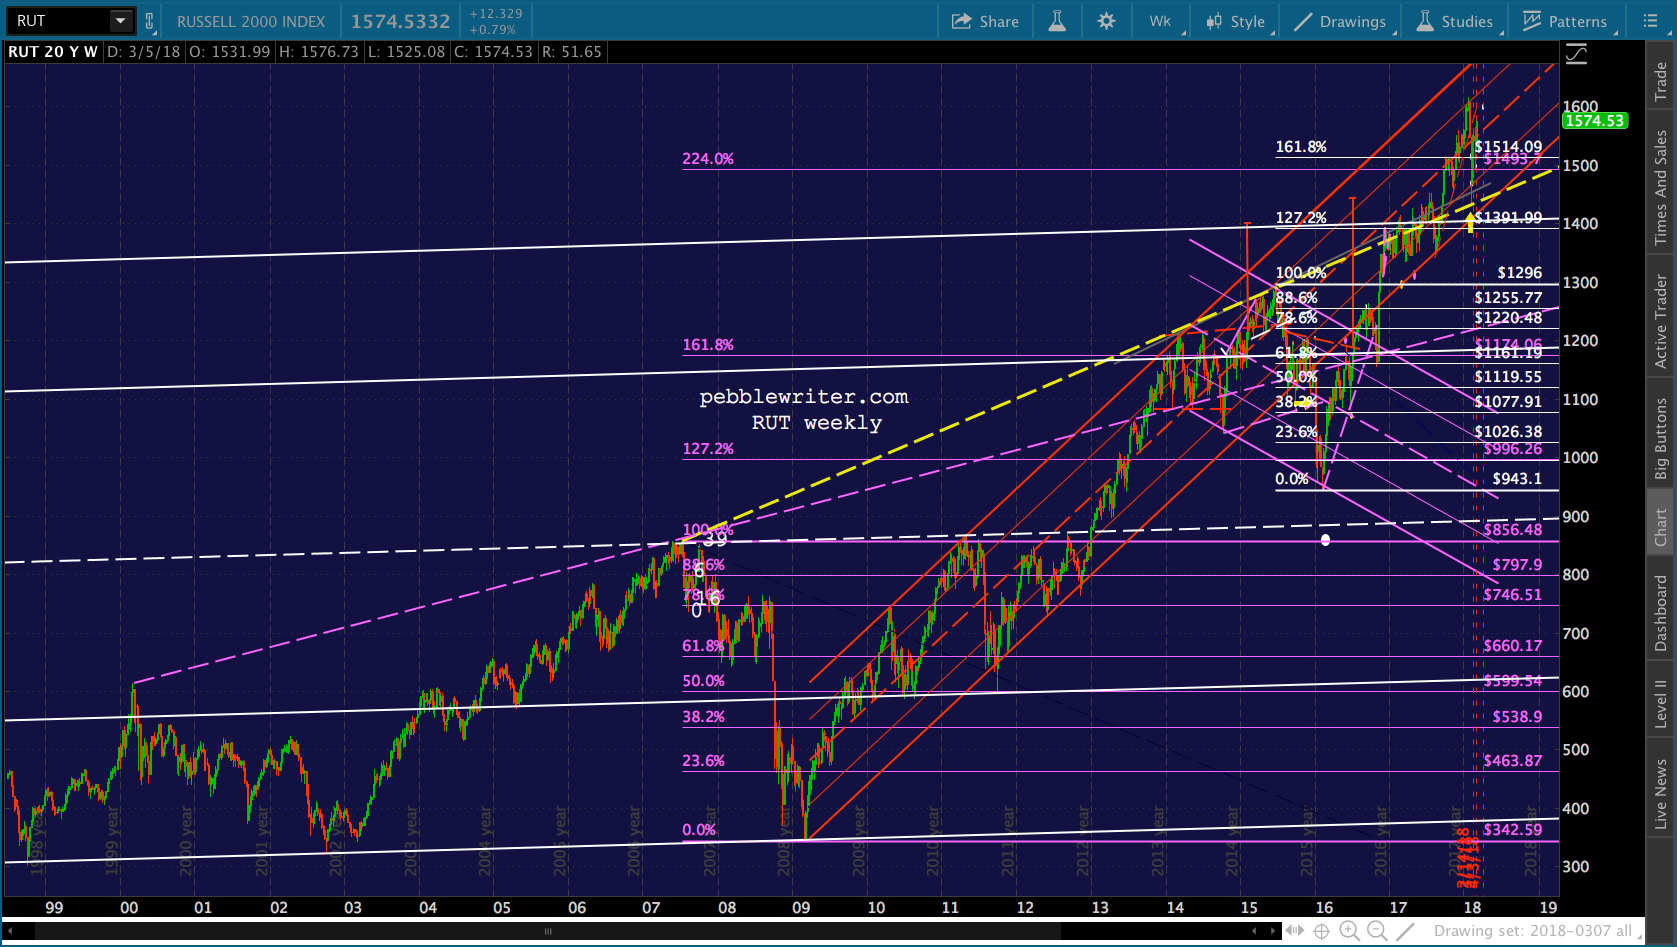 Okay, how about some creepy coincidences and examples of extremely blatant manipulation? RUT first tested the purple TL on Aug 5, 2013 (VIX #1), popped through it on Sep 18, fell back, popped through it again on Oct 11 (VIX # 2), backtested it on Nov 7 and again on Feb 5, 2014 (VIX #3.)
The VIX notations refer to the triple top that just happened to form at the right time — with VIX nosediving every time RUT needed a boost or to be propped up.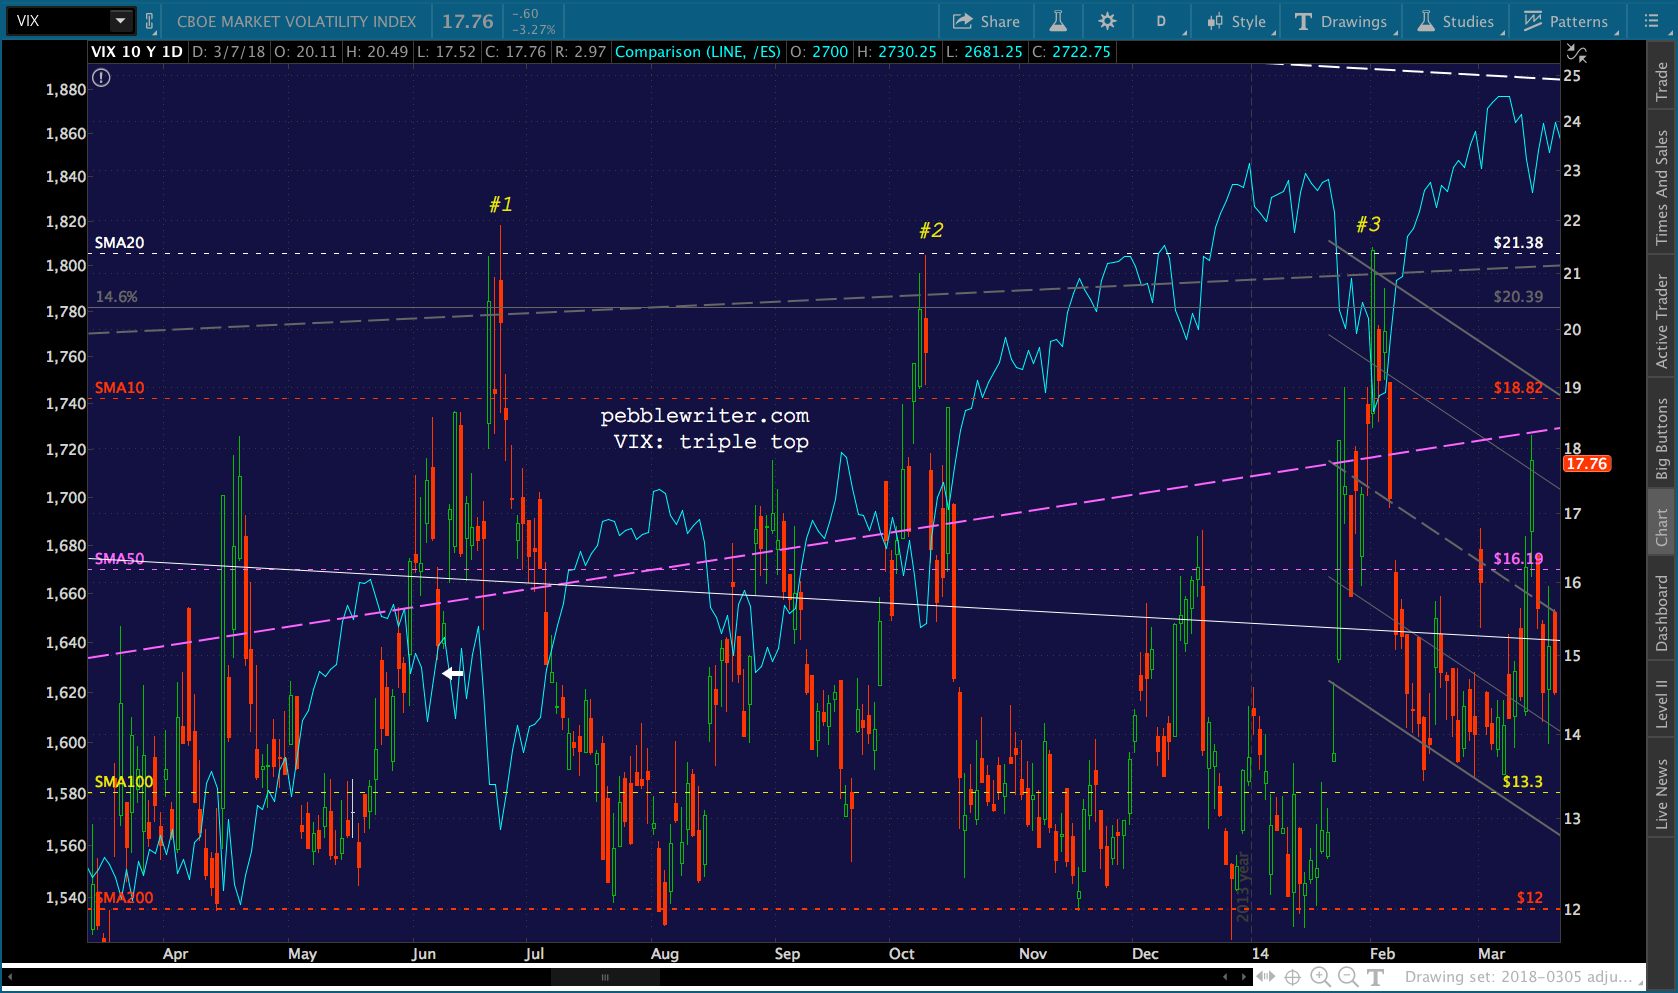 The Sep 18 high was important, as it was tested as support (the red trend line) over and over again. Of course, when you have multiple bounces on the same price level, it starts to look like the neckline of a Head & Shoulders pattern. By June, that’s exactly what it was looking like.
But, in July, RUT exceeded its prospective head of 1212.82 by 0.73. Technically, the pattern was busted. 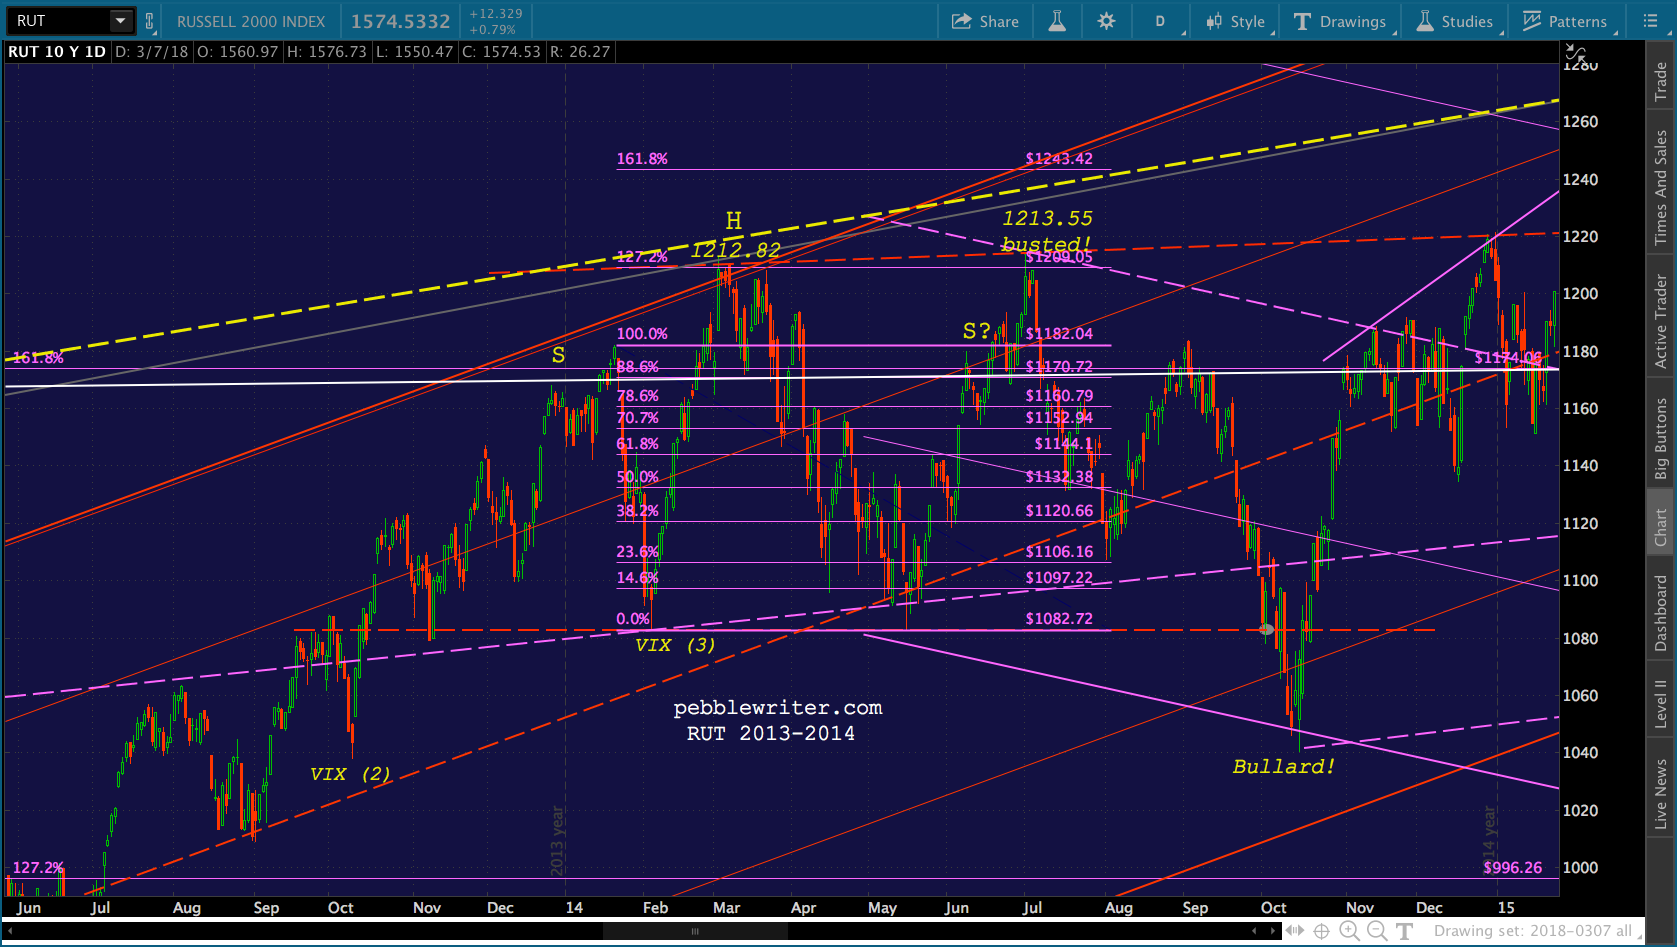 Bears weren’t so sure, though. Another H&S pattern set up and was in the process of paying off when a certain Fed president went on Bloomberg TV and suggested that QE4 might be in the works. Yep, RUT got Bullard-ed.
Let’s look at the equivalent dates this go ’round. RUT most recently popped through the yellow TL on Sep 11 (the session after Sep 8 a la 2013.) There was a near backtest on Nov 15 (vs Nov 7 in 2013) and an actual backtest on Feb 9 (vs Feb 5, 2014.) You might think those dates were suspiciously close. And, you’d be right. But, probably not for the reason you think.
When I sat down to look at potential algo triggers for those and other key dates during RUT’s ascent, I started with VIX. And, there’s really no need to go any further.
We know that VIX has been critical in driving algos to drive stocks higher ever since December 2016. The once per year drop to the yellow channel bottom quickly evolved into a 3 of every 4 day affair in the wake of the US election. But, it is just plain shocking how effective VIX has been in driving RUT’s every significant move over the past five years.
We’ll start with the big picture: 2013-2018. Almost every single one of RUT’s significant bottoms was made possible by a sharp plunge in VIX. We can see the three afore-mentioned points during late 2013-early 2014, followed by the Bullard stick save that got RUT back above the 161.8 Fib at 1174.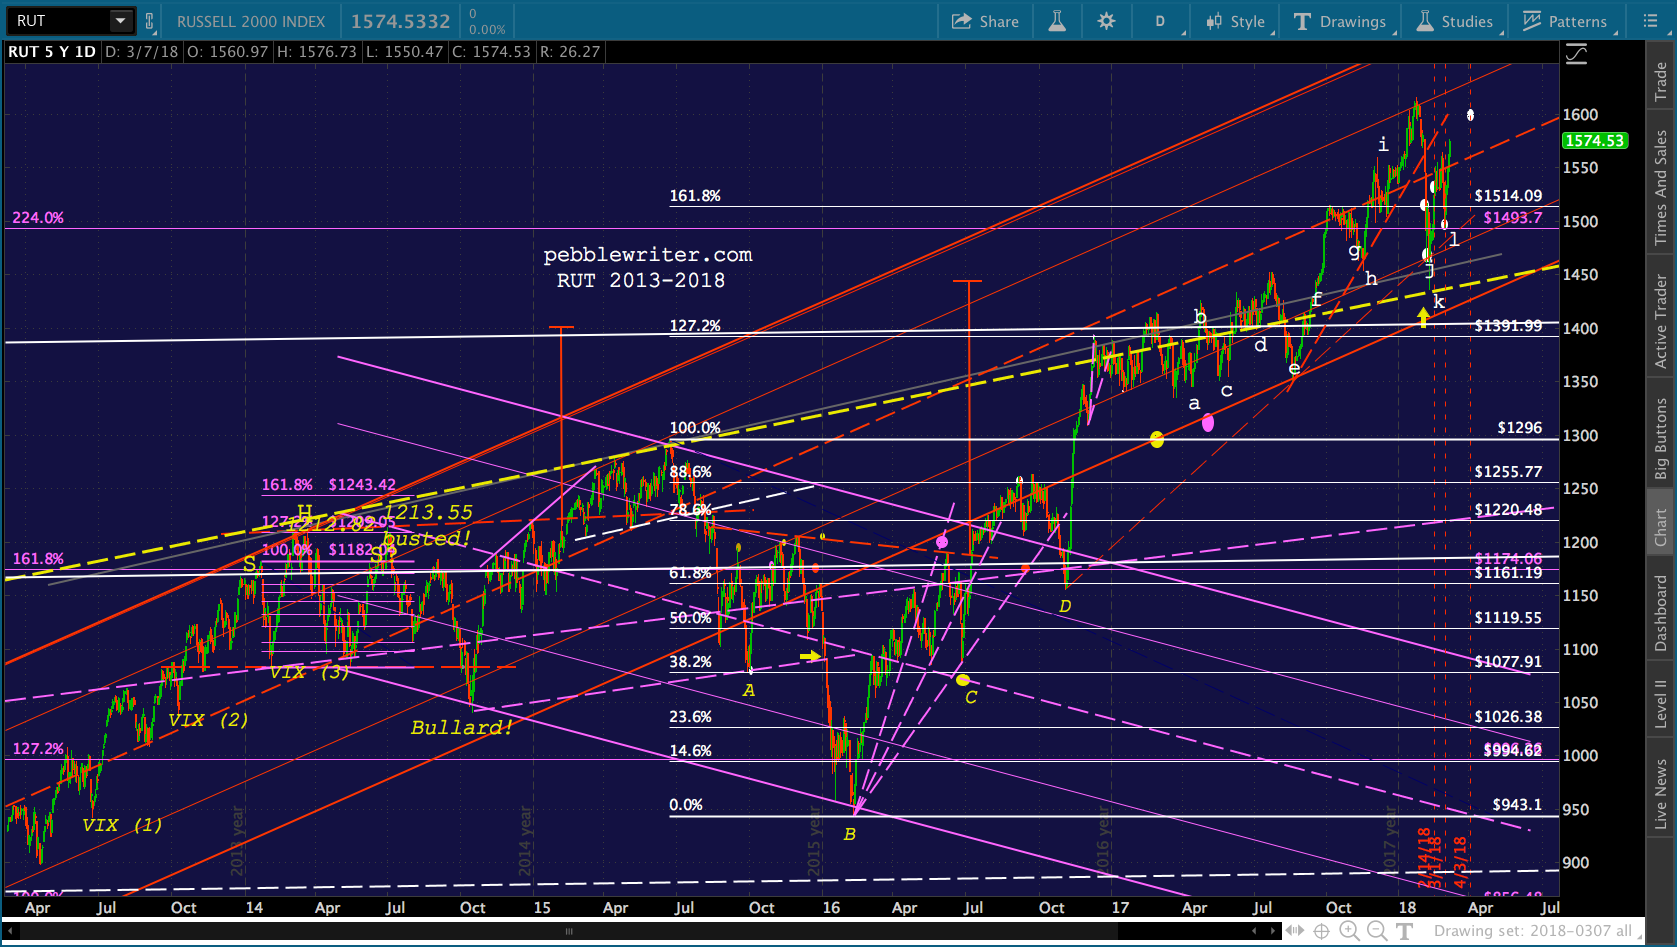 When RUT plunged back below the 1.618 in August, however, it was VIX’s plummet from 53 (Point A) which propped RUT up. It worked for a few months, but eventually RUT fell back below 1174.
This time, it was RUT’s retreat from Point B which provided a bottom. The same thing happened at Points C and D, which corresponded to the Brexit vote and the US election.
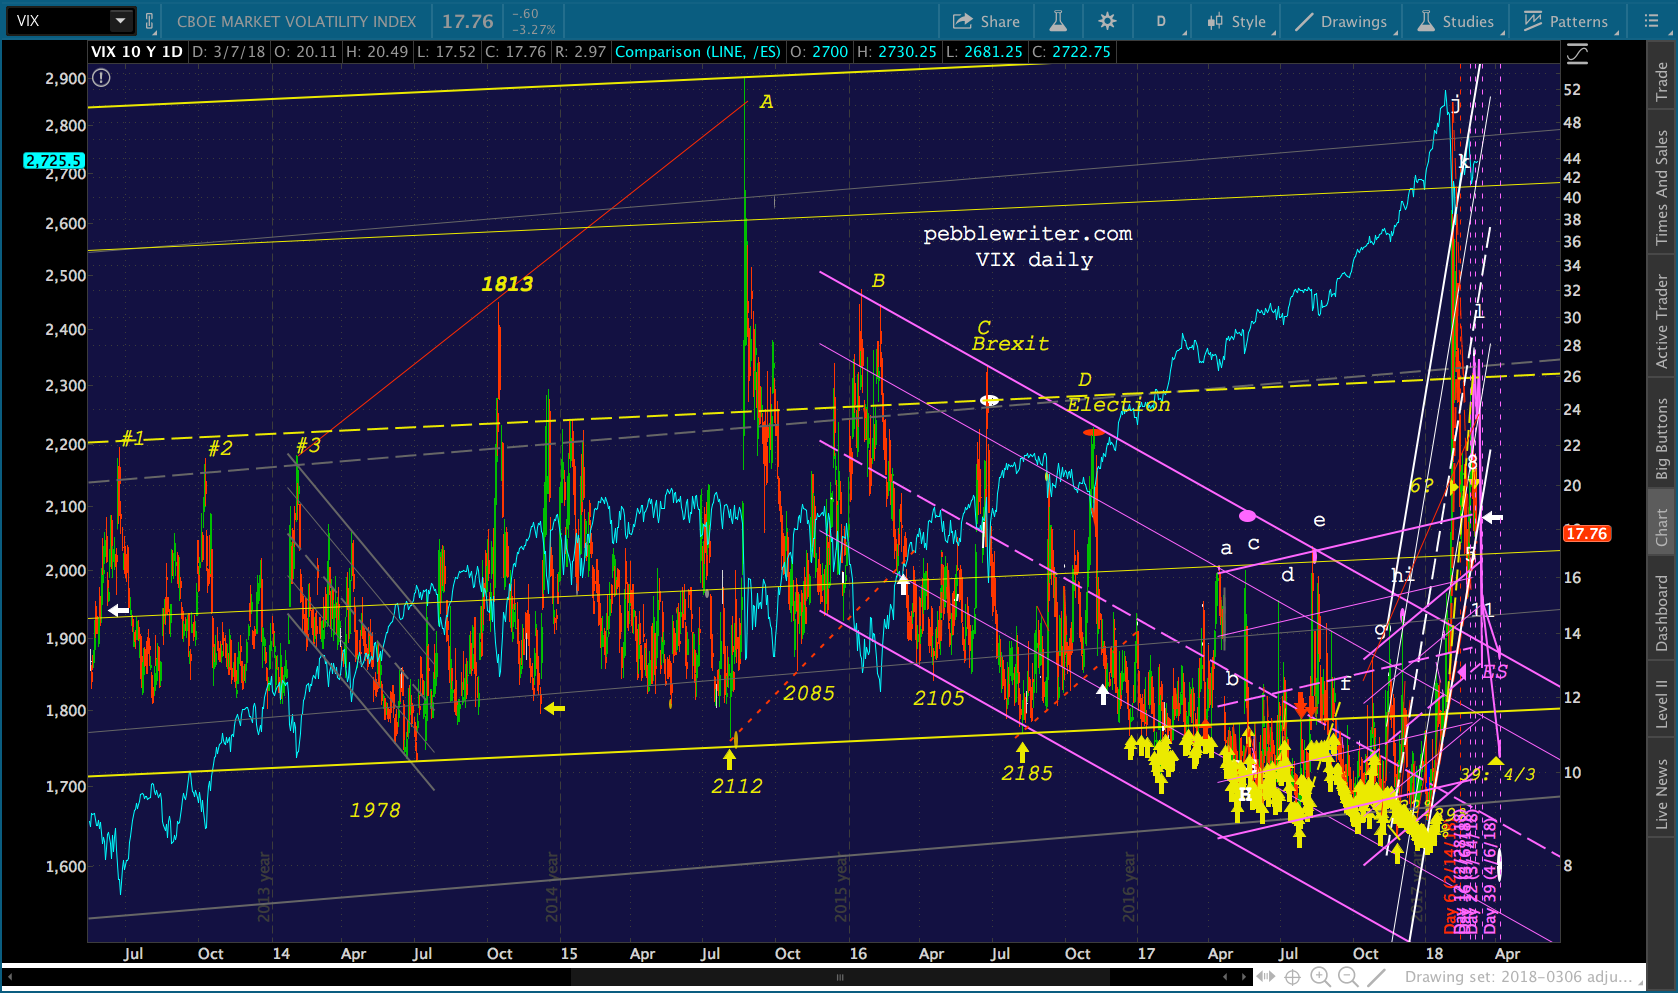 The breakout past Point D was so powerful because, in addition to declining sharply, VIX dropped through the TL connecting its lows between August and November (red, dashed.)
It was a major trend break which, combined with VIX’s obvious (by then) falling purple channel, sent RUT soaring past its 2015 highs to its smaller scale 1.272 extension at 1392 — +20% in one month.
Here, though, it ran into not only the 1.272 but the yellow trend line, too. So, we saw a series of sharp drops and trend line breaks in VIX (letters a thru l) which either propped it up or helped it move through resistance. The last big move was from Point e, which was also the red channel bottom. 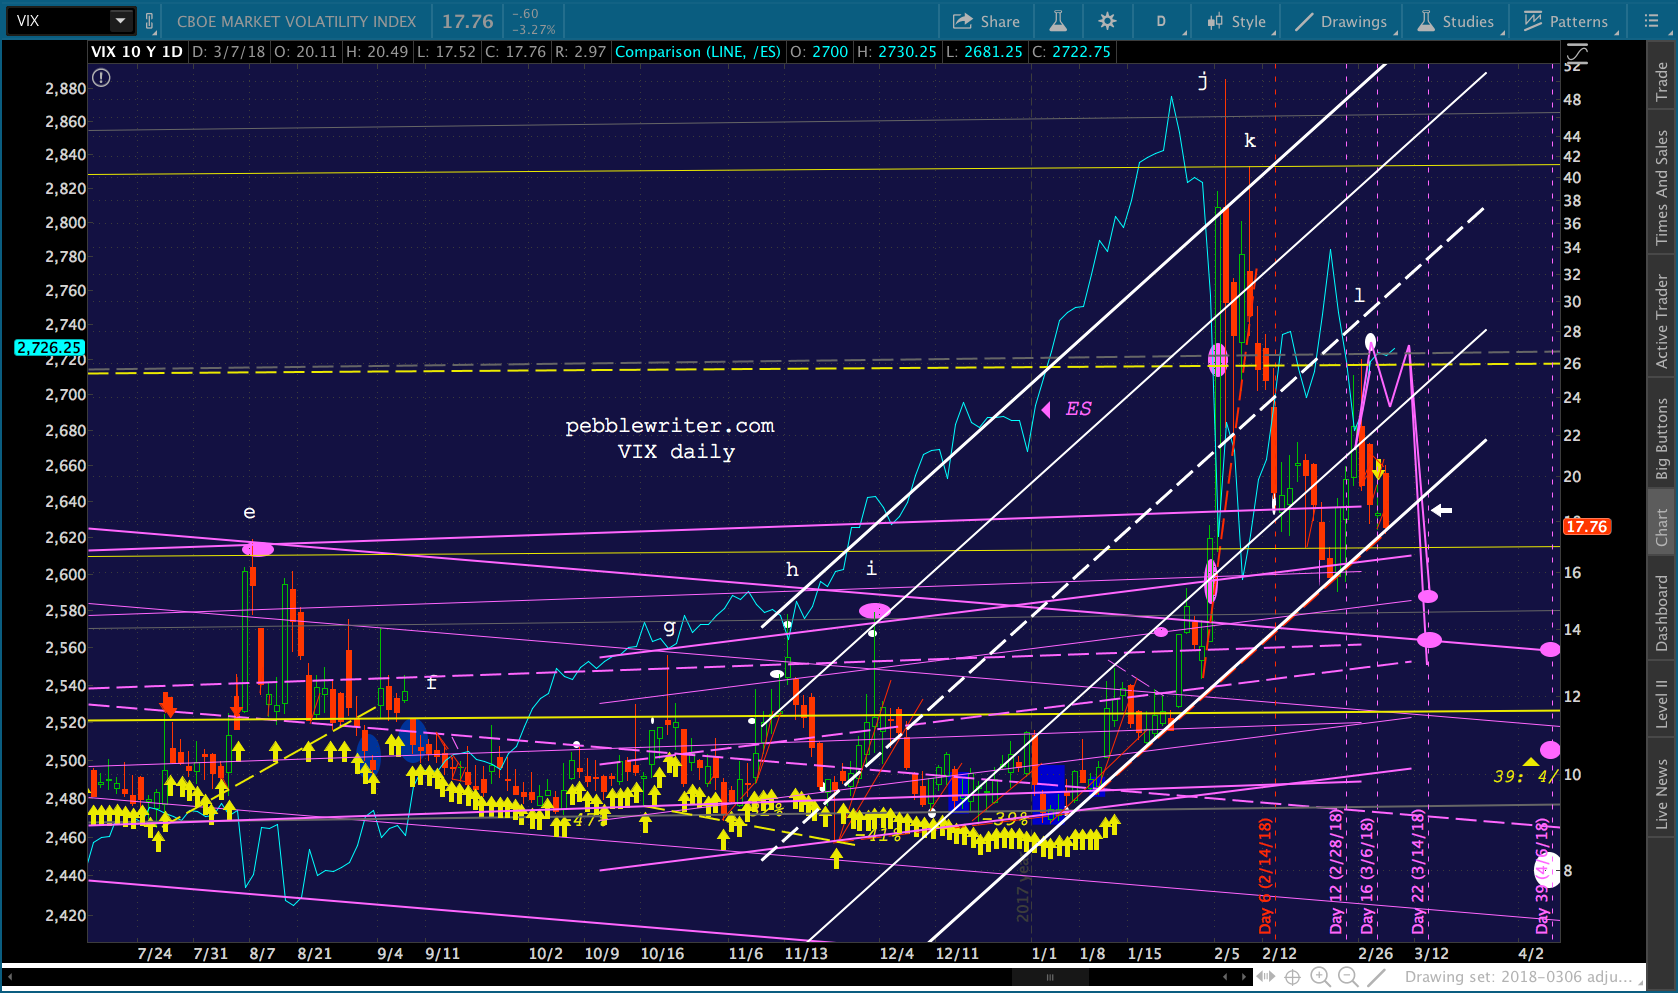 Here, VIX not only fell sharply but broke a trend line. It also proceeded to register drops nearly every single day, and stayed far away from the yellow channel bottom: no tags for 28 sessions, and no closes above the channel for 46 sessions. Again, this was a clear message to the algos that the coast was clear. Buy!
We saw VIX spike again at Point h — a near backtest for RUT — and, again, at Points j and k. RUT’s two plunges which ultimately saw it backtest the yellow TL and its SMA200 in one fell swoop.
By now, members are very familiar with our analog and VIX’s current situation. Since Jan 4, it has repeatedly returned to the bottom of a rising channel (also works as a plain, old trend line.) Each time it does, RUT gets a little (or, big) boost.
VIX rises in the after-hours most nights — when low volume futures are easily propped up directly — so that it has a higher perch from which to decline during the day, when algos can influence more volume.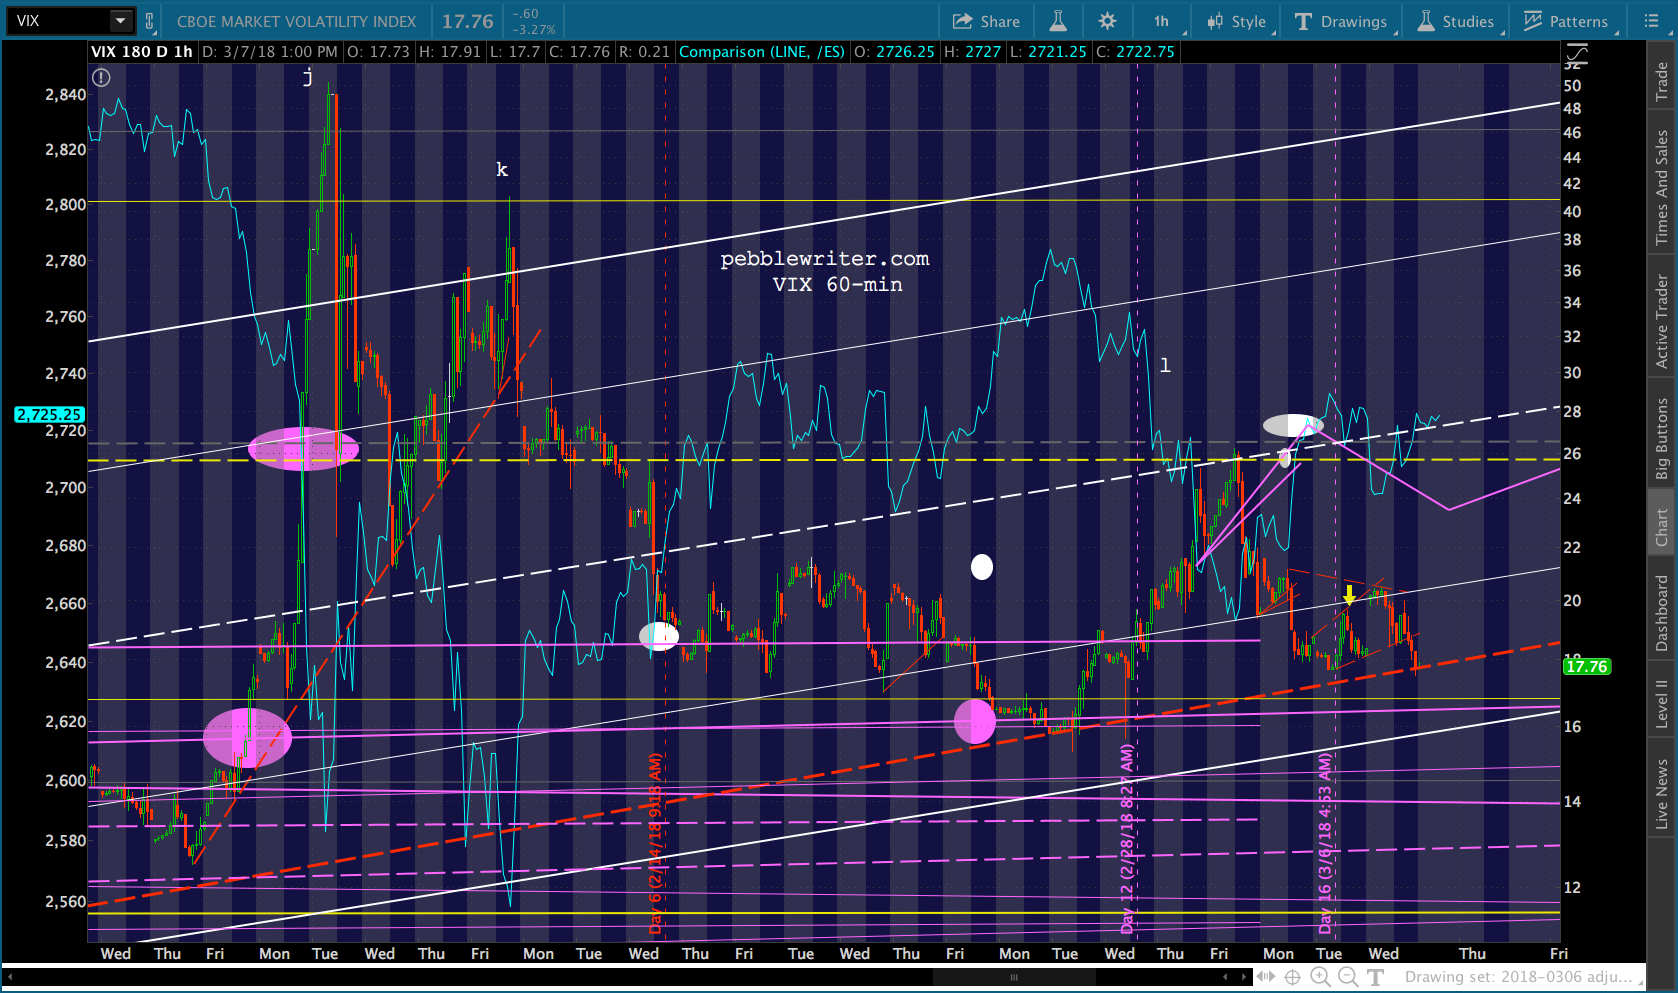 This channel bottom / trend line from Jan 4 is being constructed for a reason, of course. At some point, probably around Mar 14, VIX will plunge below it, thereby driving RUT up to or through the .886 at 1595 or to new highs.
If the analog holds, it might run out of steam at 1595. If it breaks from the analog, we could see the 1.272 at 1657. Would that result in a return to its recent lows as in May 2014? New lows as in Oct 2014? It’s a definite possibility. But, unless something very troubling happens in the world, you can count on VIX breaking down to facilitate it.
I’m going to take Thursday off to tend to some personal business. I will add some additional thoughts to the end of this post if something noteworthy occurs. Otherwise, I’ll be back on Friday with a look ahead at next week.
UPDATE: 10:15 AM
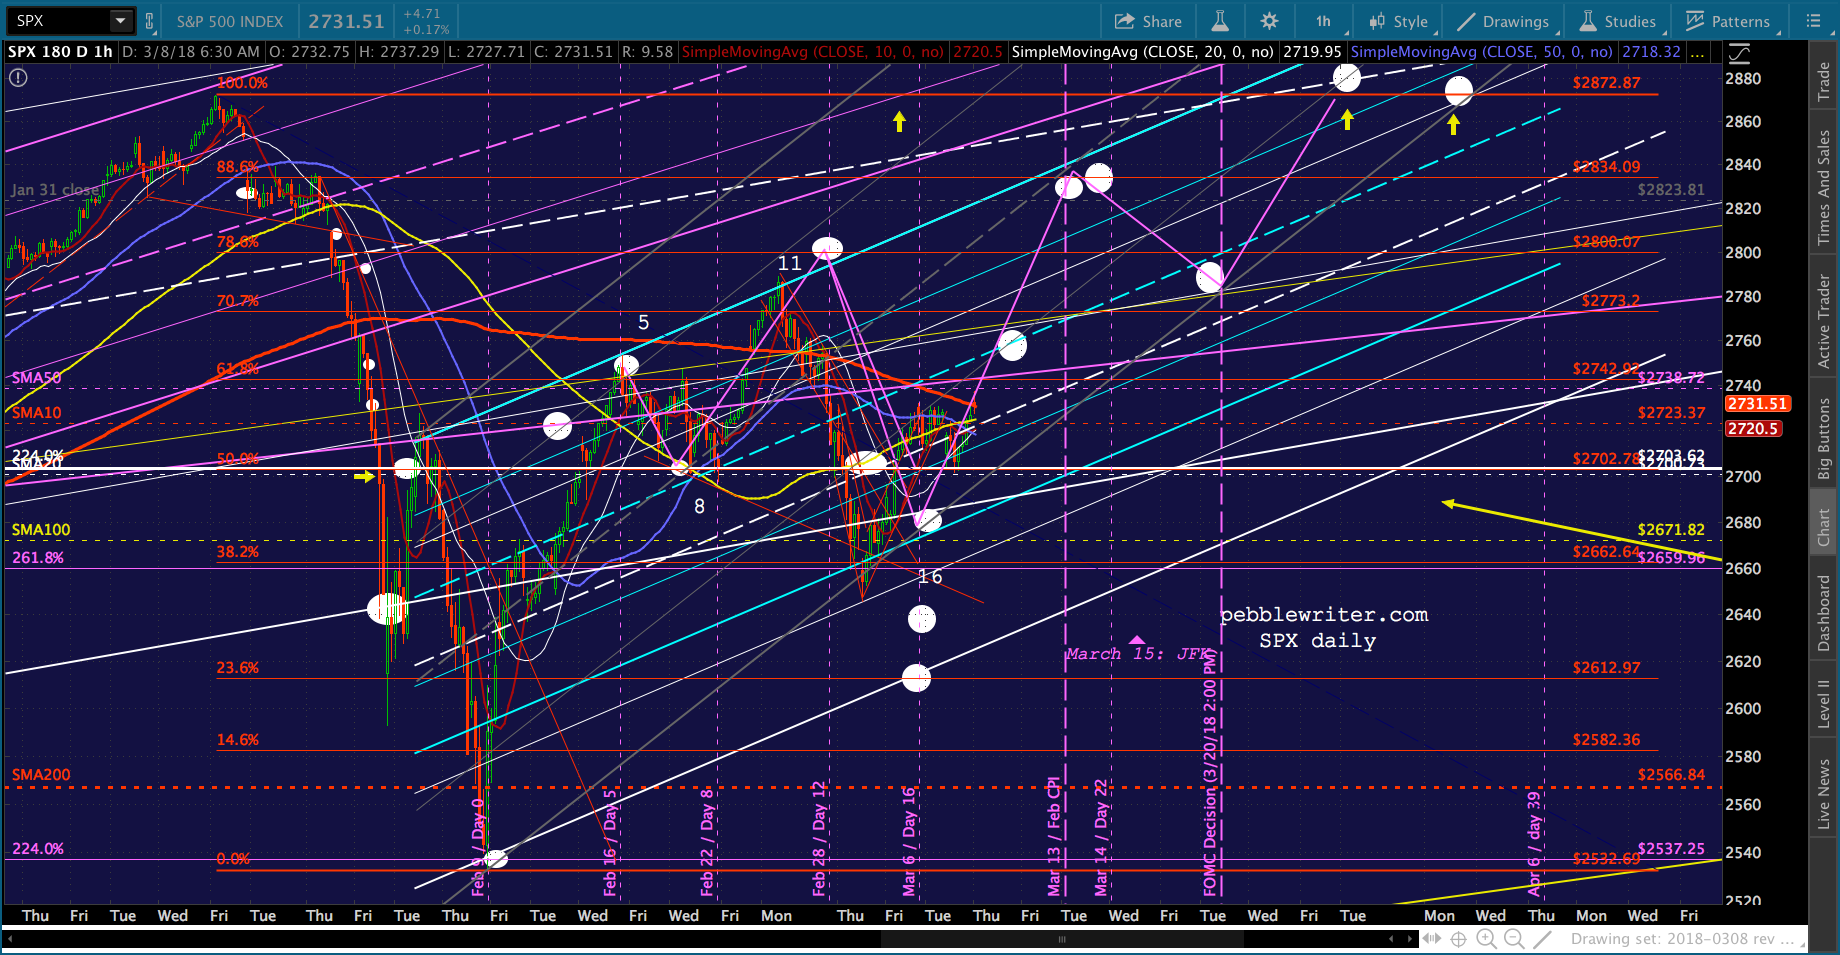
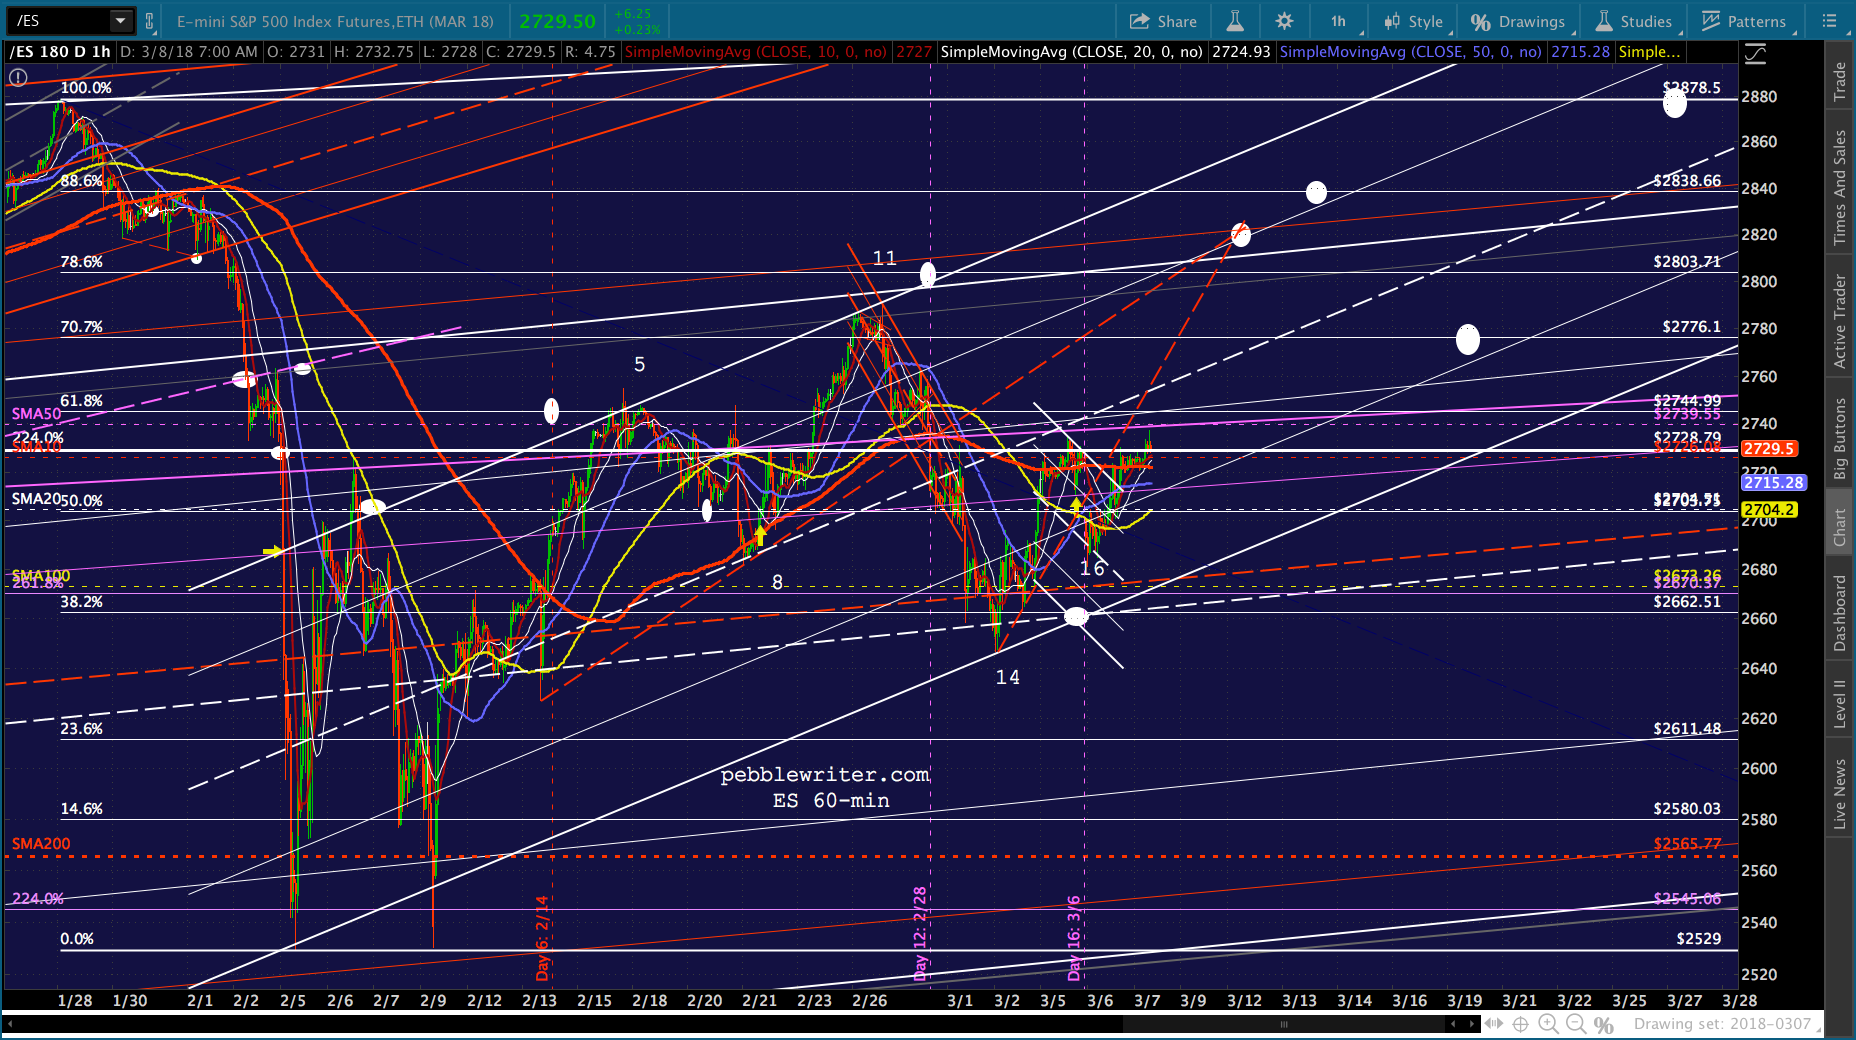
A few quick charts, just because there’s trouble brewing. VIX just broke down, but not to produce anything dramatic. It was needed simply to help ES and SPX break Tuesday’s highs. 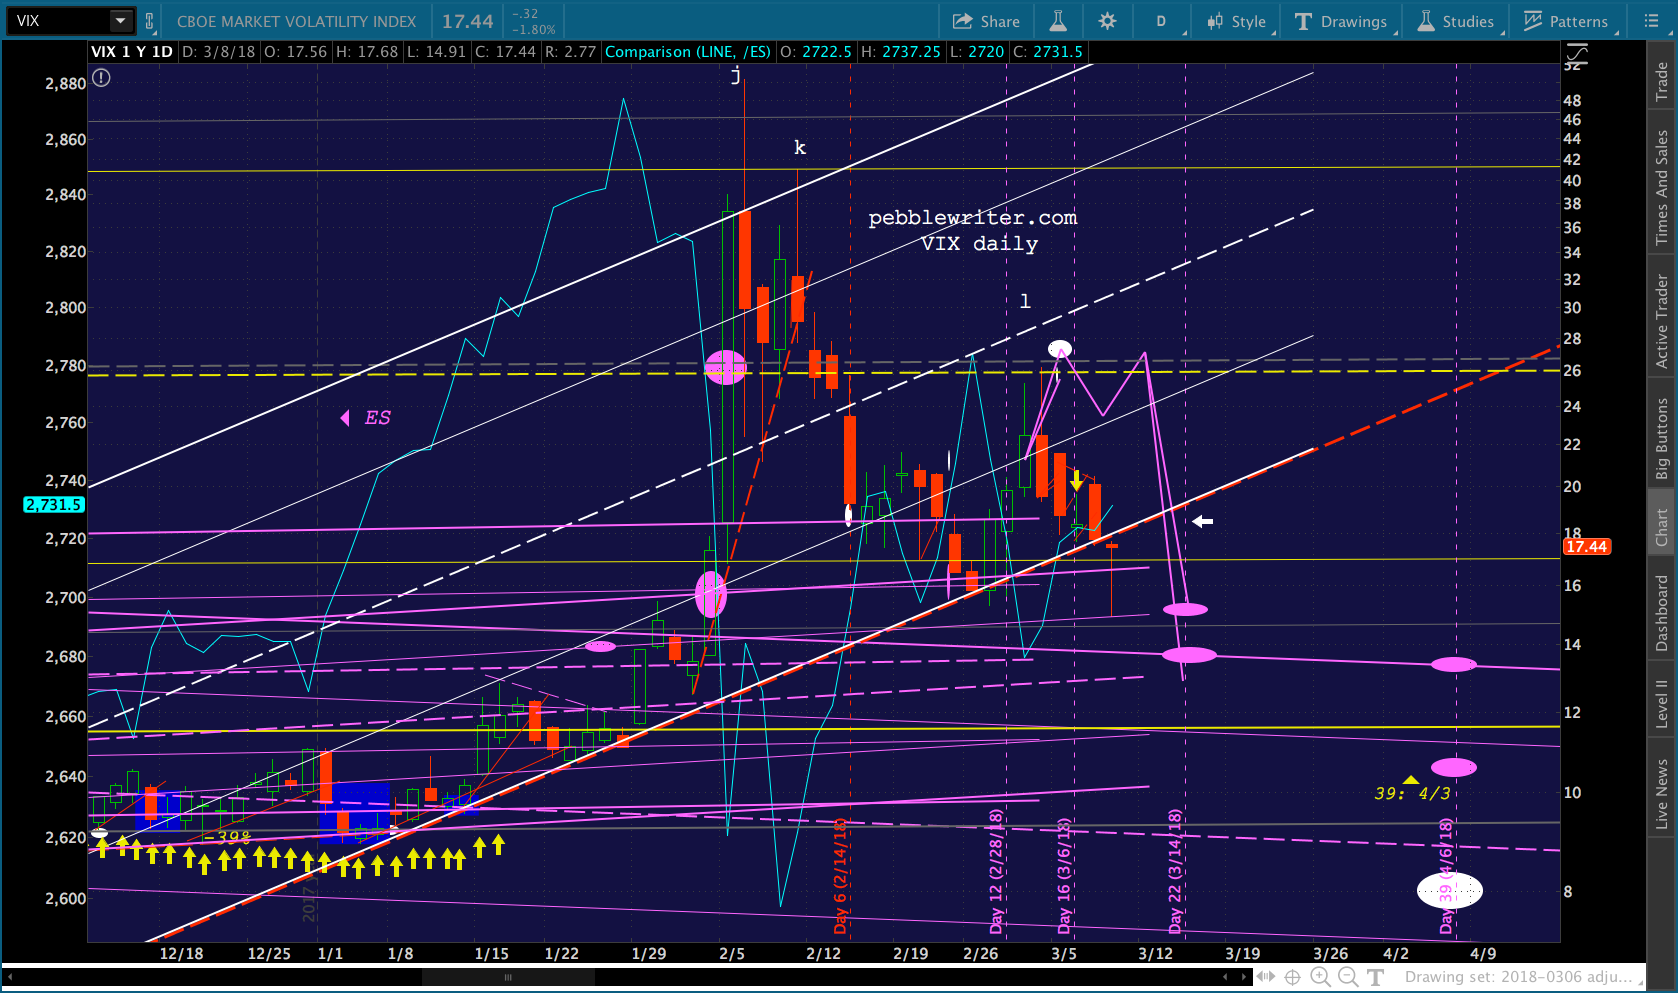
That’s a lot of firepower for something so trivial — doesn’t bode well for the move to SPX 2834/ES 2838. The reason it took so much work is because CL is breaking down as expected. 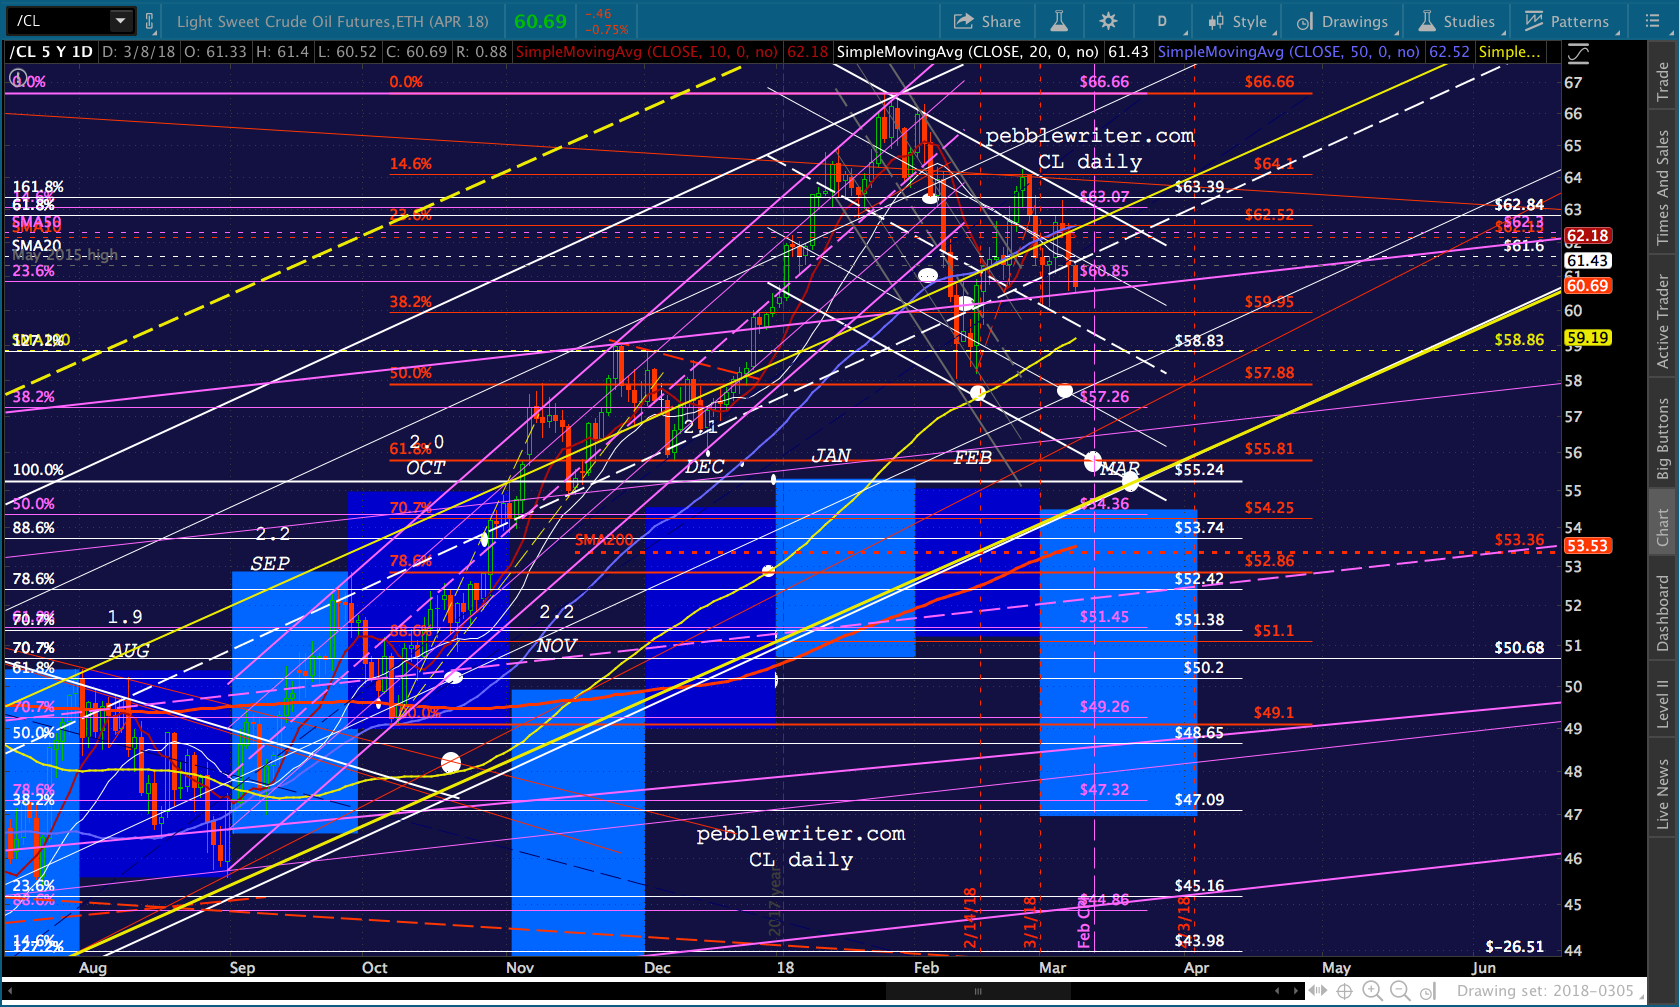
It keeps threatening to drop back into the purple channel from which it broke out on Dec 26 and again on Feb 14. It needs to drop further to produce the CPI results the inflation-fearing crowd will find acceptable — hence the lower targets.
Note that TNX continues to drop every time CL does — both poised for capitulation. 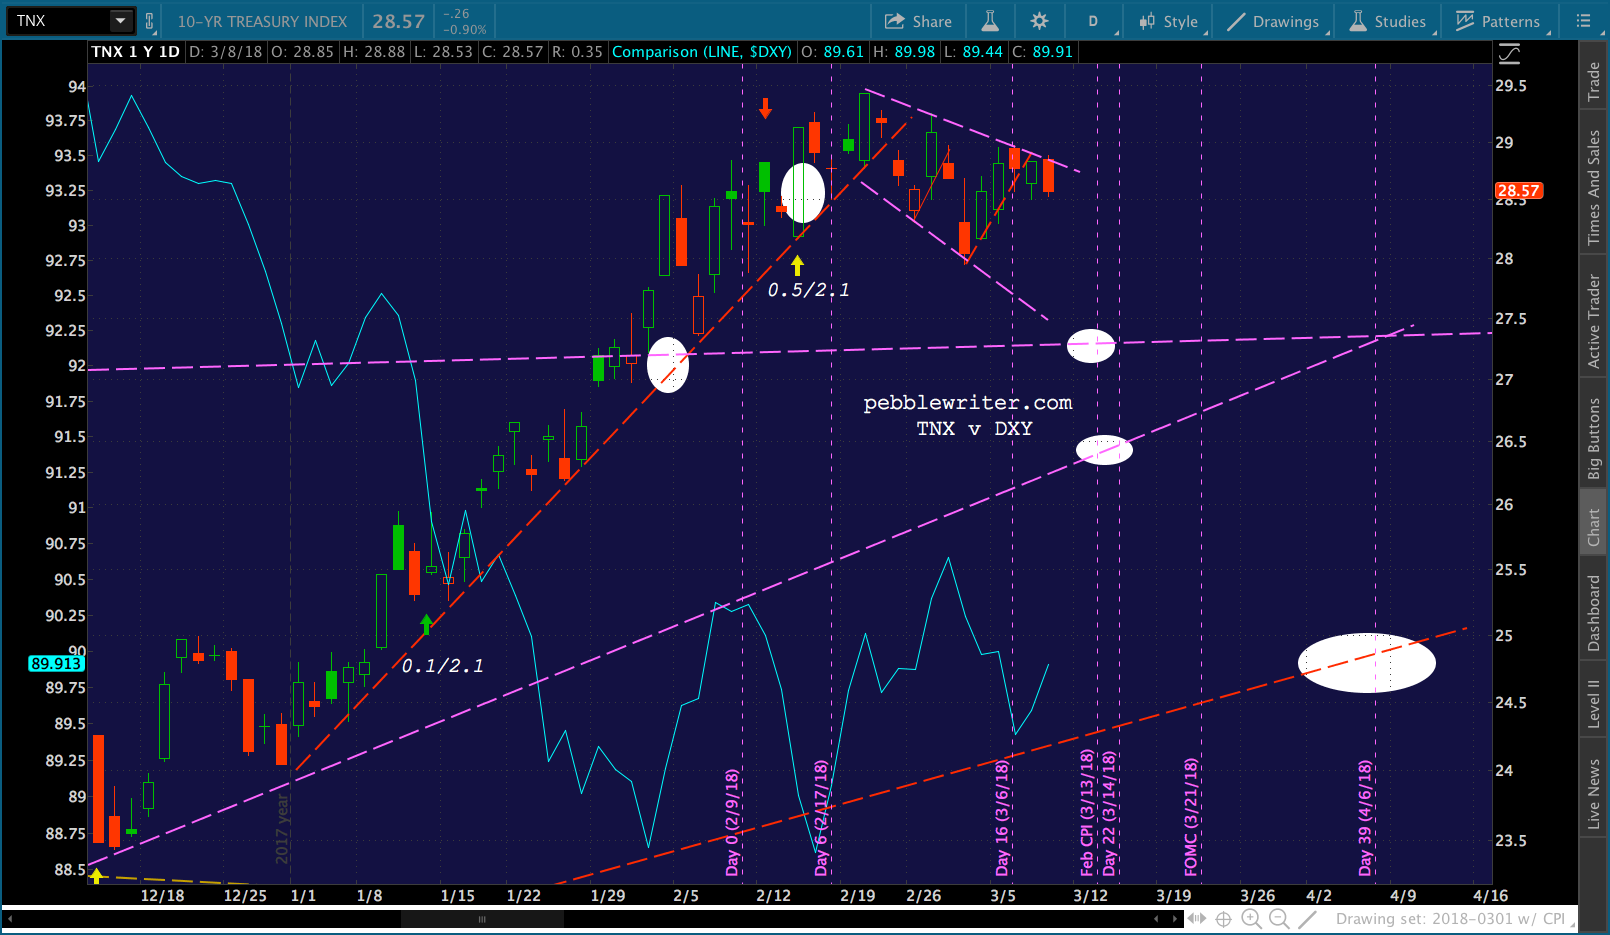 But, for now, CL’s drop is a serious drag on stocks and is robbing VIX of its firepower.
 About the only other trick left is the USDJPY, which is indeed rallying — but, preventing DXY from tagging firm support at the purple channel bottom.
 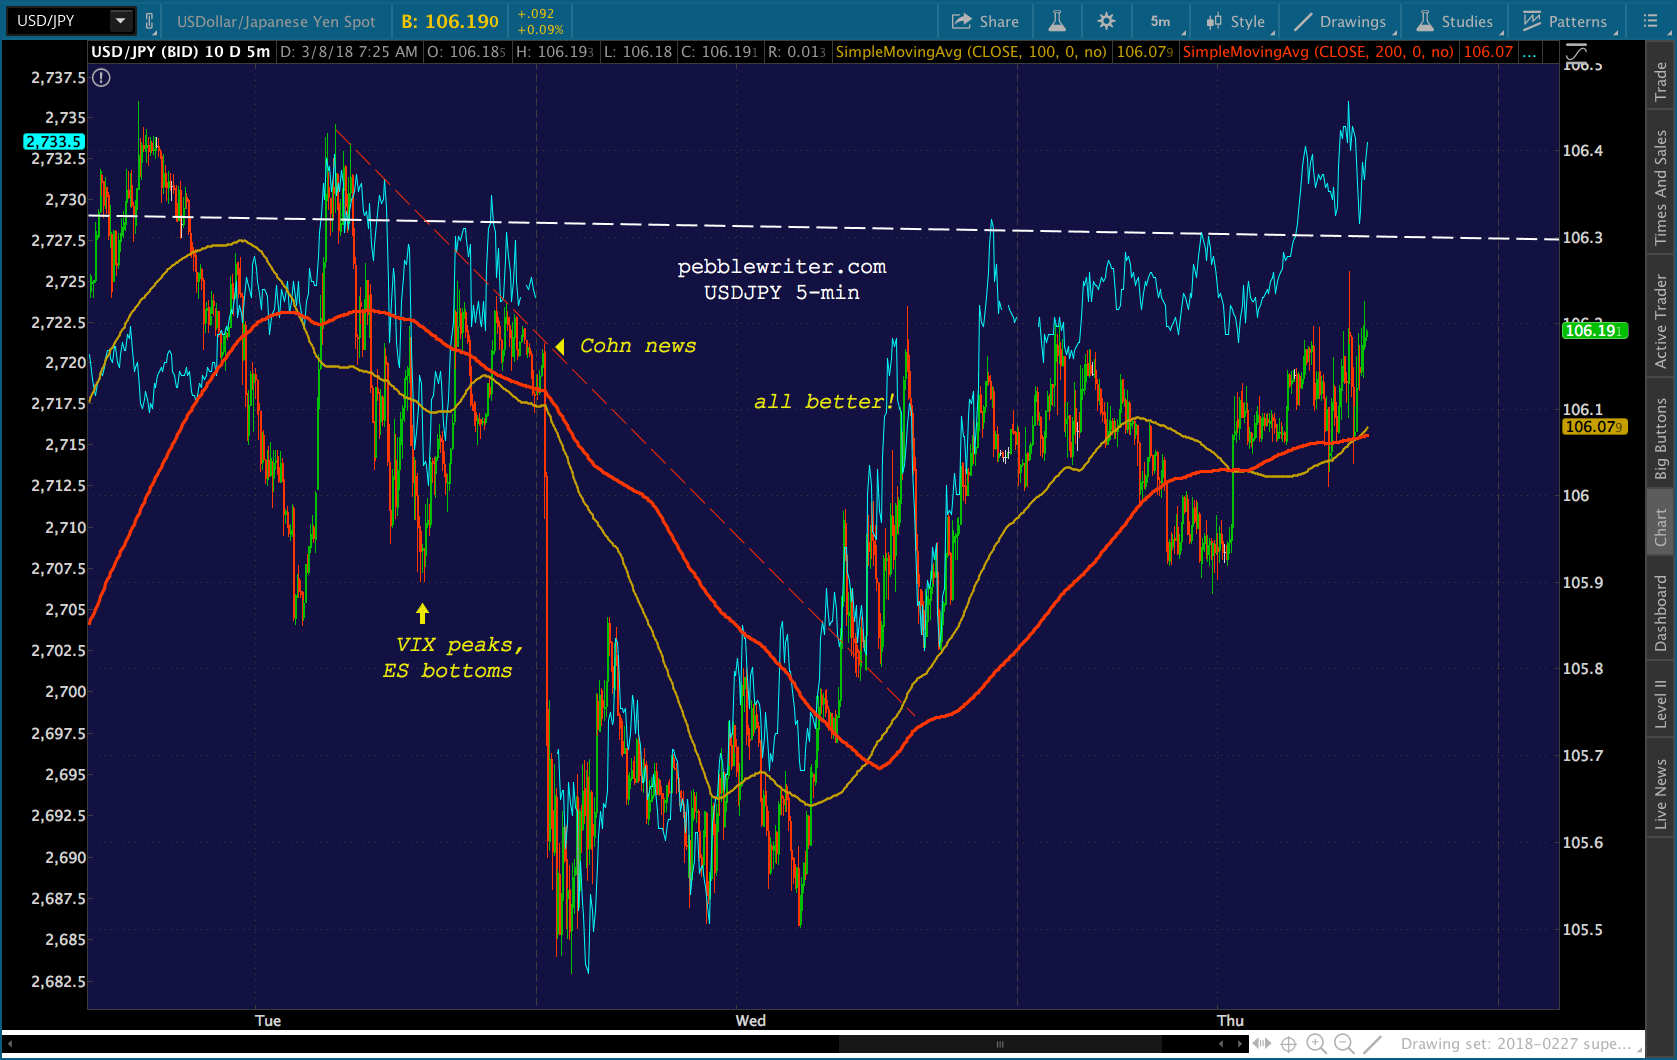 Likewise, EURUSD will probably keep drifting until it finds that firm overhead resistance at the channel top.
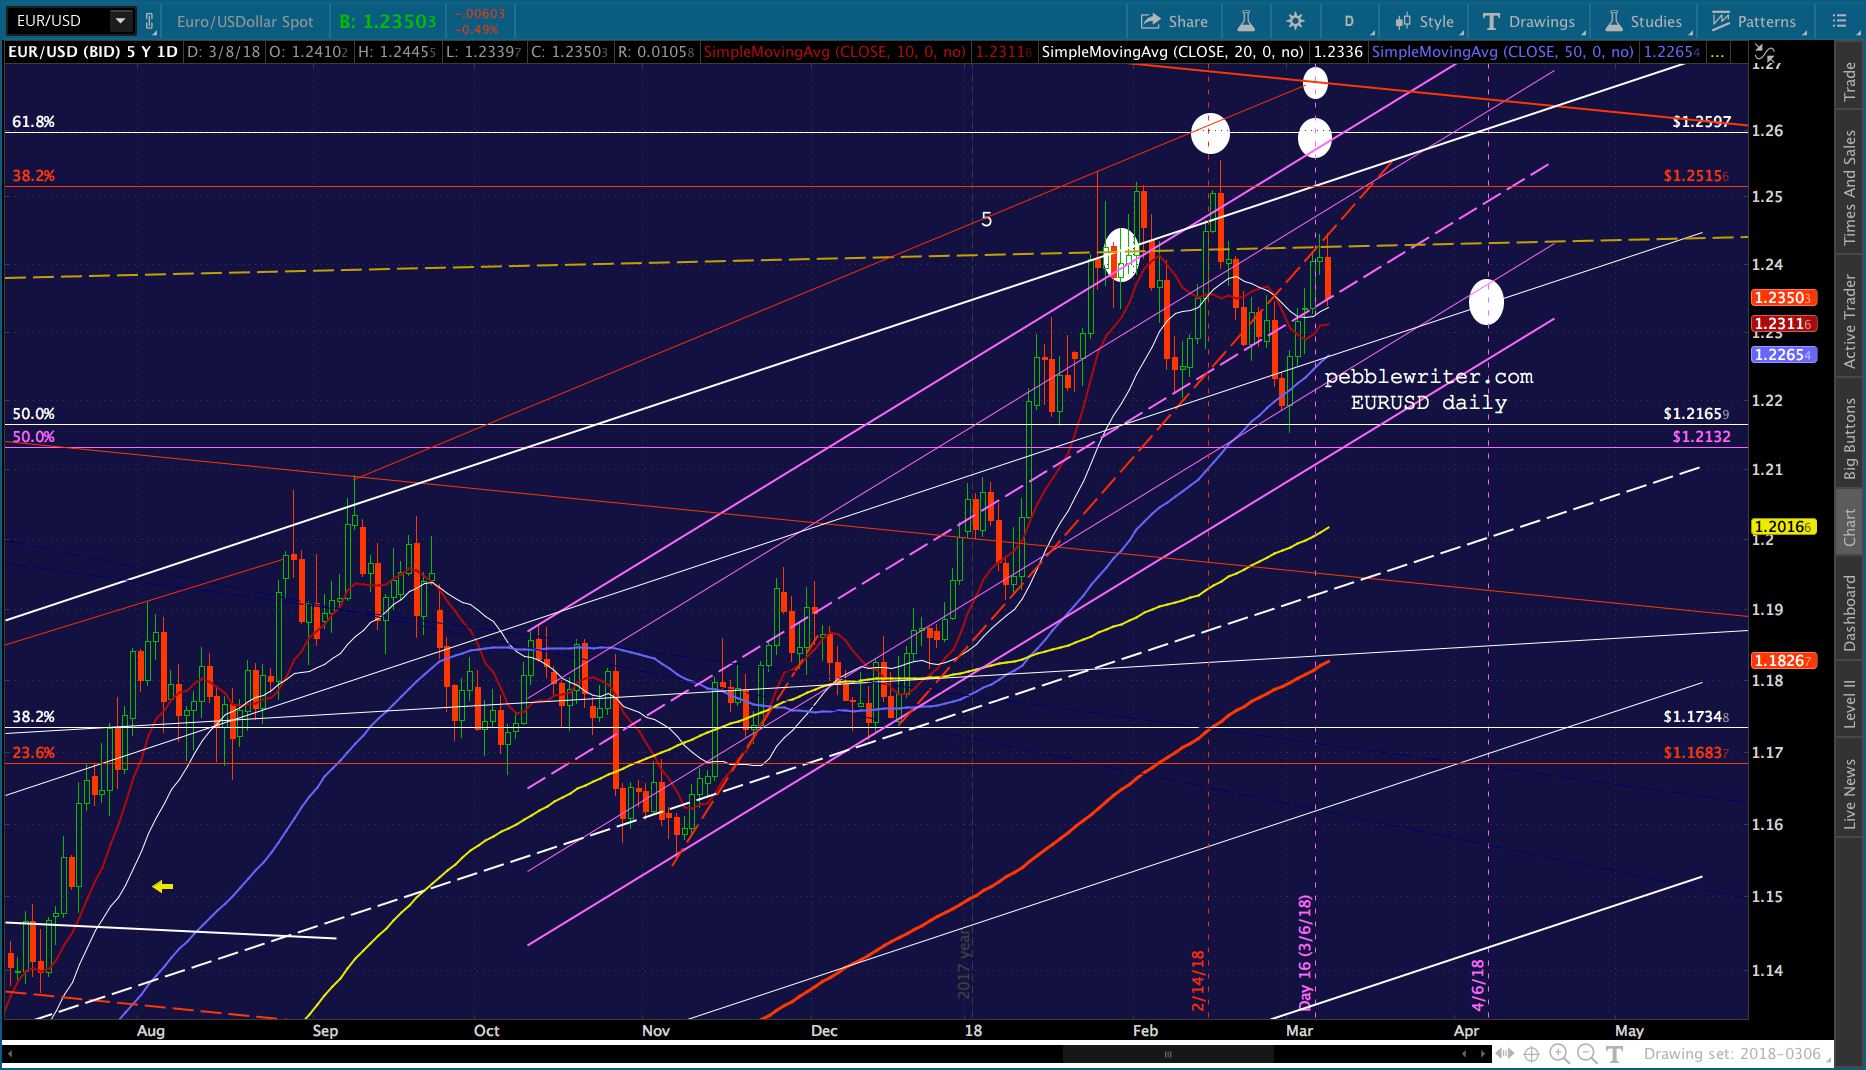 I’m going to sign off for the day. I won’t be monitoring charts, so please keep an eye on your stops.
GLTA.