More fun and games from the market-rigging department…
If SPX’s rally has impressed you, check out the Nikkei. Since its Aug 26 lows, NKD is up a whopping 13.8% — more than twice SPX’s impressive 6.0%. Do what I did and google “Japan” and “economy” for the past month and you’ll see nothing but negative stories including this one which confirms a “worsening economy” even before the effects of the recent 25% increase in the consumption tax have been absorbed.
So, why the 13.8% rally? Unlike the Fed, the Bank of Japan makes no secret of the fact that it buys stocks. In fact, the BoJ and the government pension fund are the two biggest owners of stocks in the Nikkei 225.
Thanks to negative rates, investors pay the BoJ to hold their cash. So, it costs the bank nothing to buy up everything in sight. All they have to do is make sure the stocks never decline in value. This is accomplished in two ways: (a) buying more stocks (throwing good money after bad); and, (b) by manipulating the currency (the yen carry trade.)

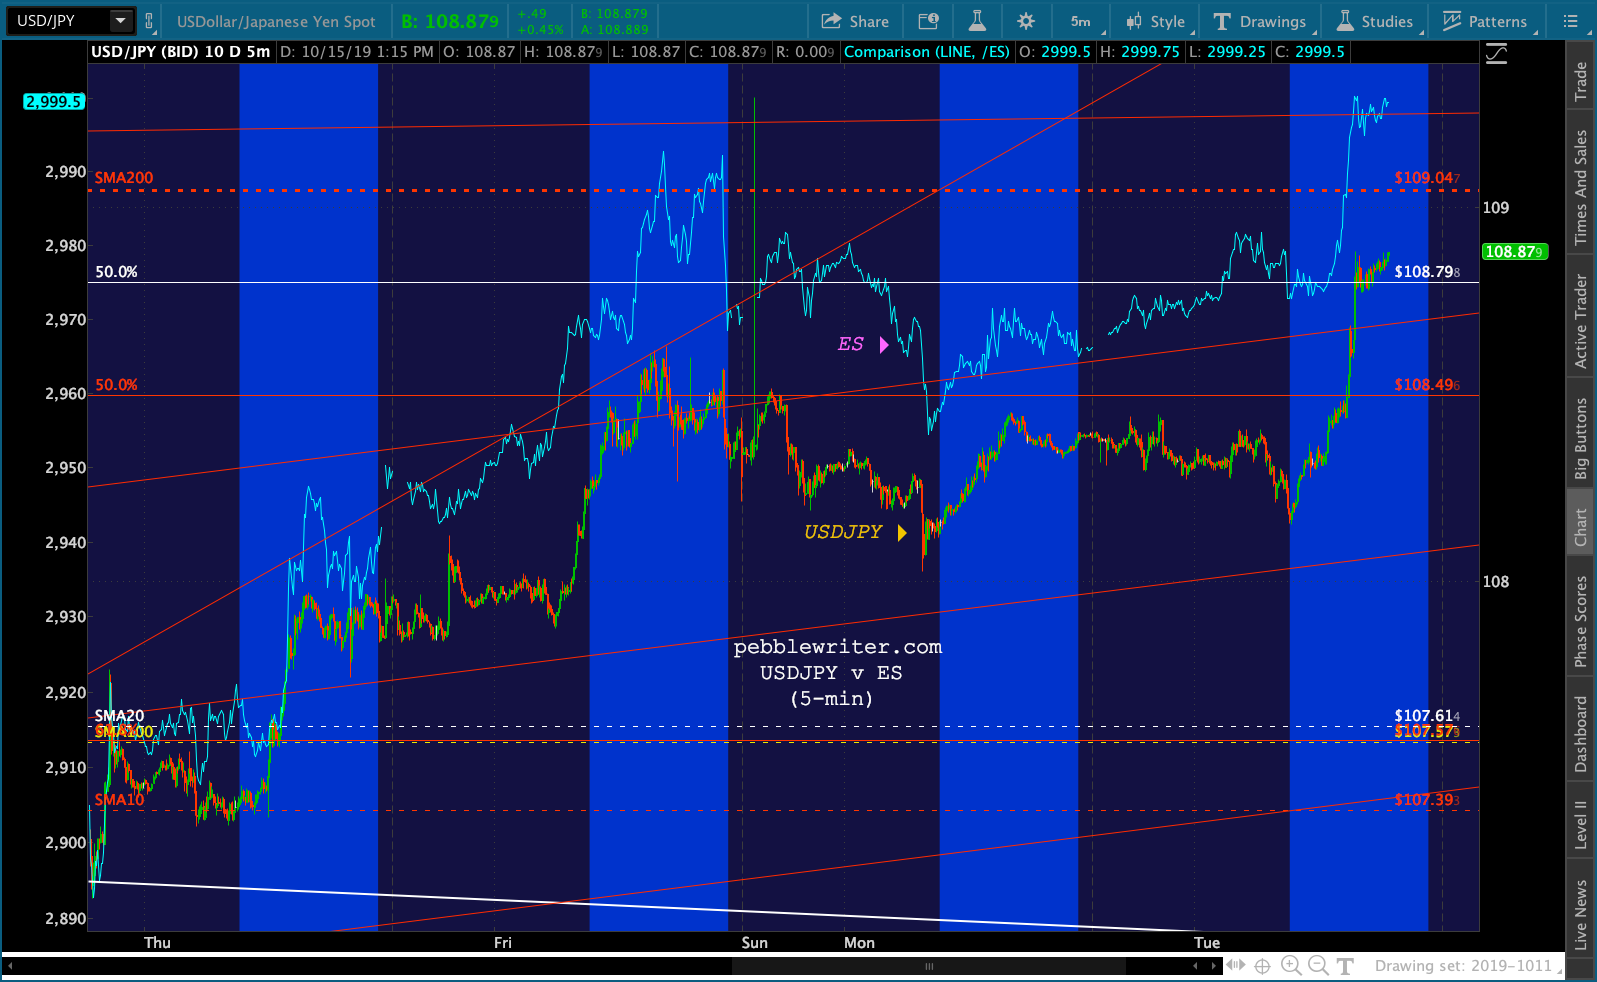
Lately, the yen carry trade has been working overtime. At some point the yen could theoretically get too cheap; so, the USDJPY is reset lower most nights when the low-volume futures markets are more easily propped up.
When the cash market opens, though, the USDJPY takes off. I’ve highlighted the period between 6:30am and 4:00pm in the chart below. The effects on the NKD are immediate. A few nanoseconds later, the S&P 500 futures join in. The algorithms which drive 90% of all US equity volume watch USDJPY like a hawk.

What happens if, for some reason, the USDJPY can’t be driven any higher or is busy resetting when extra assistance is needed? We’ve written often about the benefits derived from hammering VIX futures. Another favorite of central banks is oil futures.
As the chart below shows, it works exactly the same way as the yen carry trade. The only difference is that higher oil prices reverberate through the real economy, affecting nearly every business and consumer in fairly short order. So, the manipulation requires a little more finesse.  The Fed has its own trading desk, presumably with the ability to dabble in the futures market. Their cost of funds is essentially zero as they can print money any time they like. Imagine how fun it will be when interest rates go negative and investors pay them to drive stock prices higher.
continued for members… (more…)


 VIX did pop above the 50-DMA…for several seconds. It got better.
 Indicators such as RSI still remain on edge.
 continued for members… (more…)