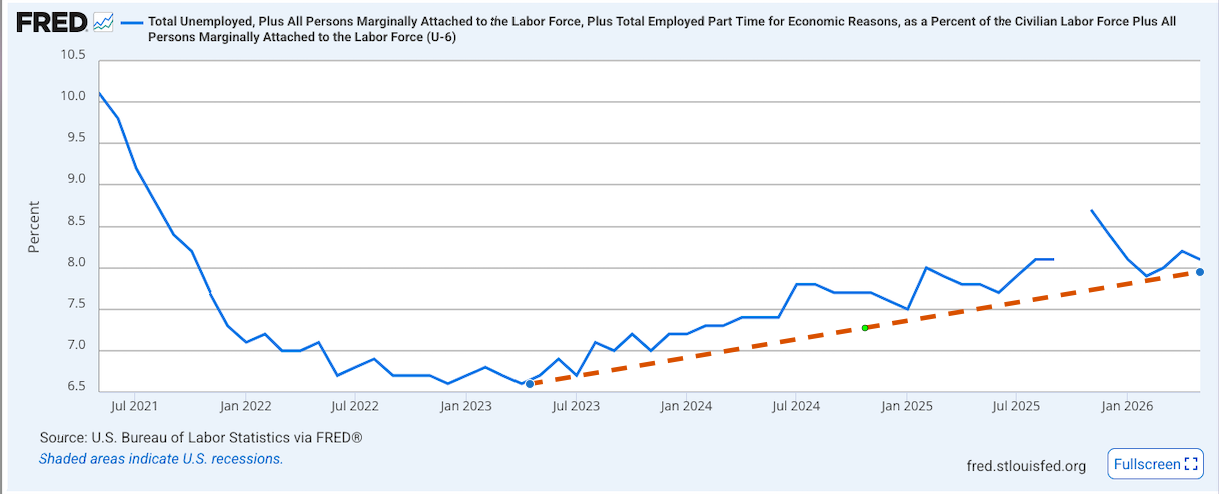
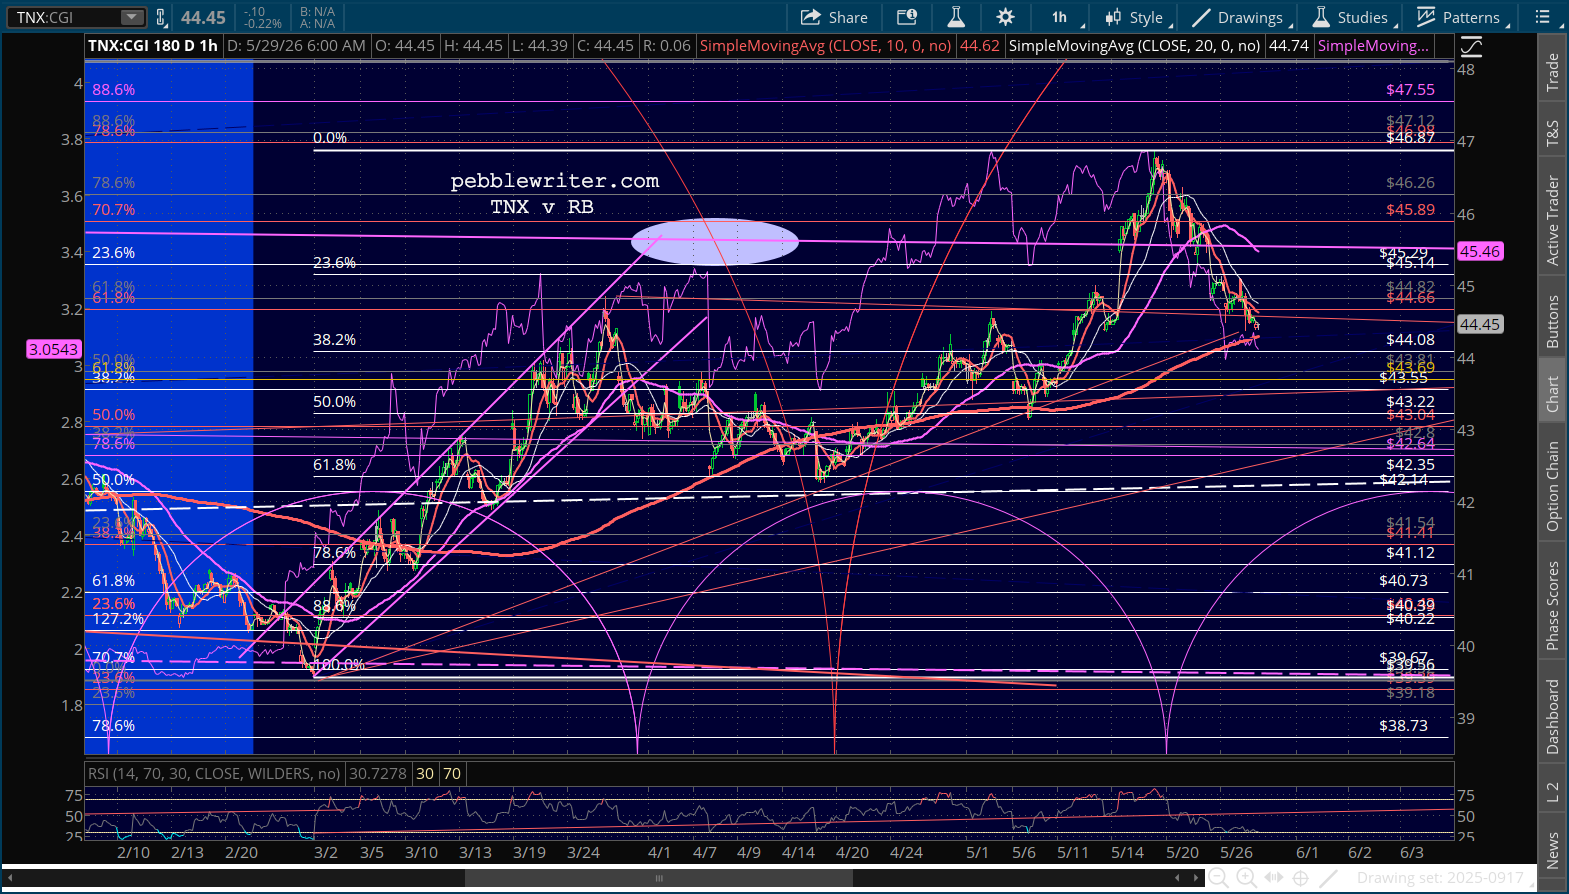
May headline CPI rose 4.2% YoY and 0.5% MoM, in line with our expectations and consensus. The YoY print was the highest since Apr 2023 and well above this past April’s 3.8%.
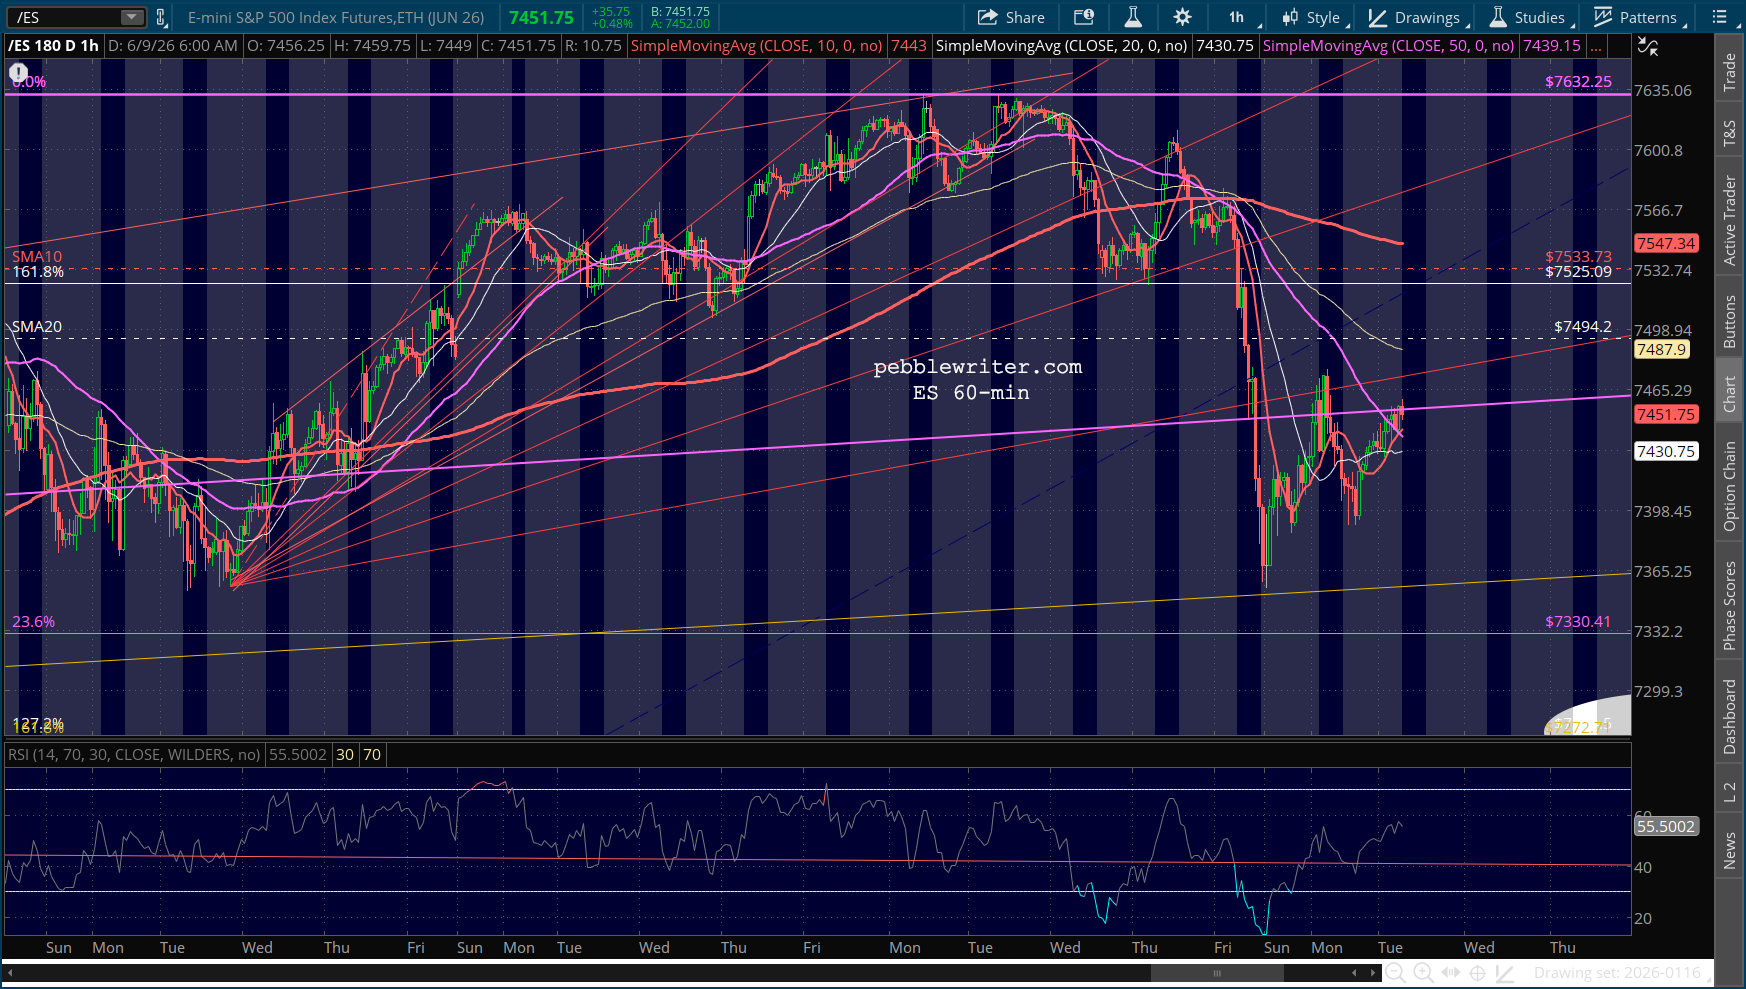
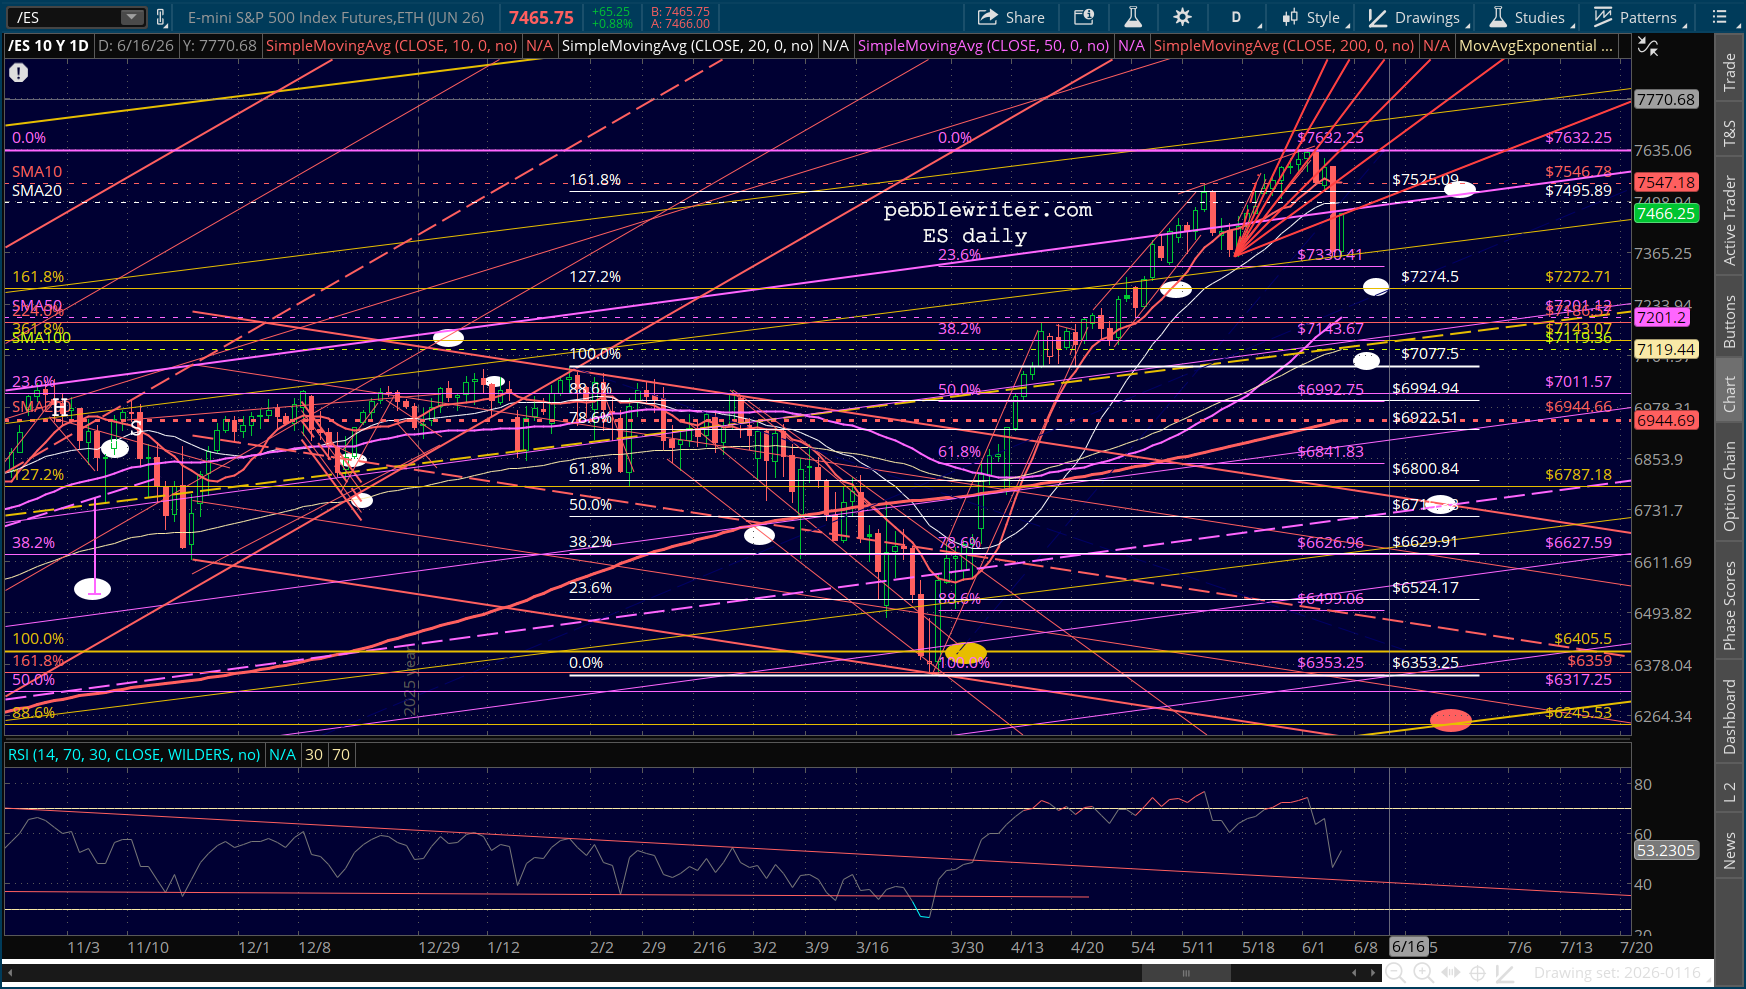
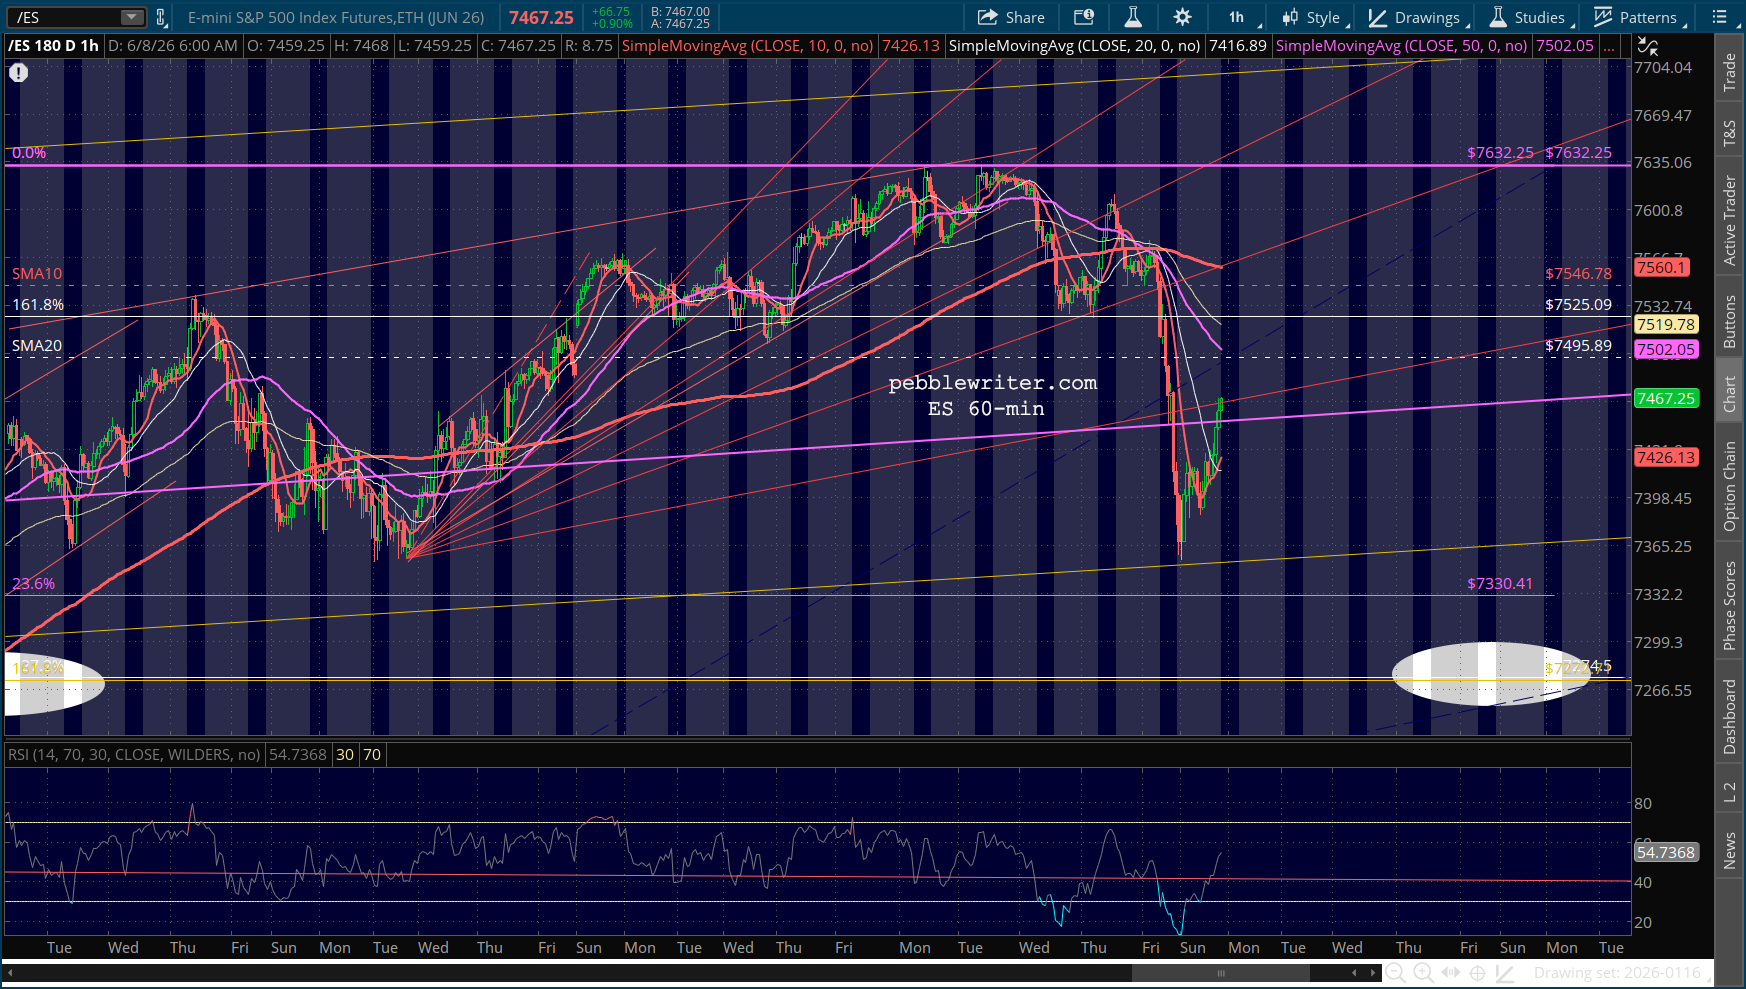
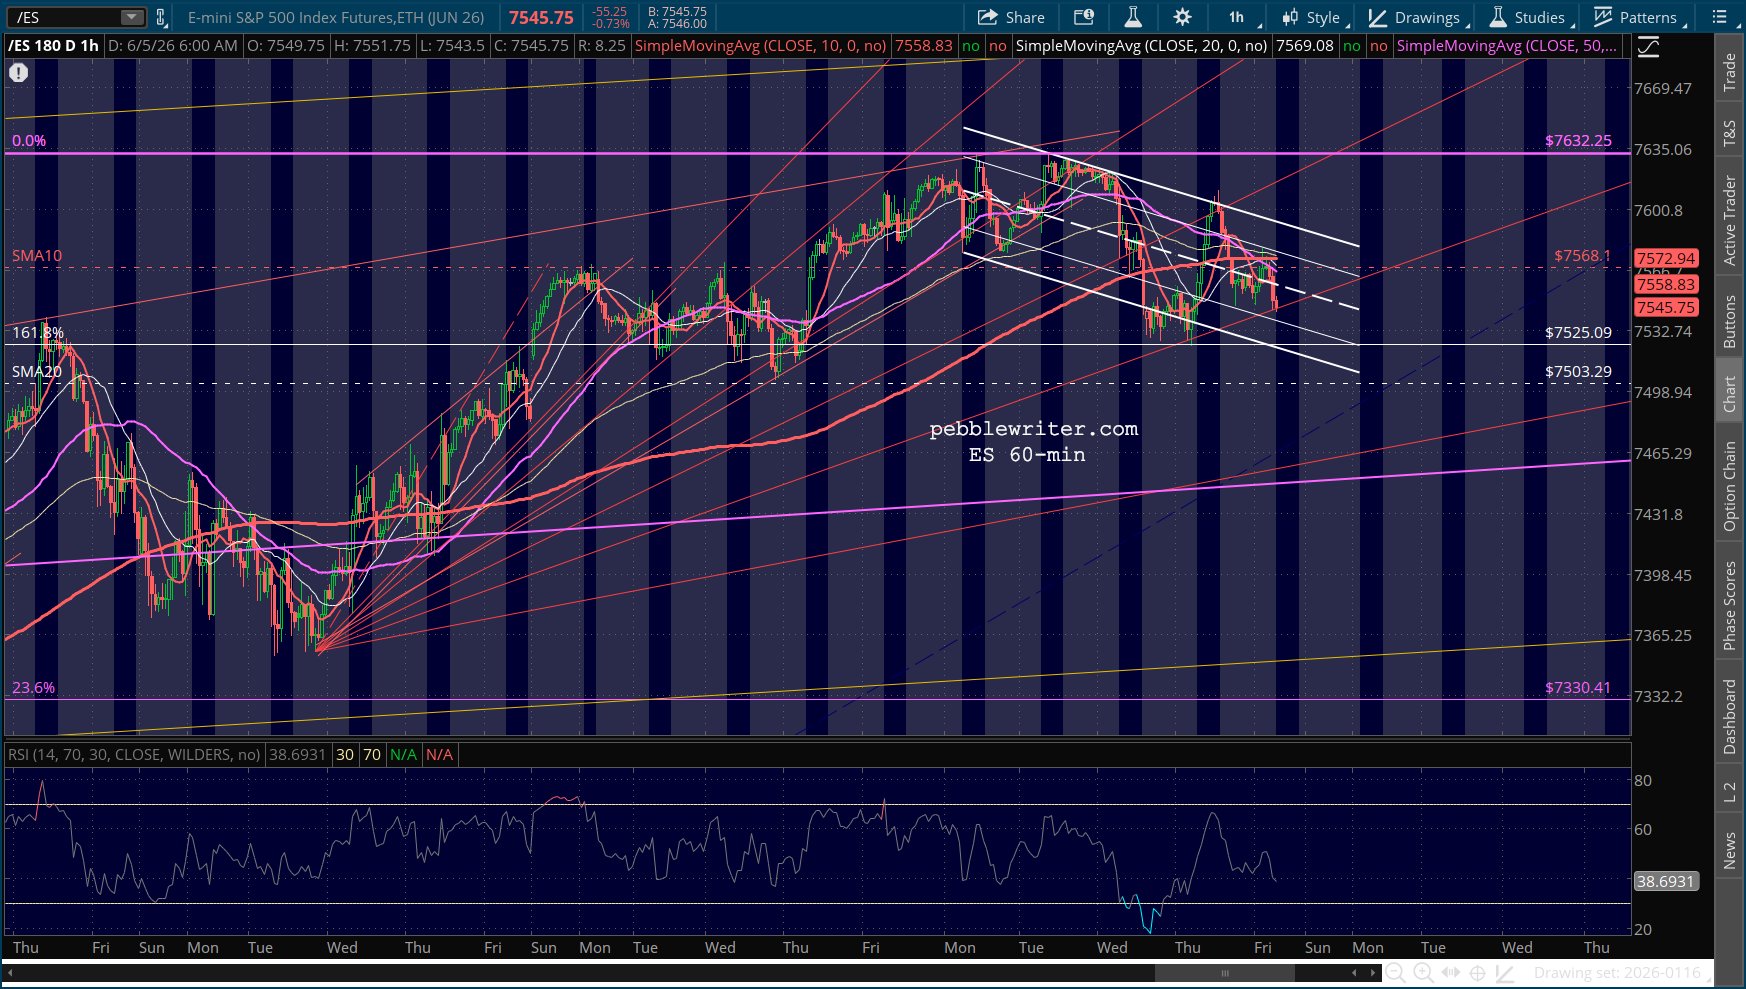
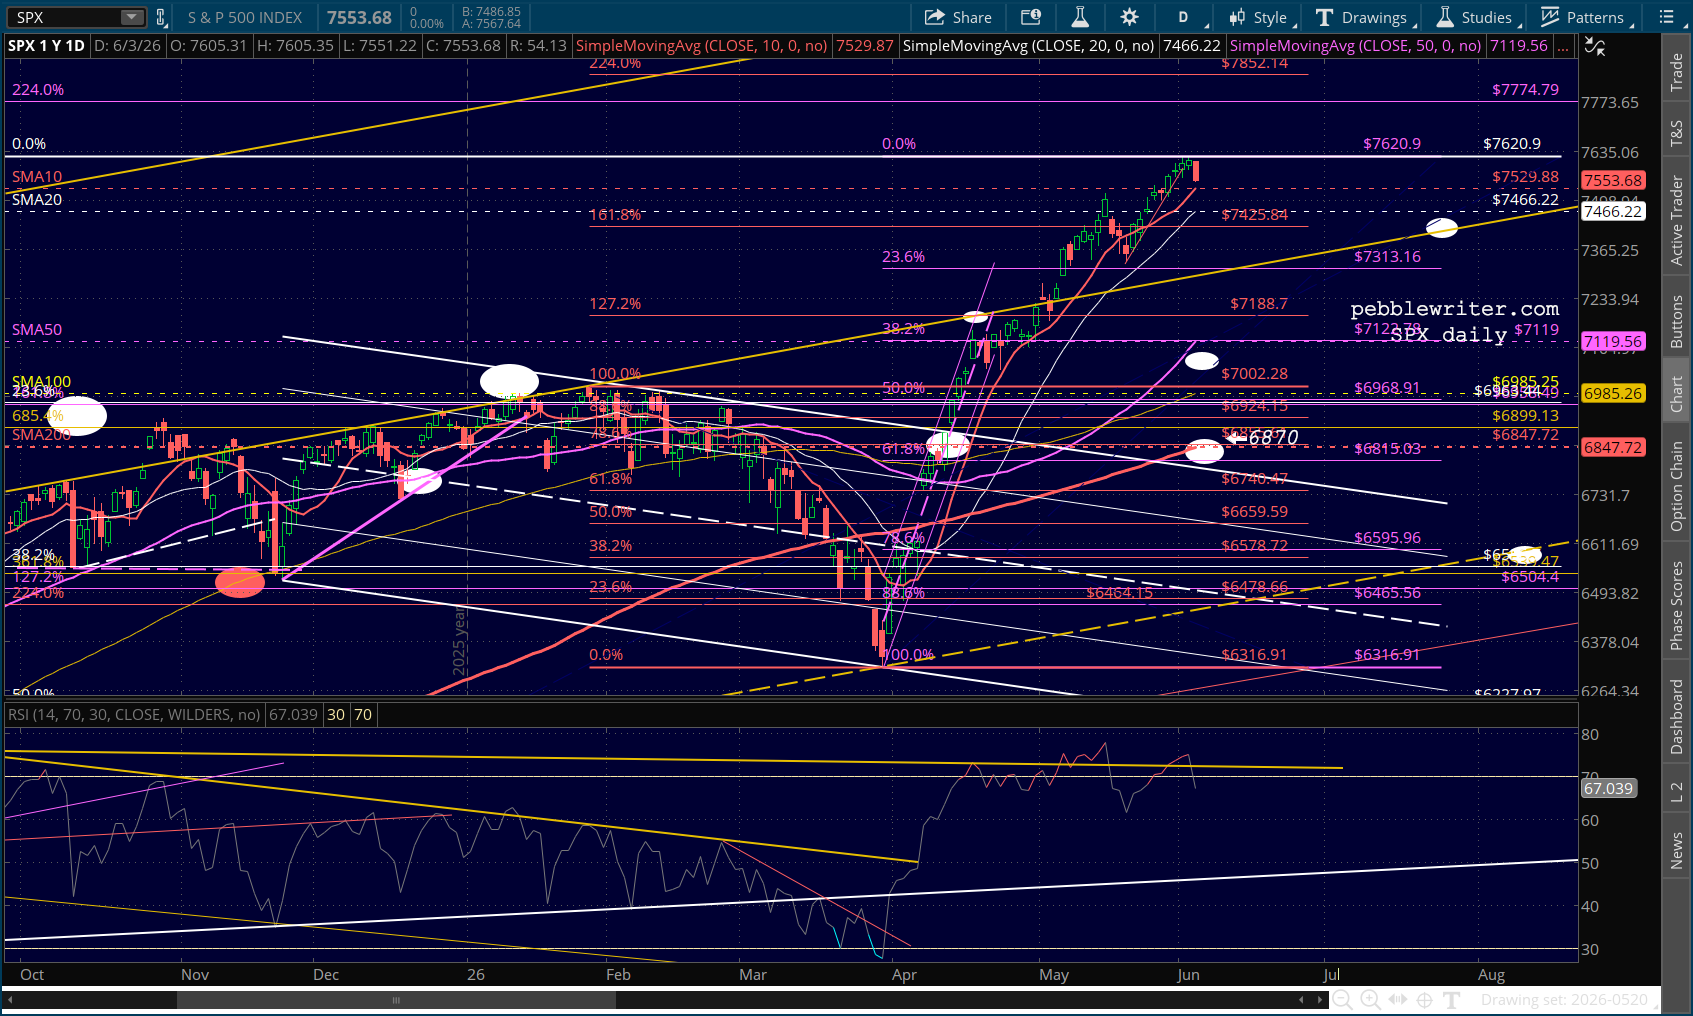
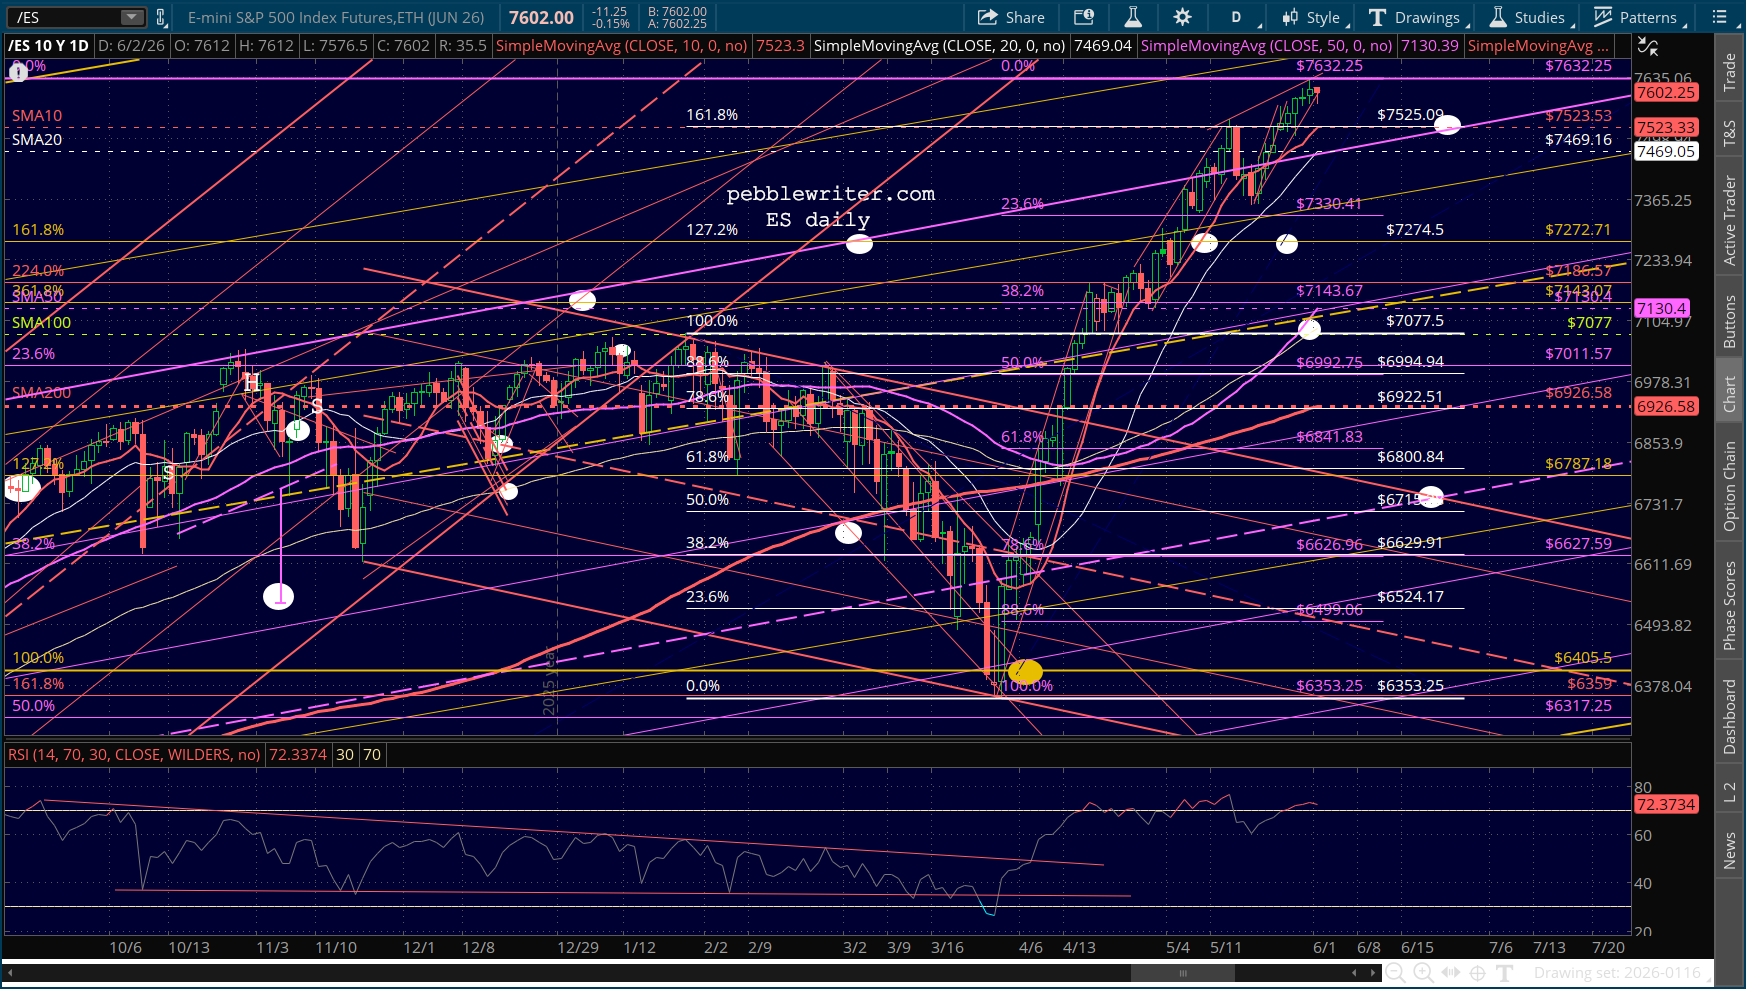
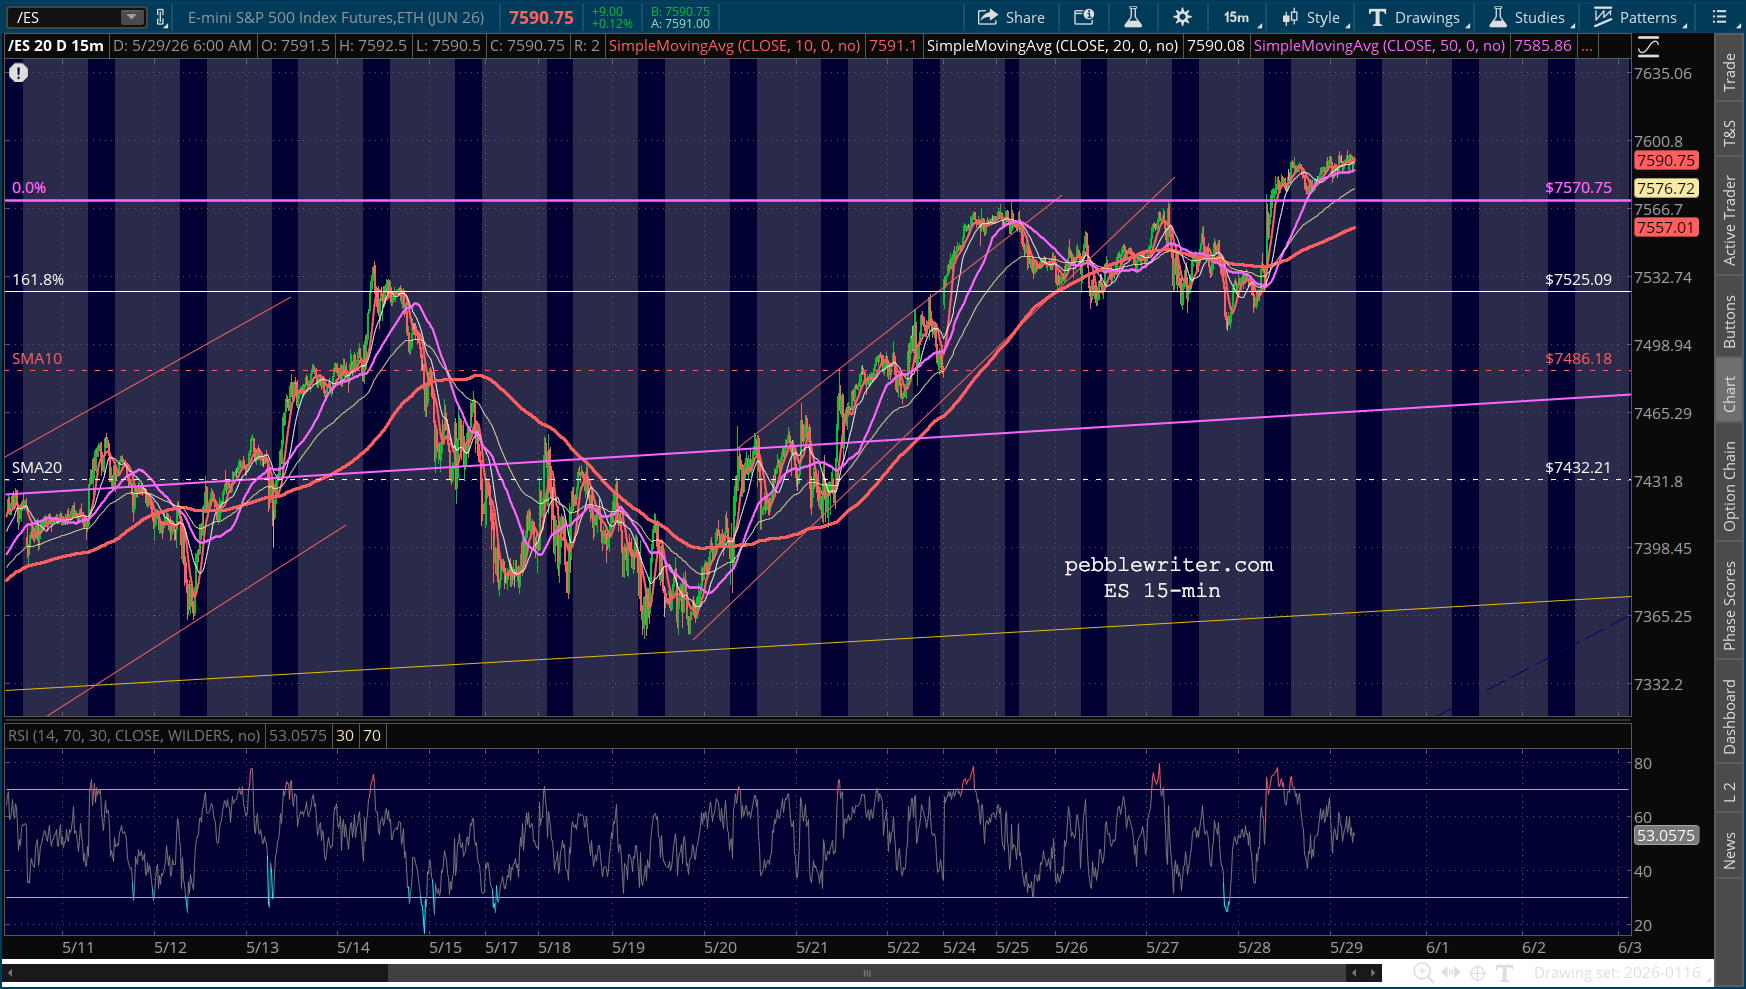
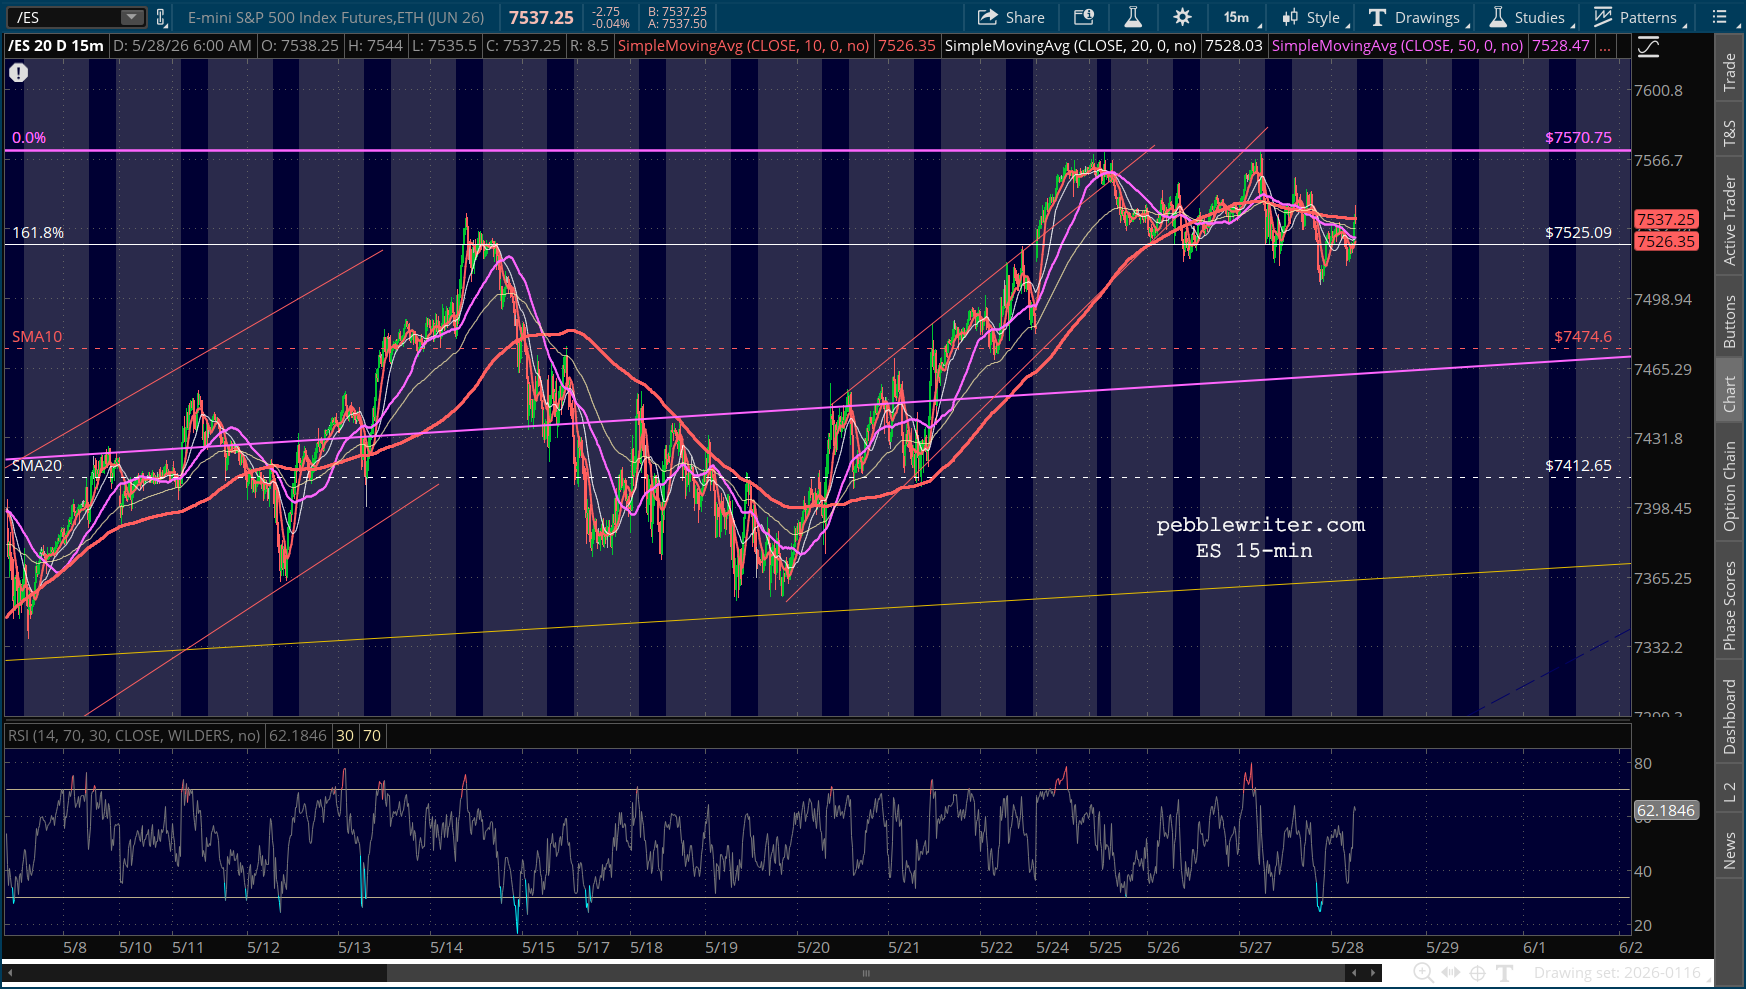
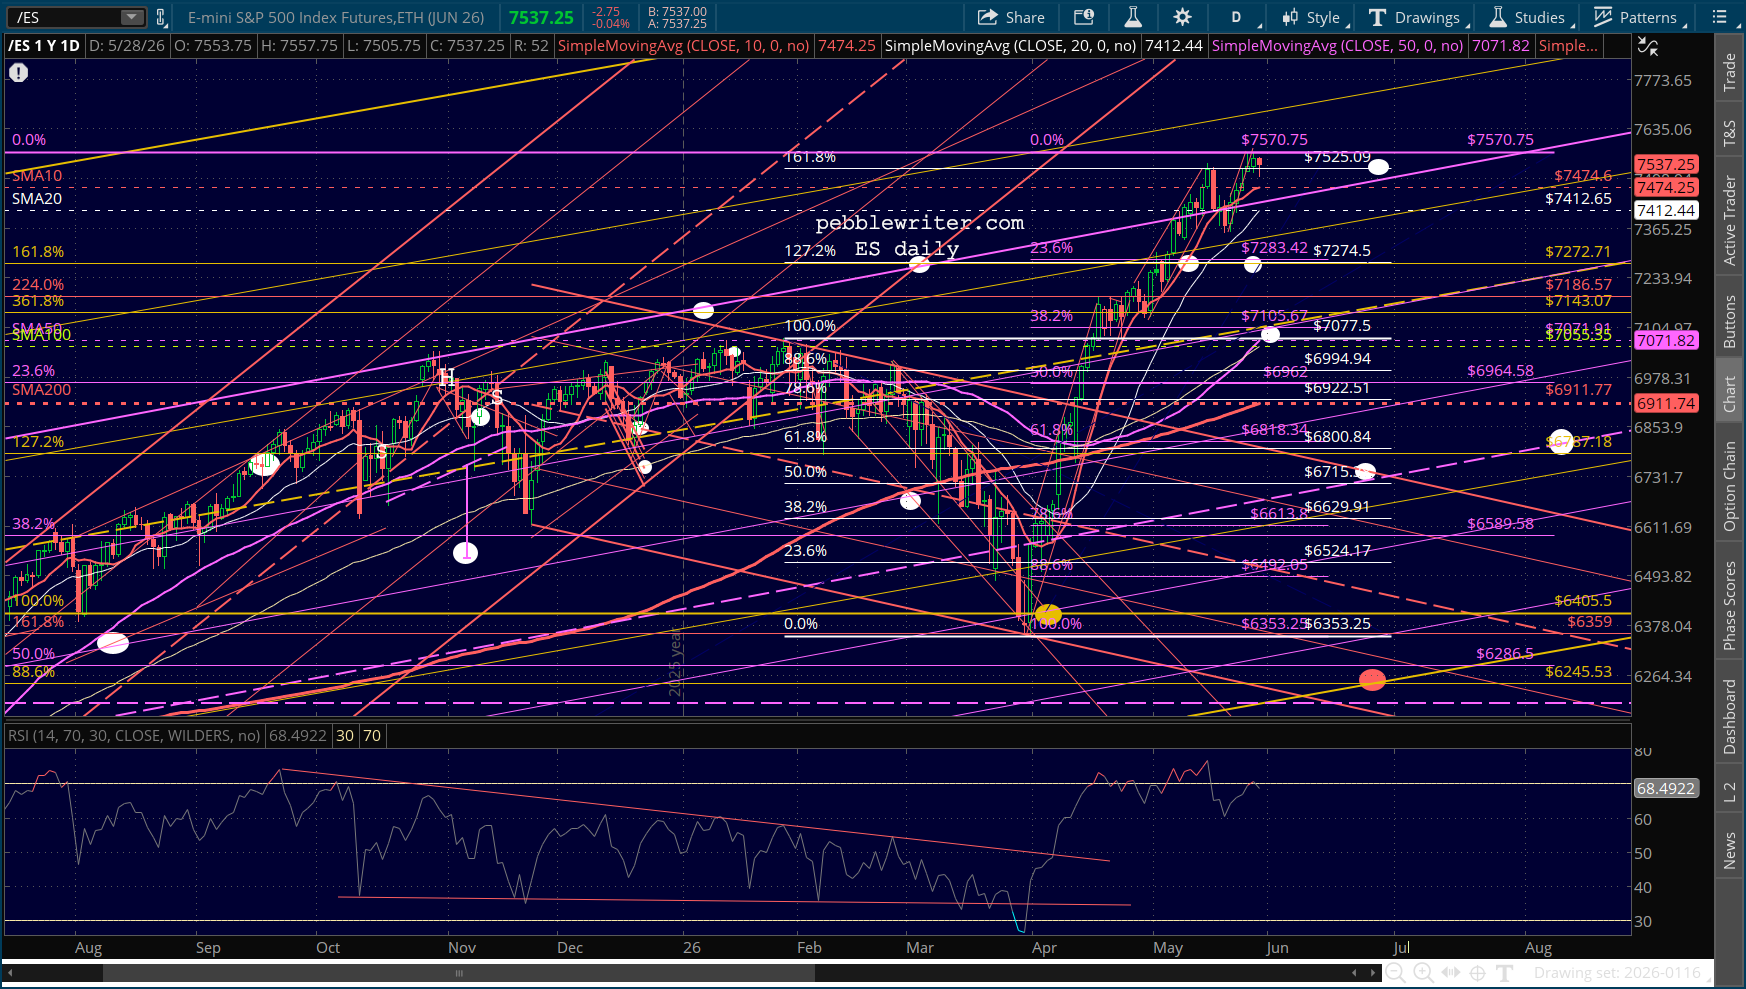
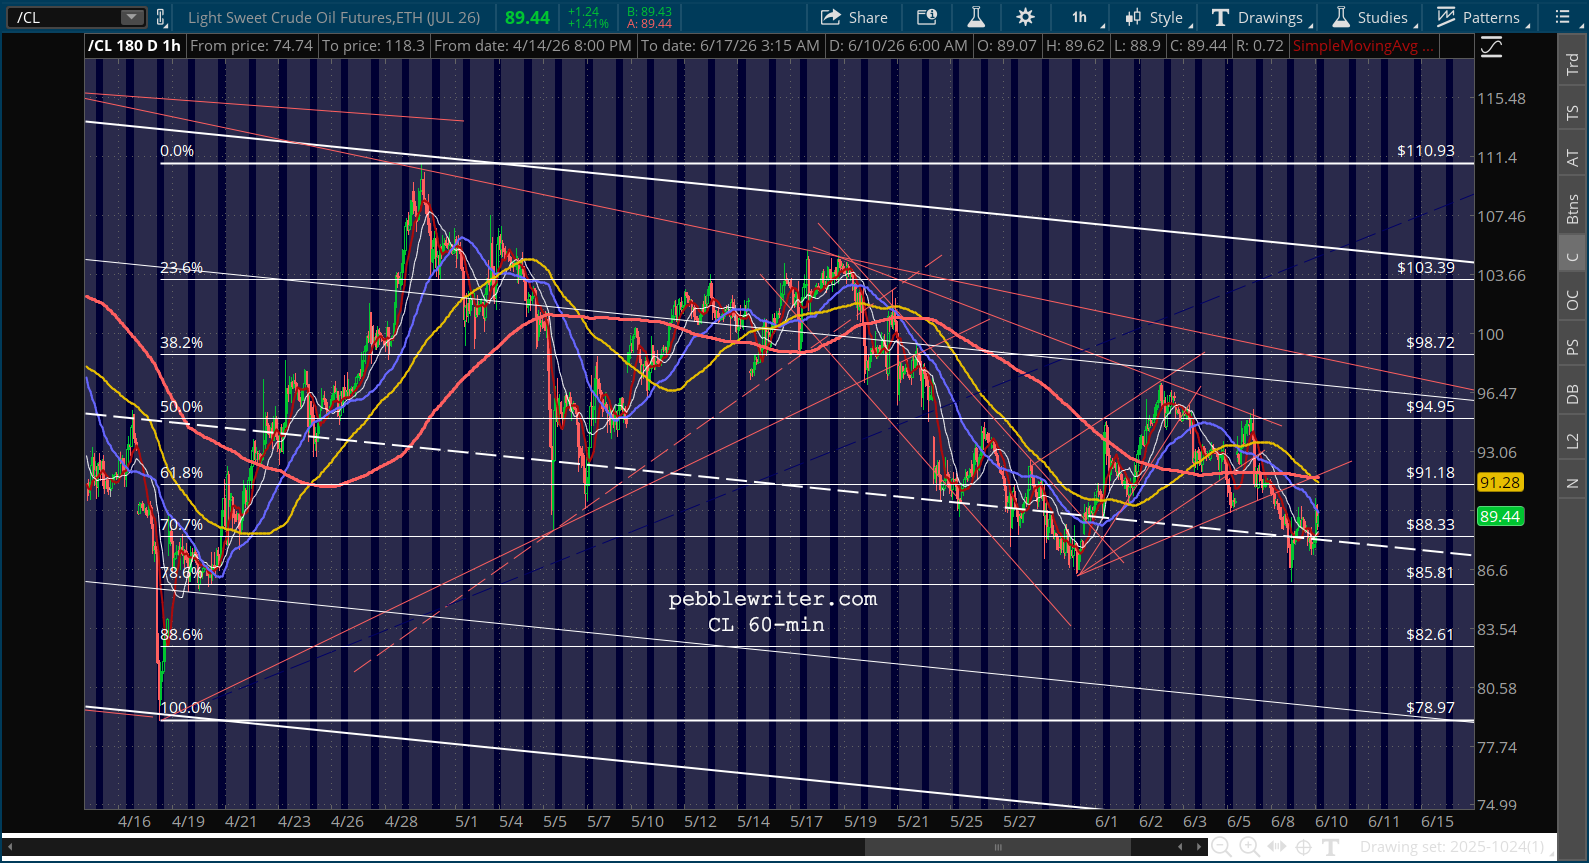
Futures, which tagged our next downside target yesterday, erased a bit of their overnight losses.
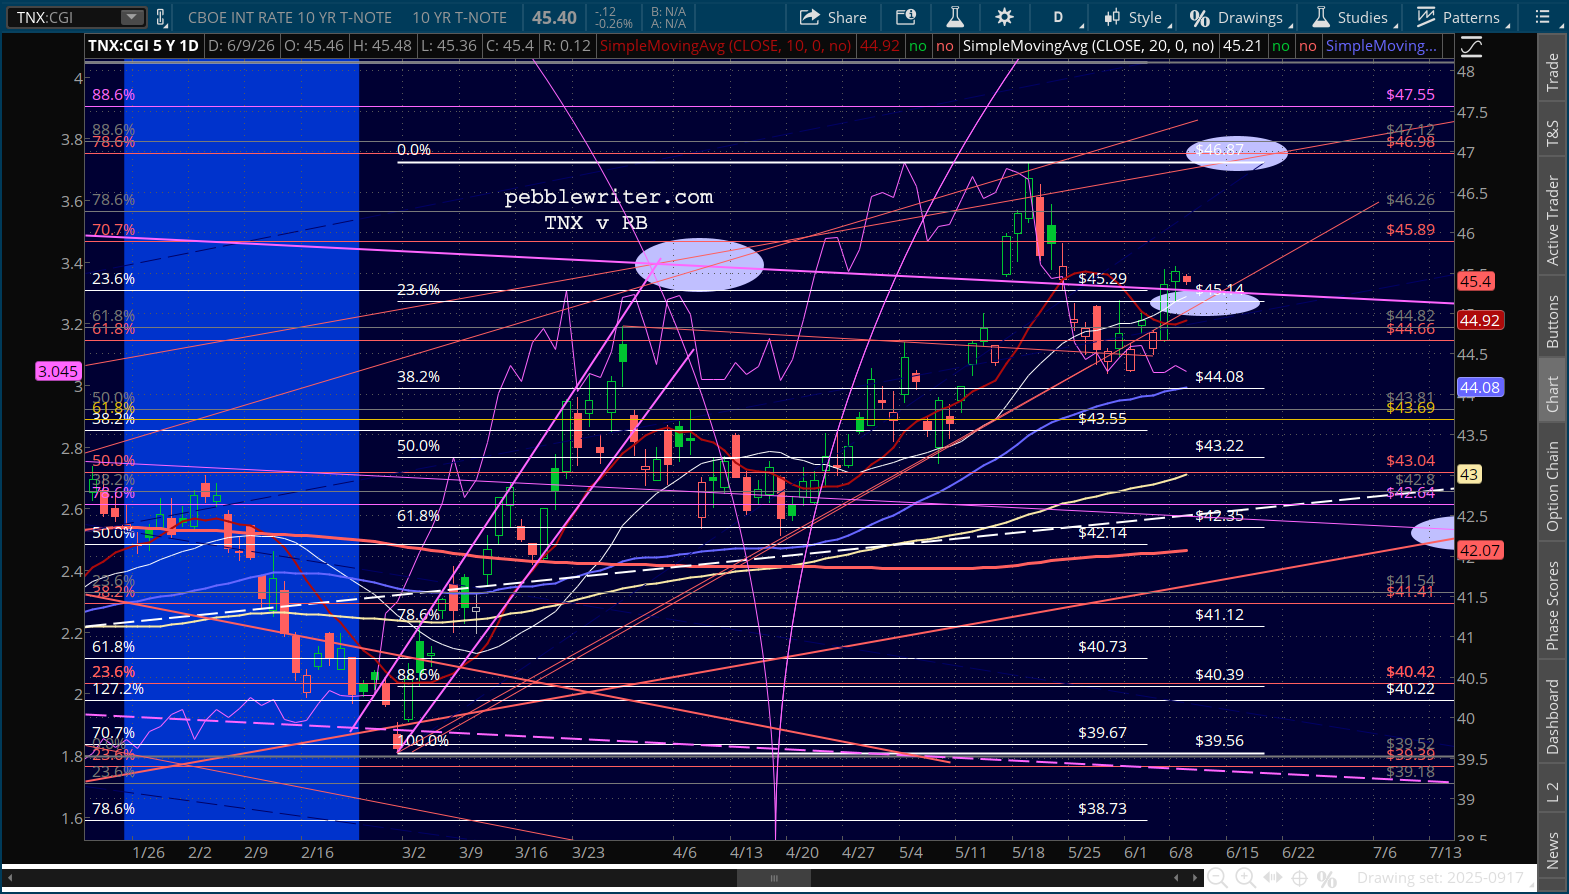
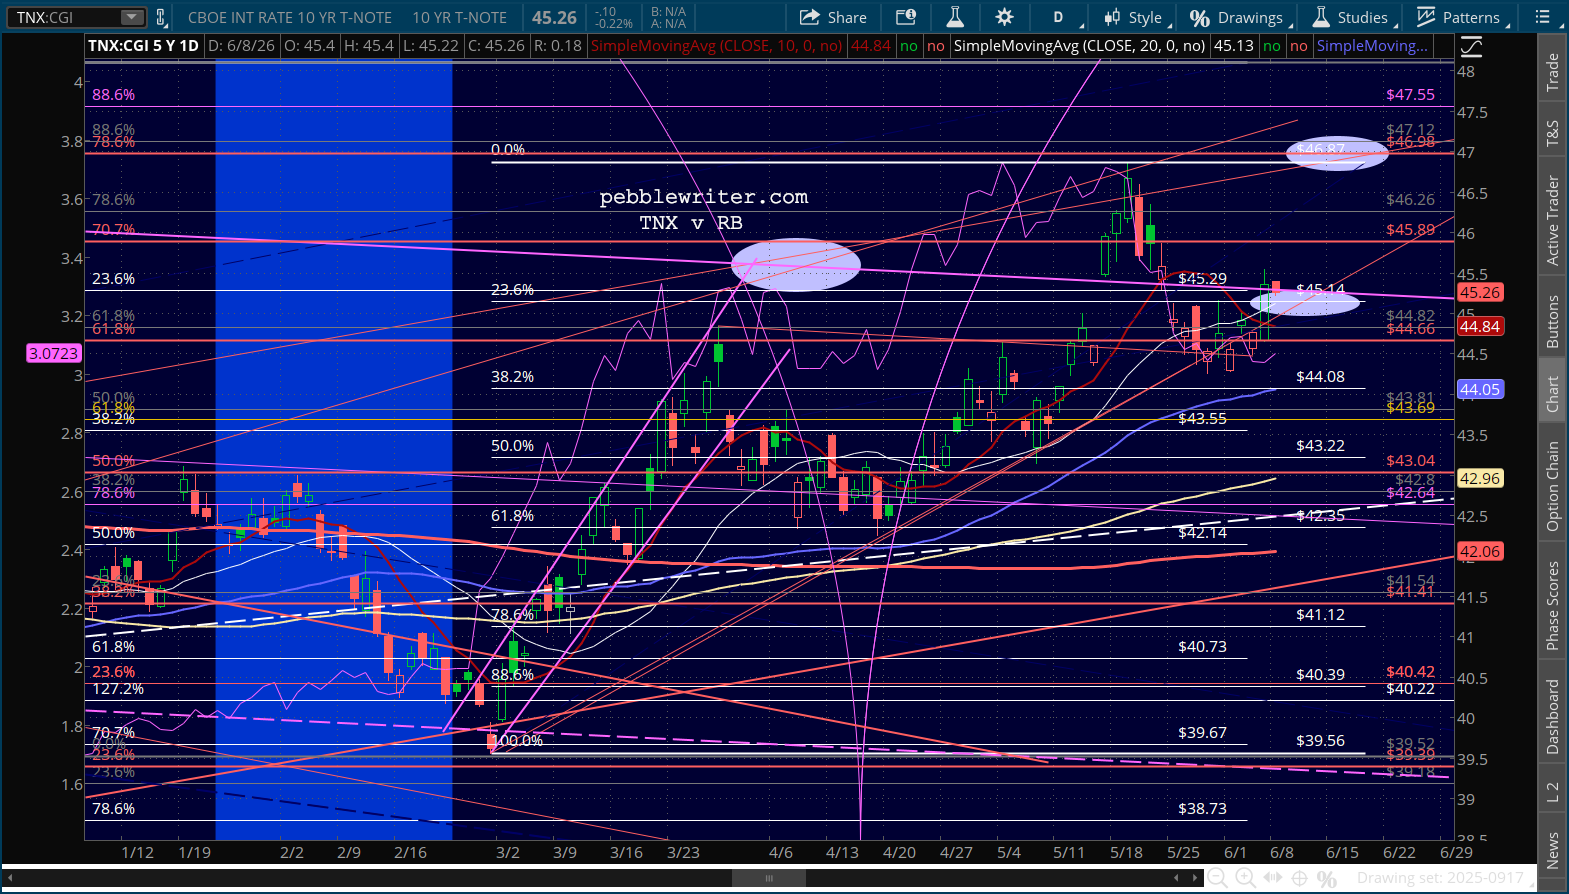
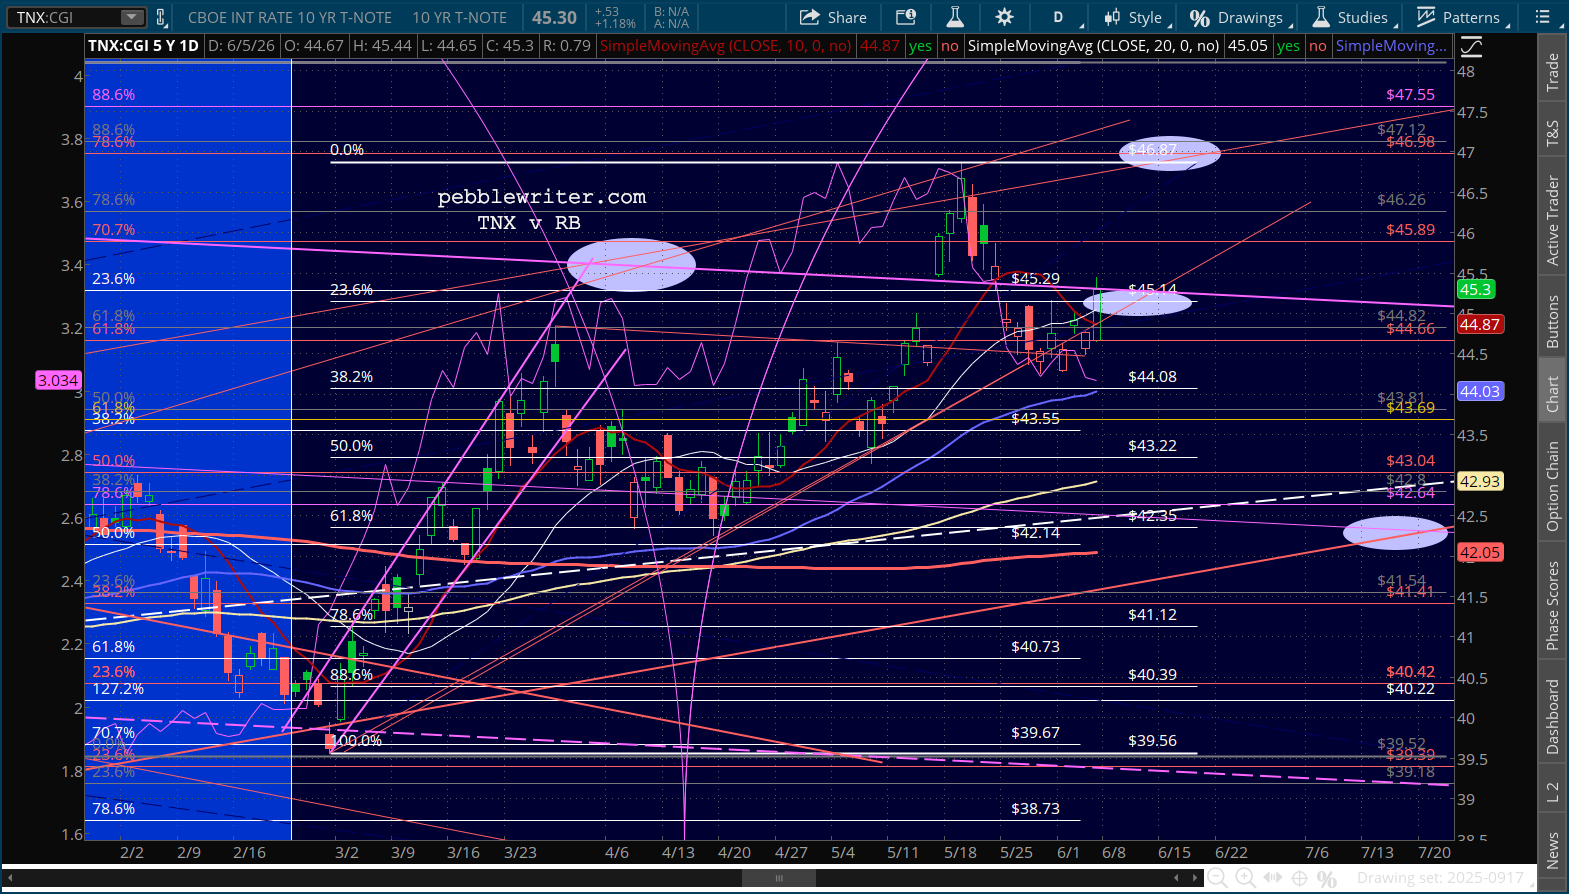
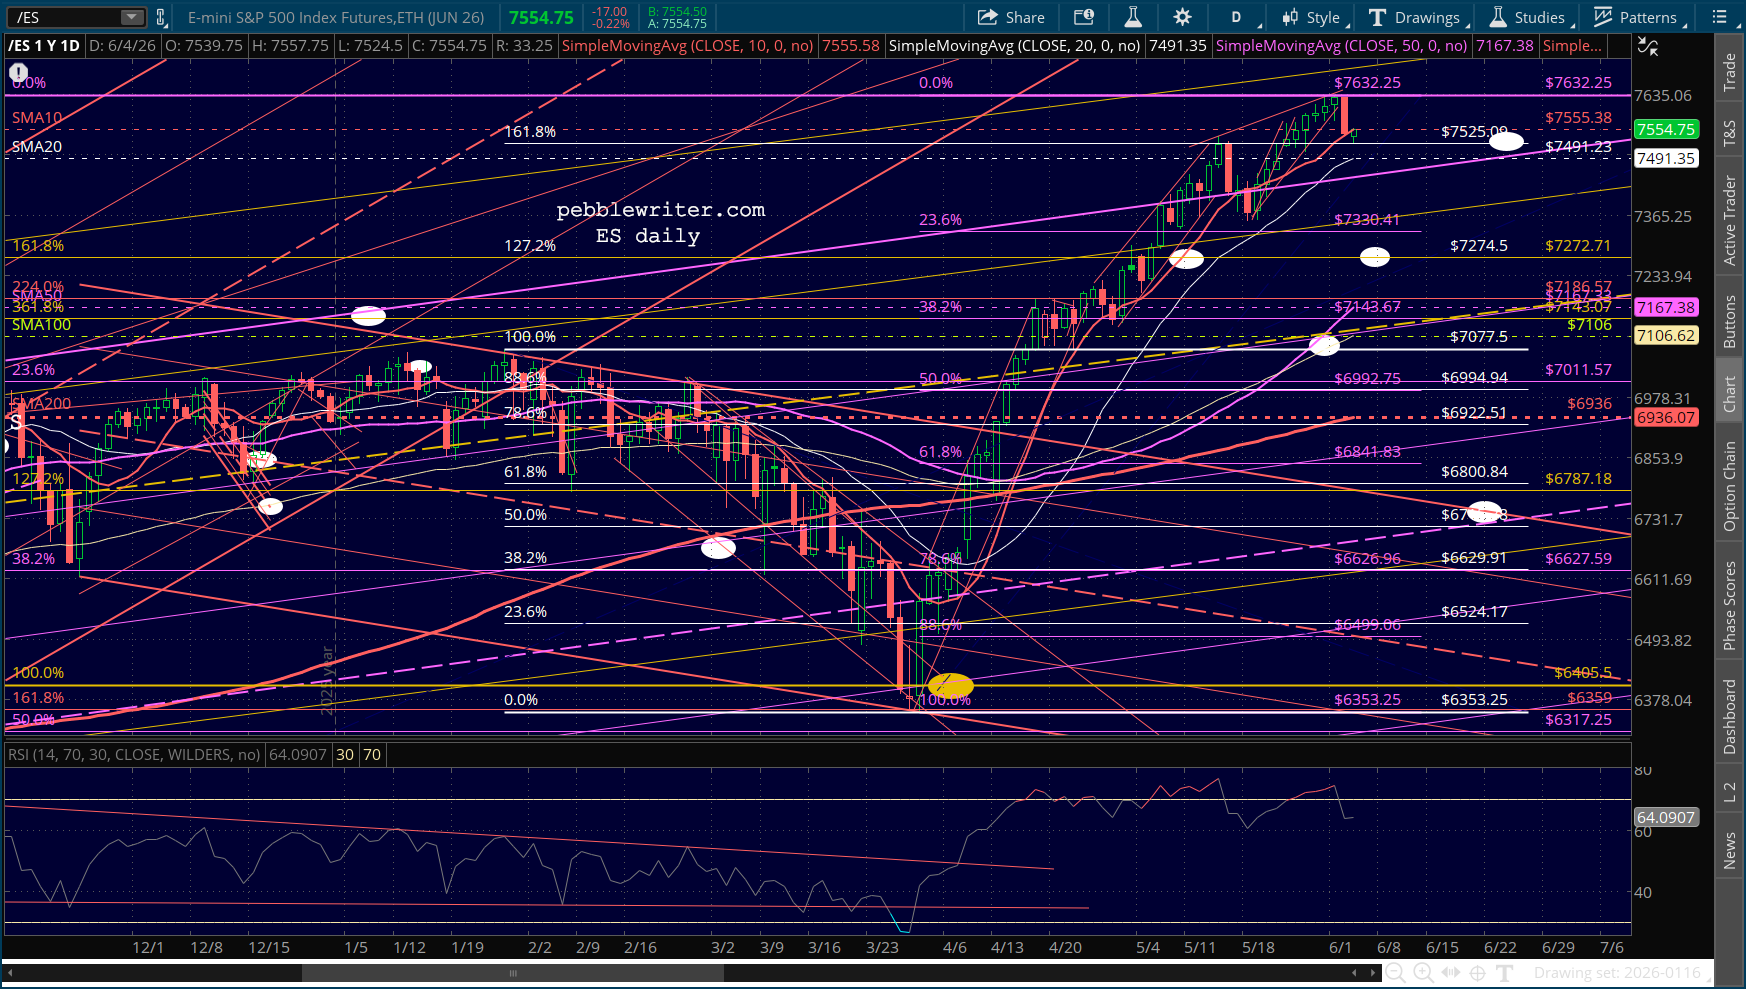
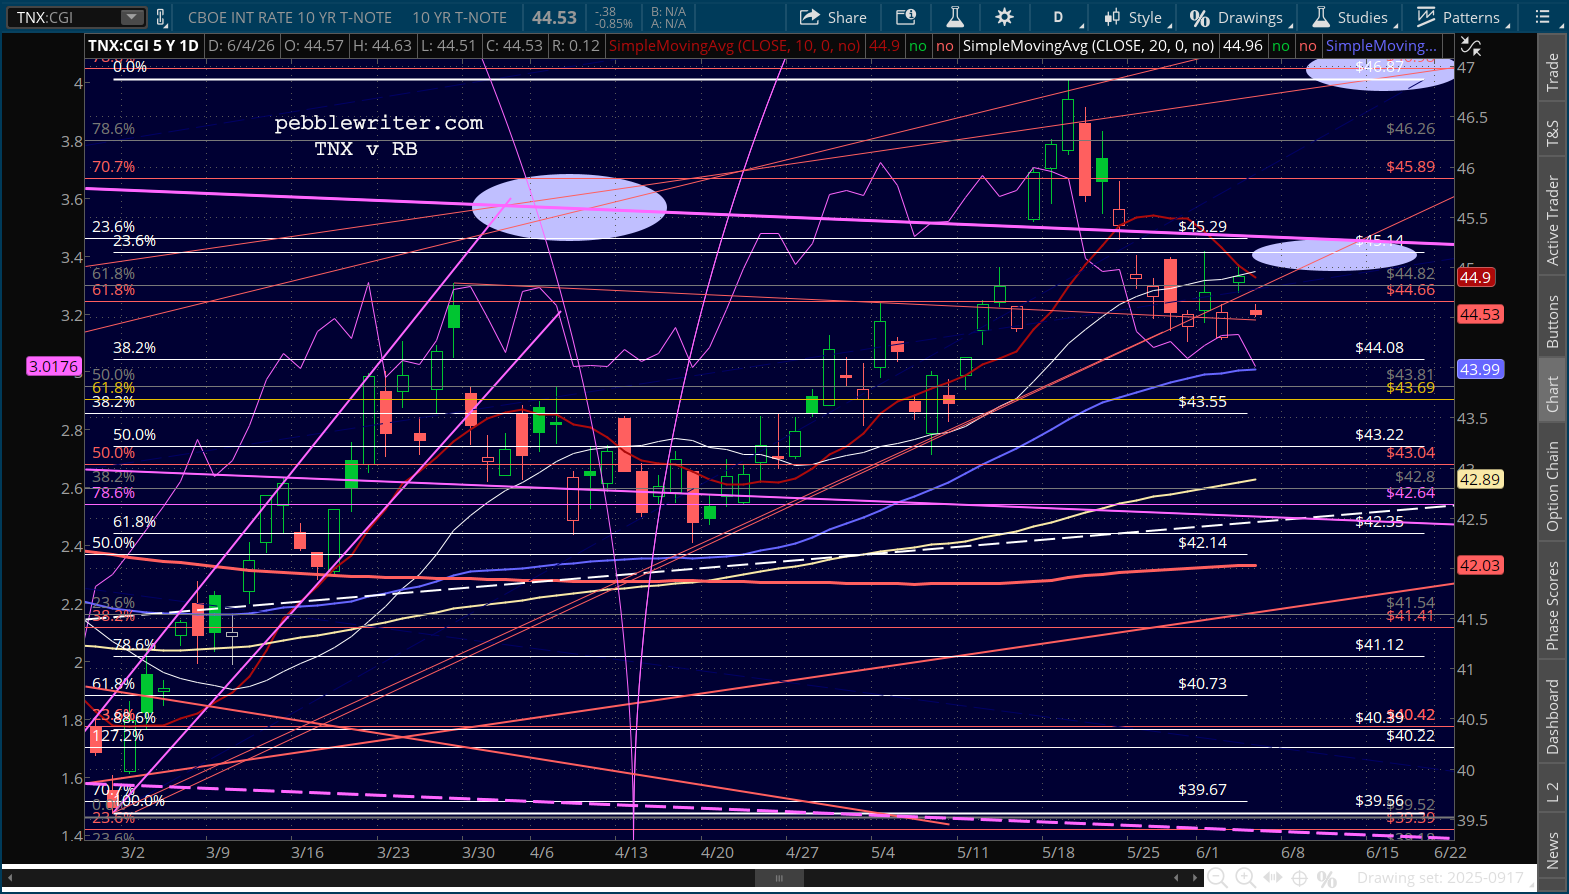
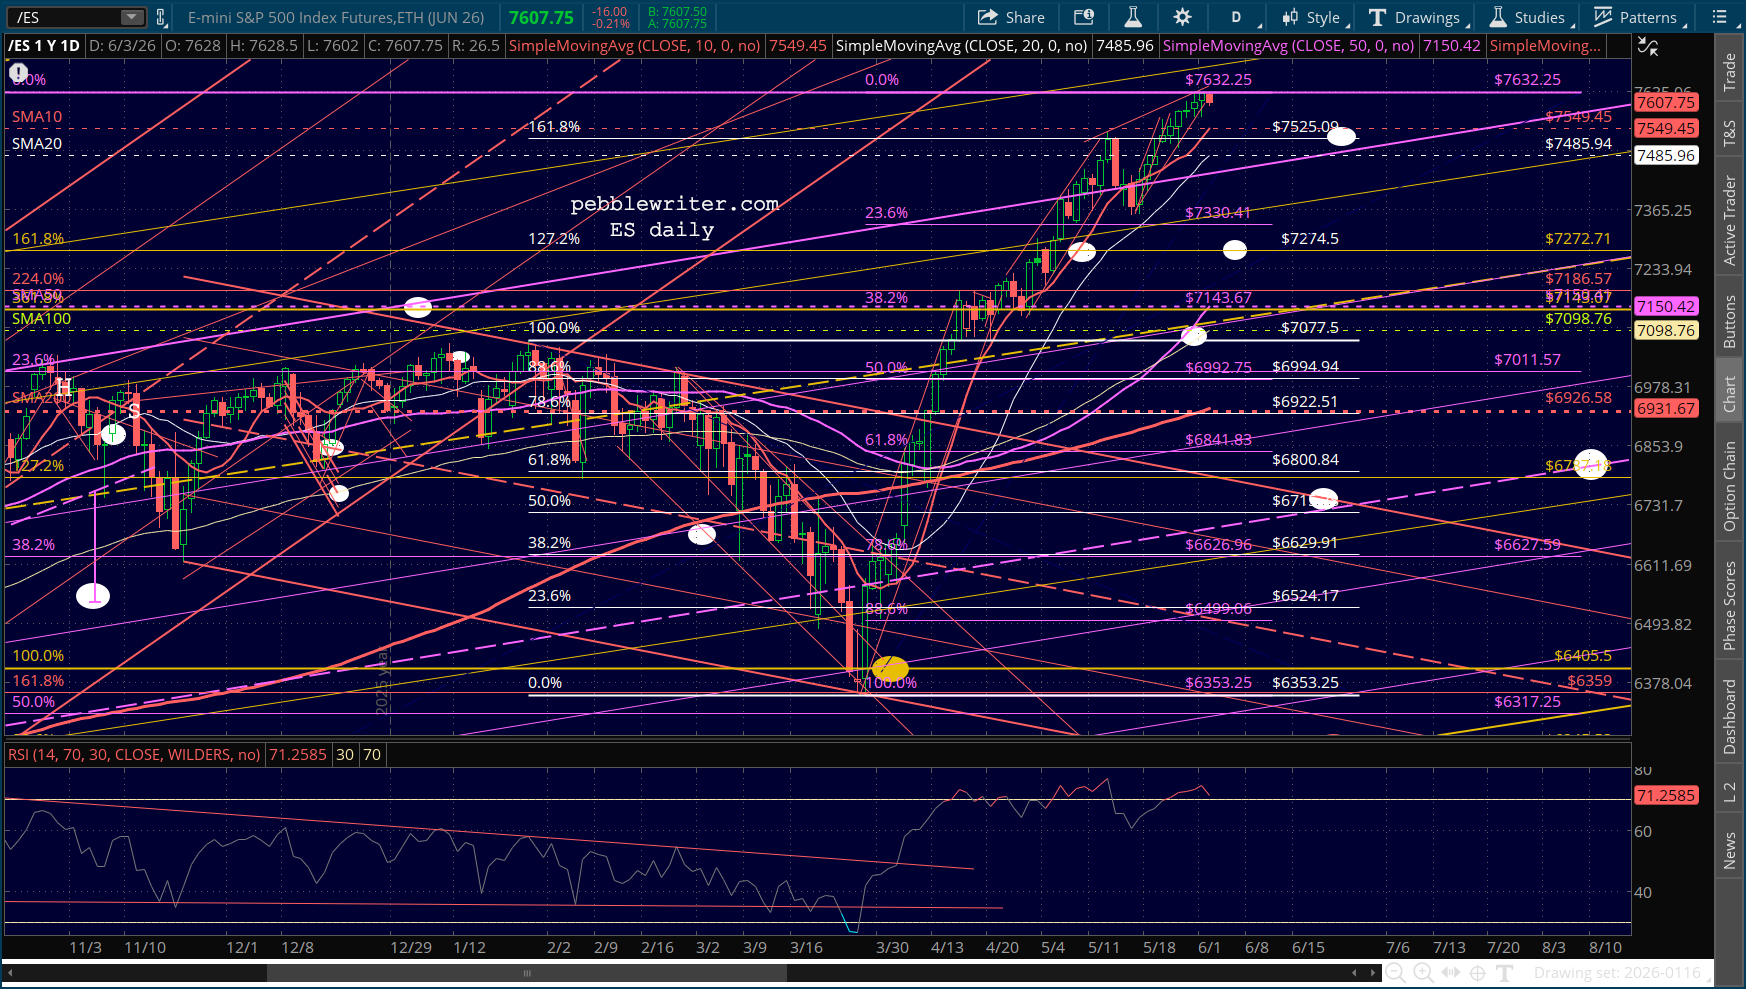
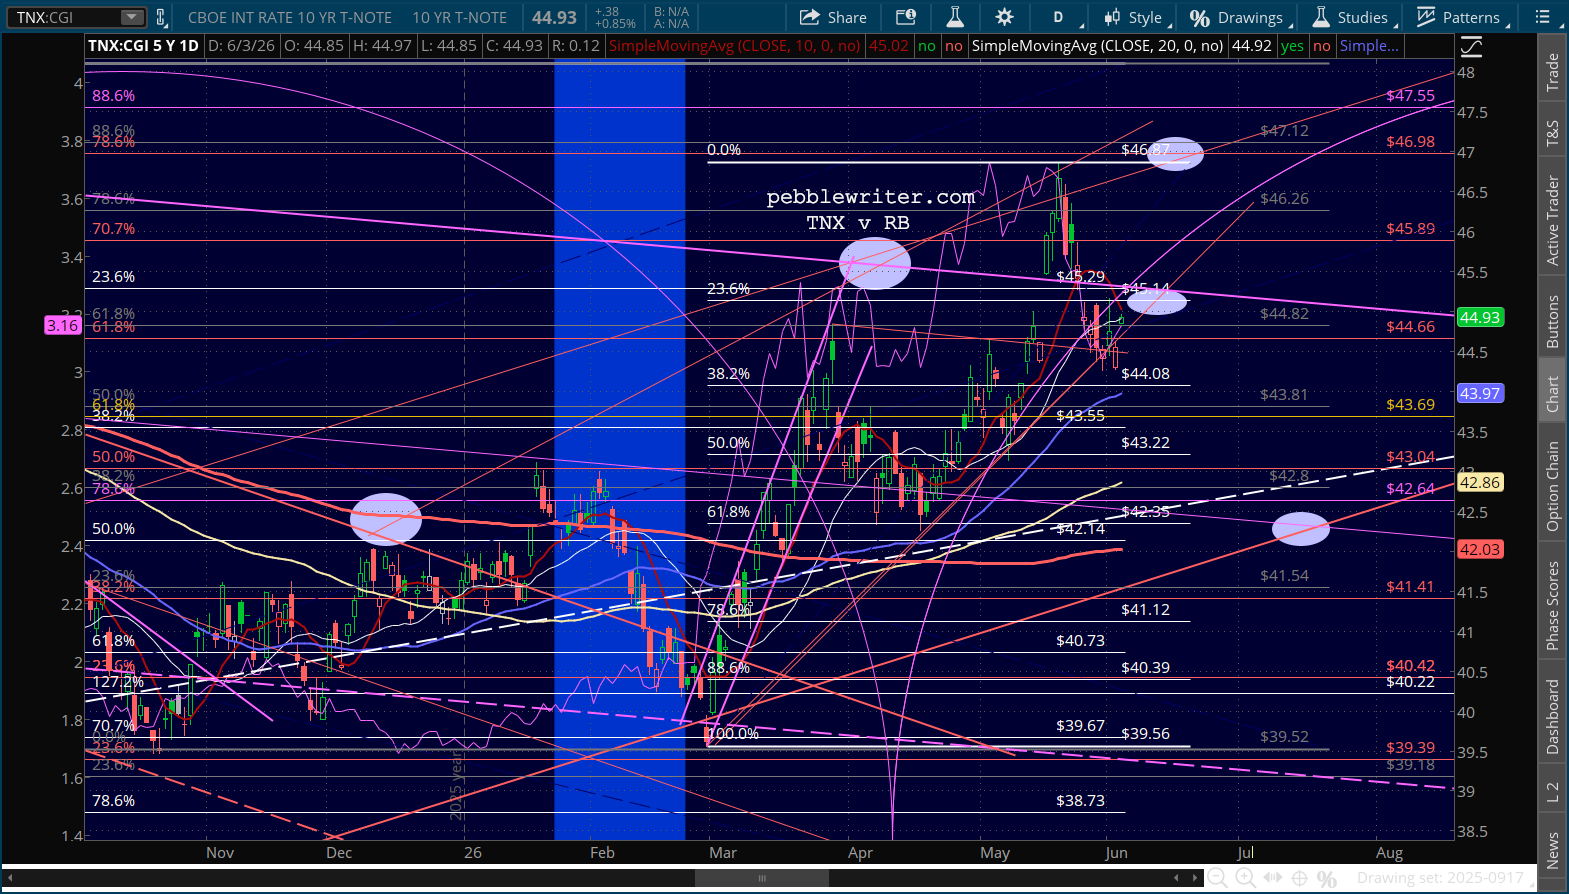
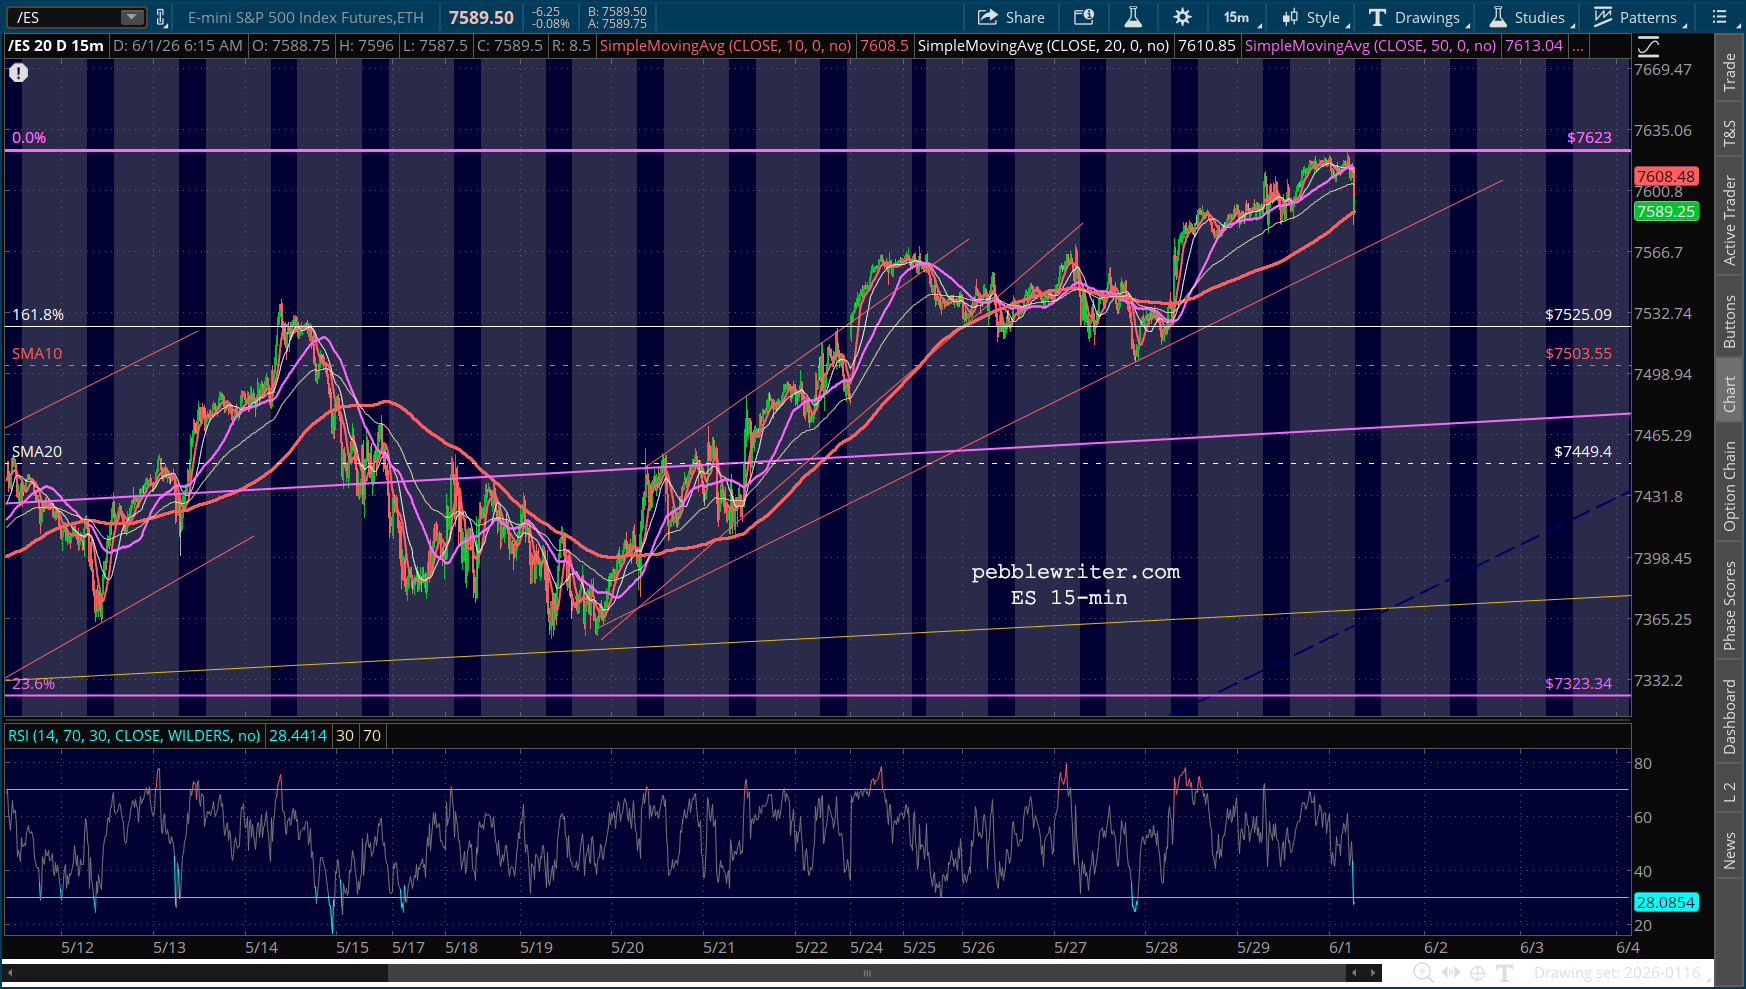
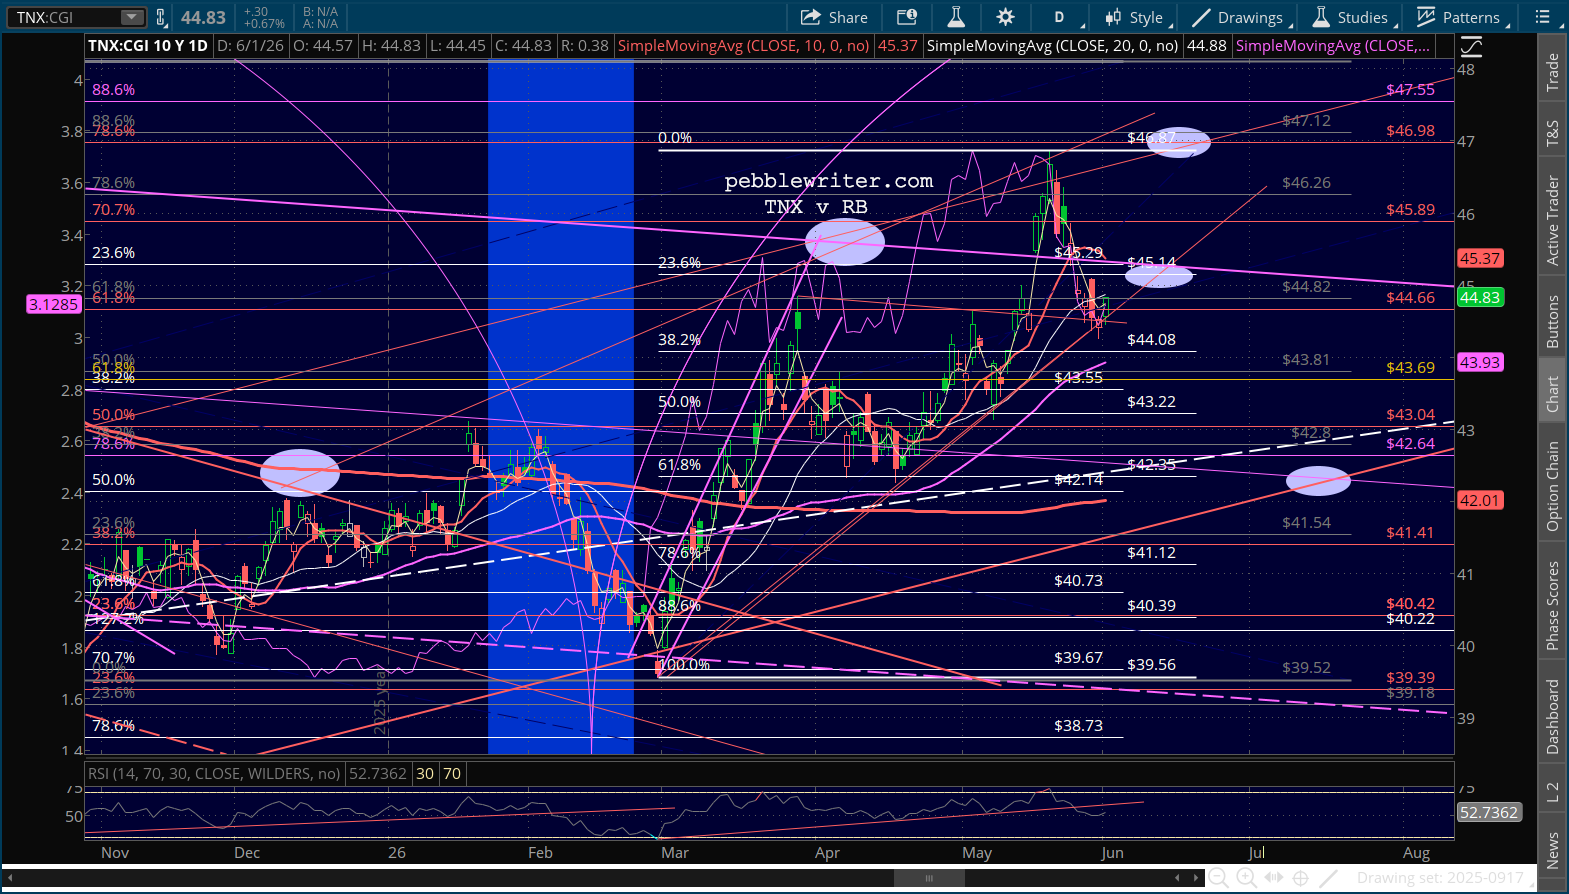
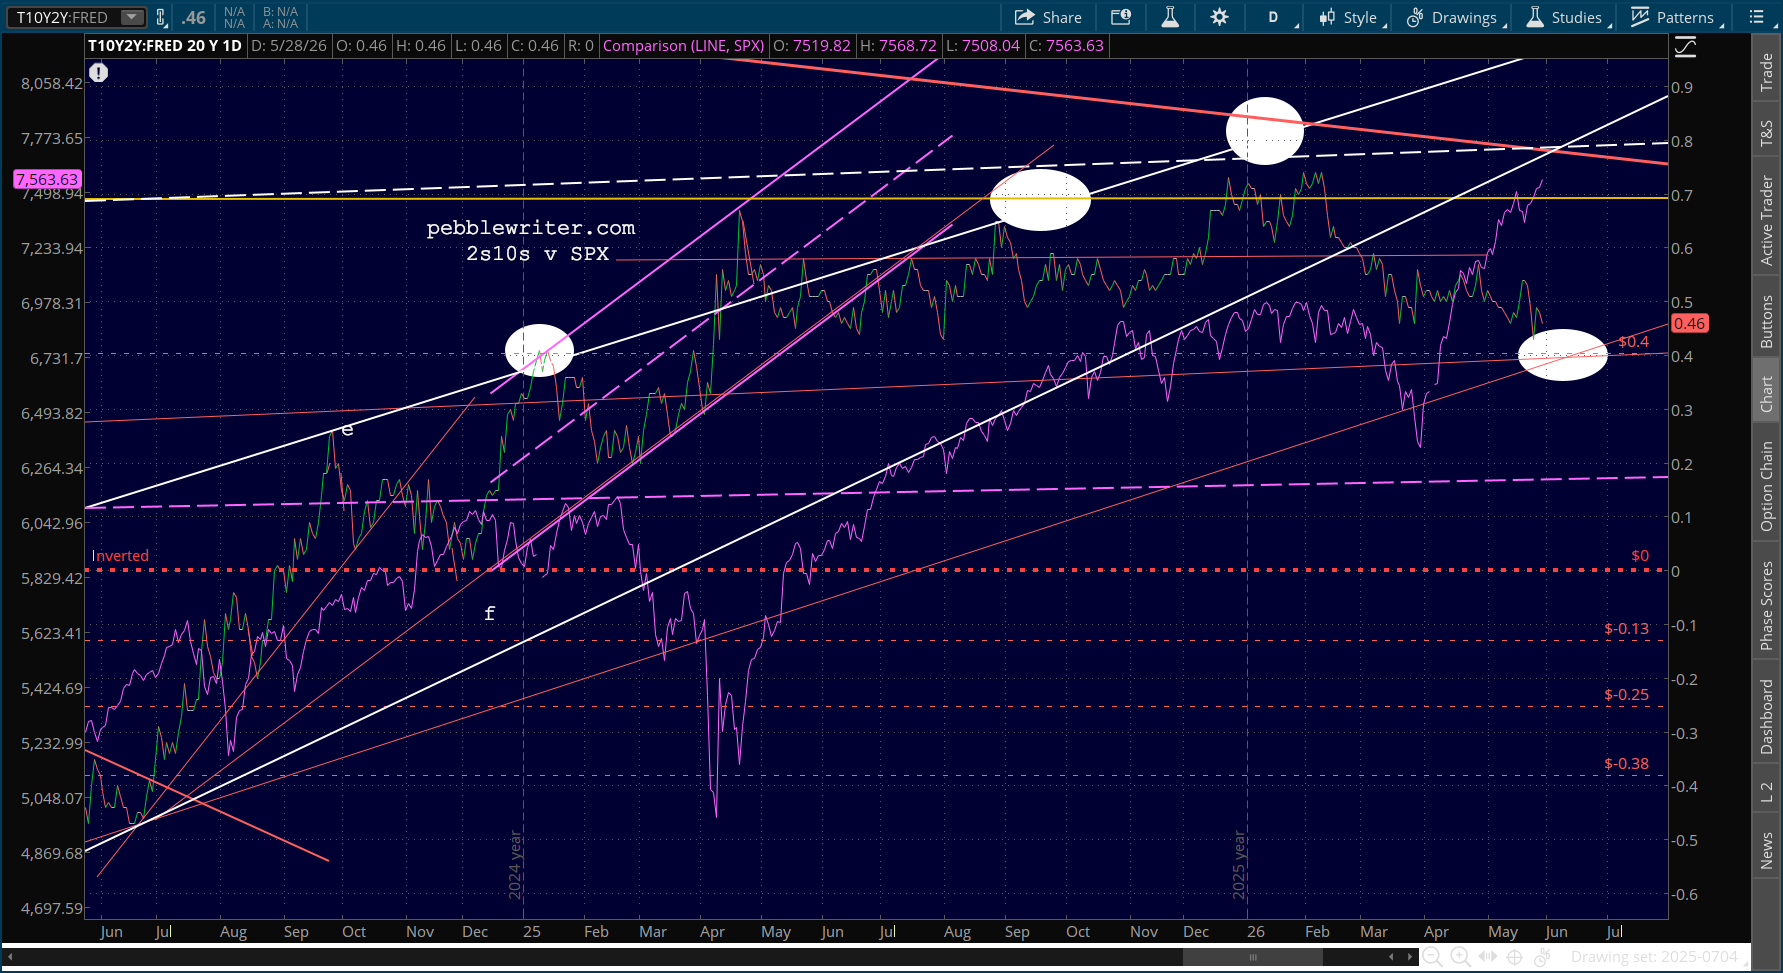
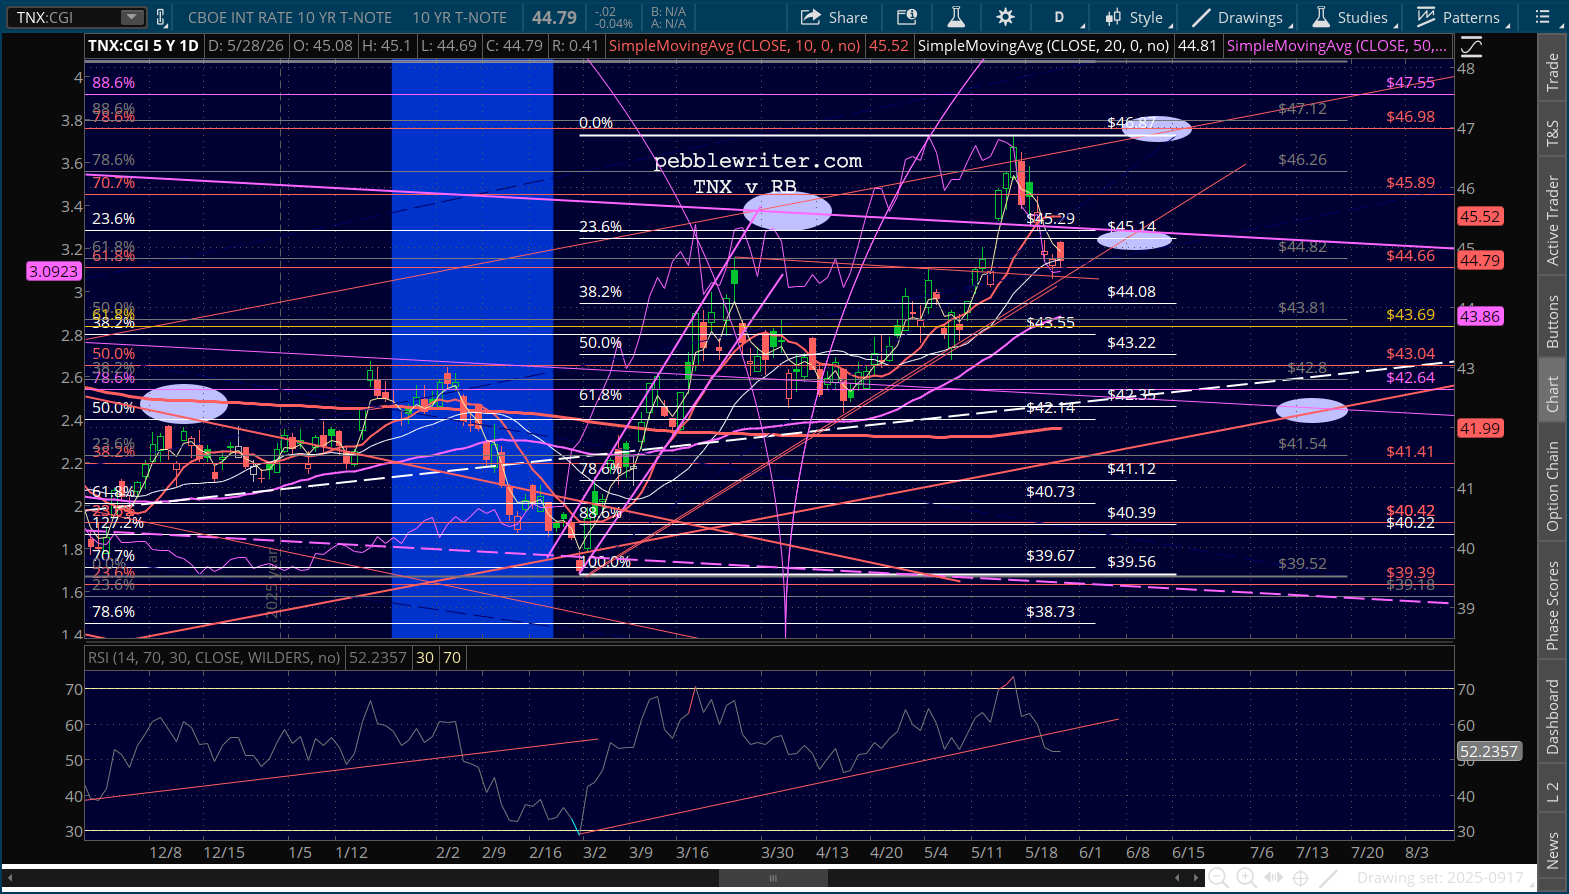
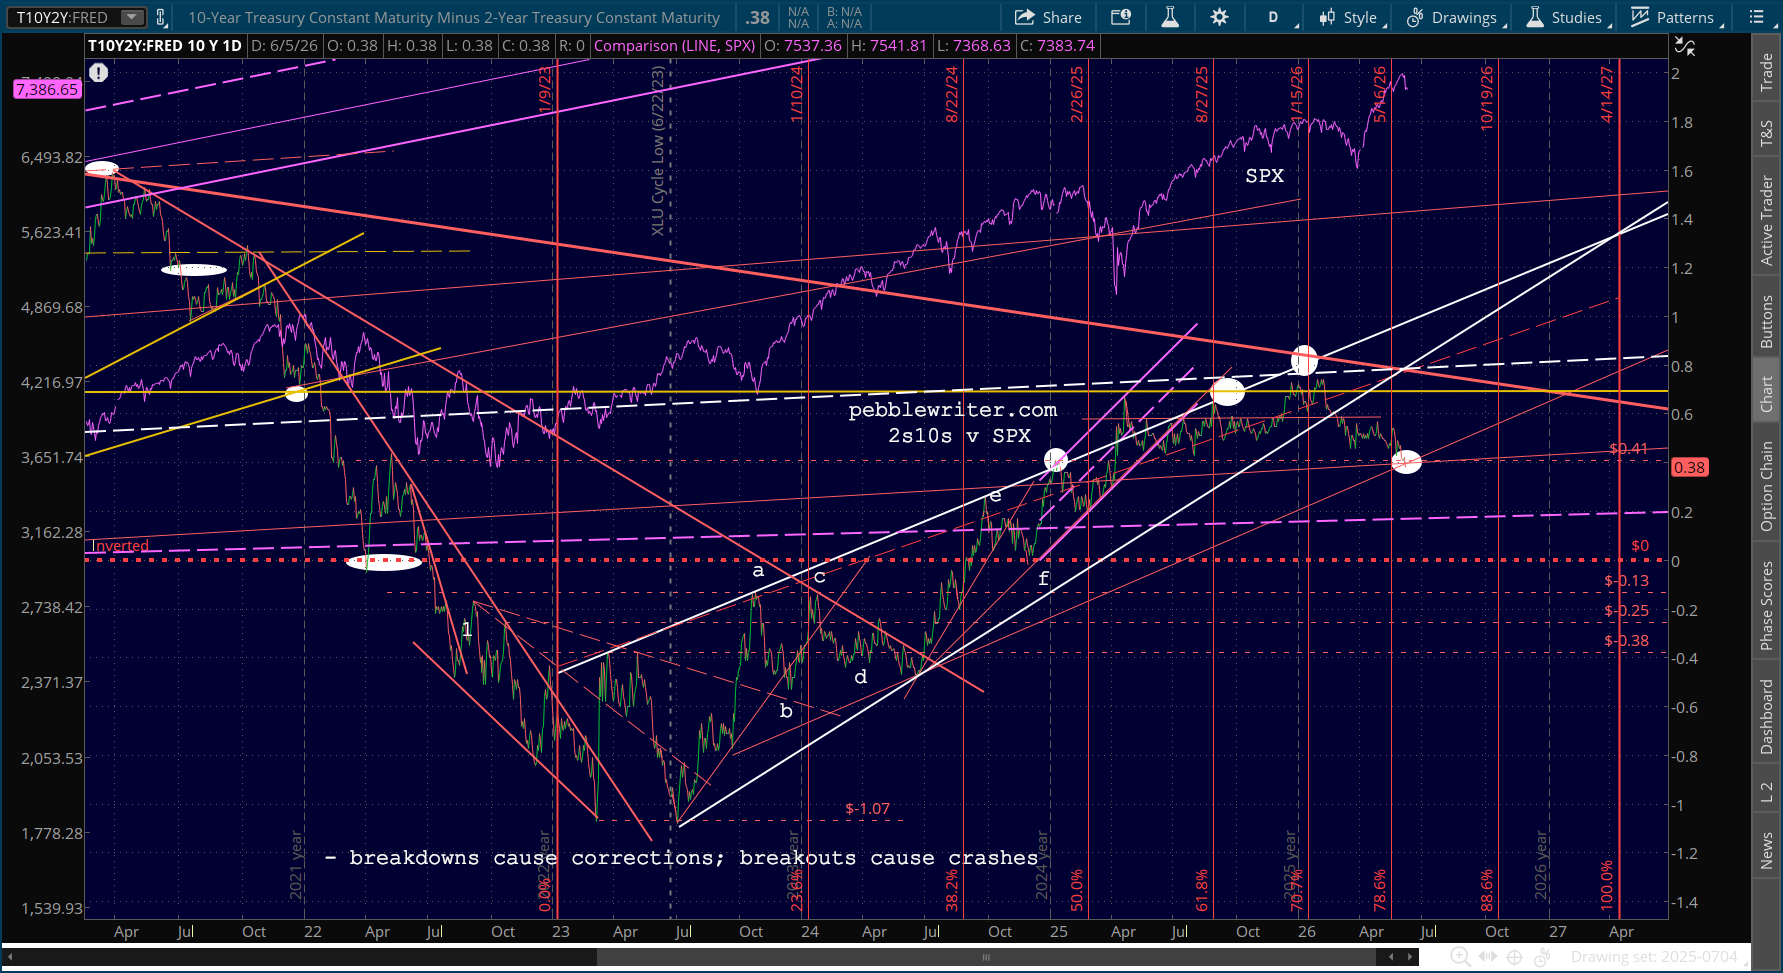
But, it’s the bond market’s reaction we’ll be closely watching today. Note that the 2s10s tagged our downside target from last December. A further drop would almost guarantee more pain for stocks., with ES eyeing 7077. A steepening would at least postpone the pain.
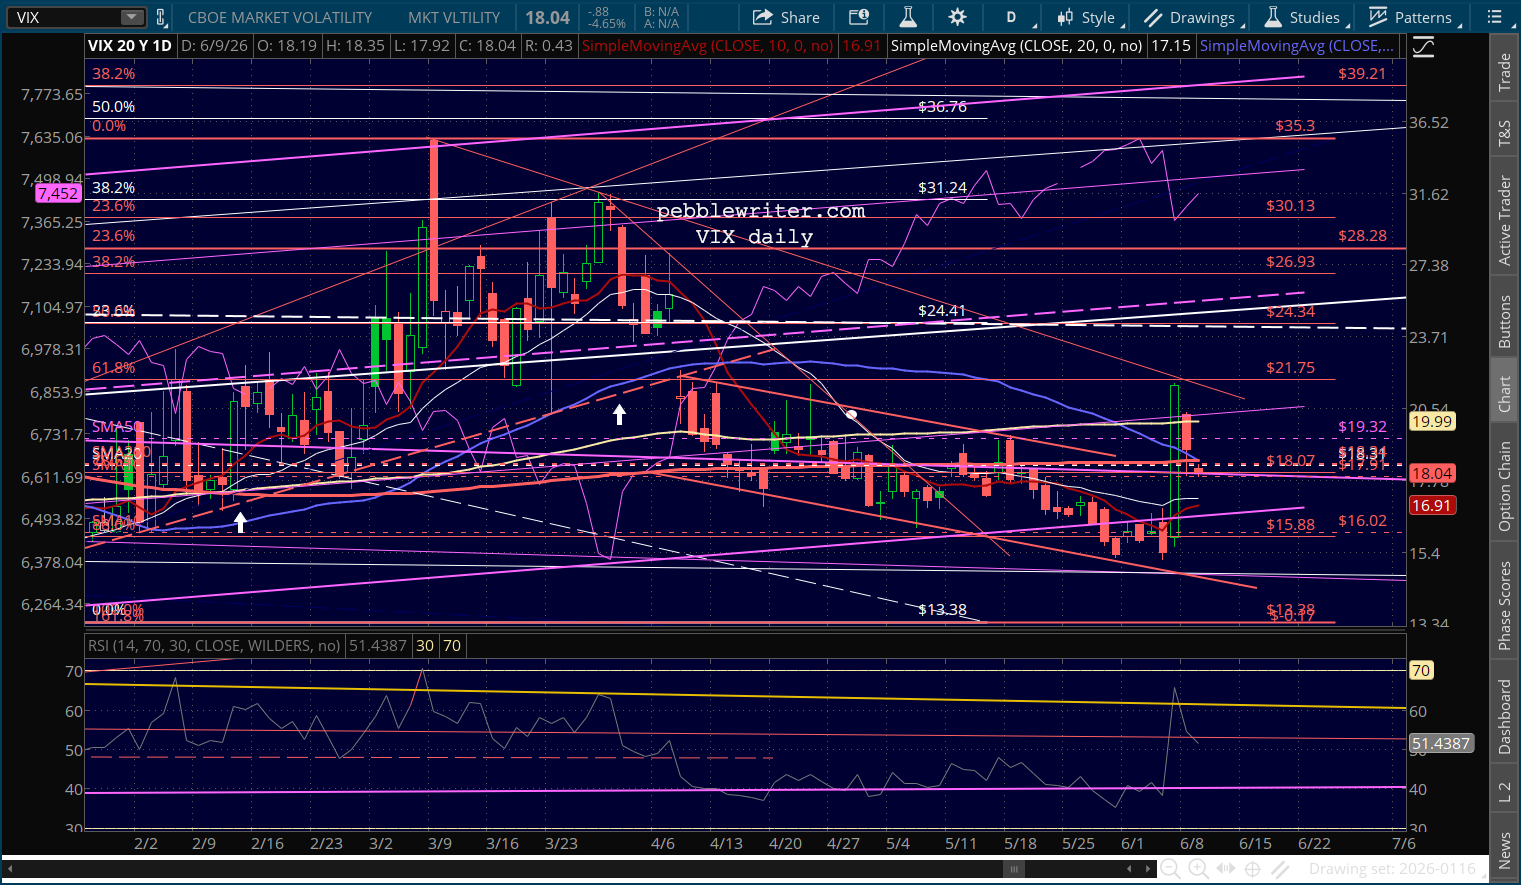
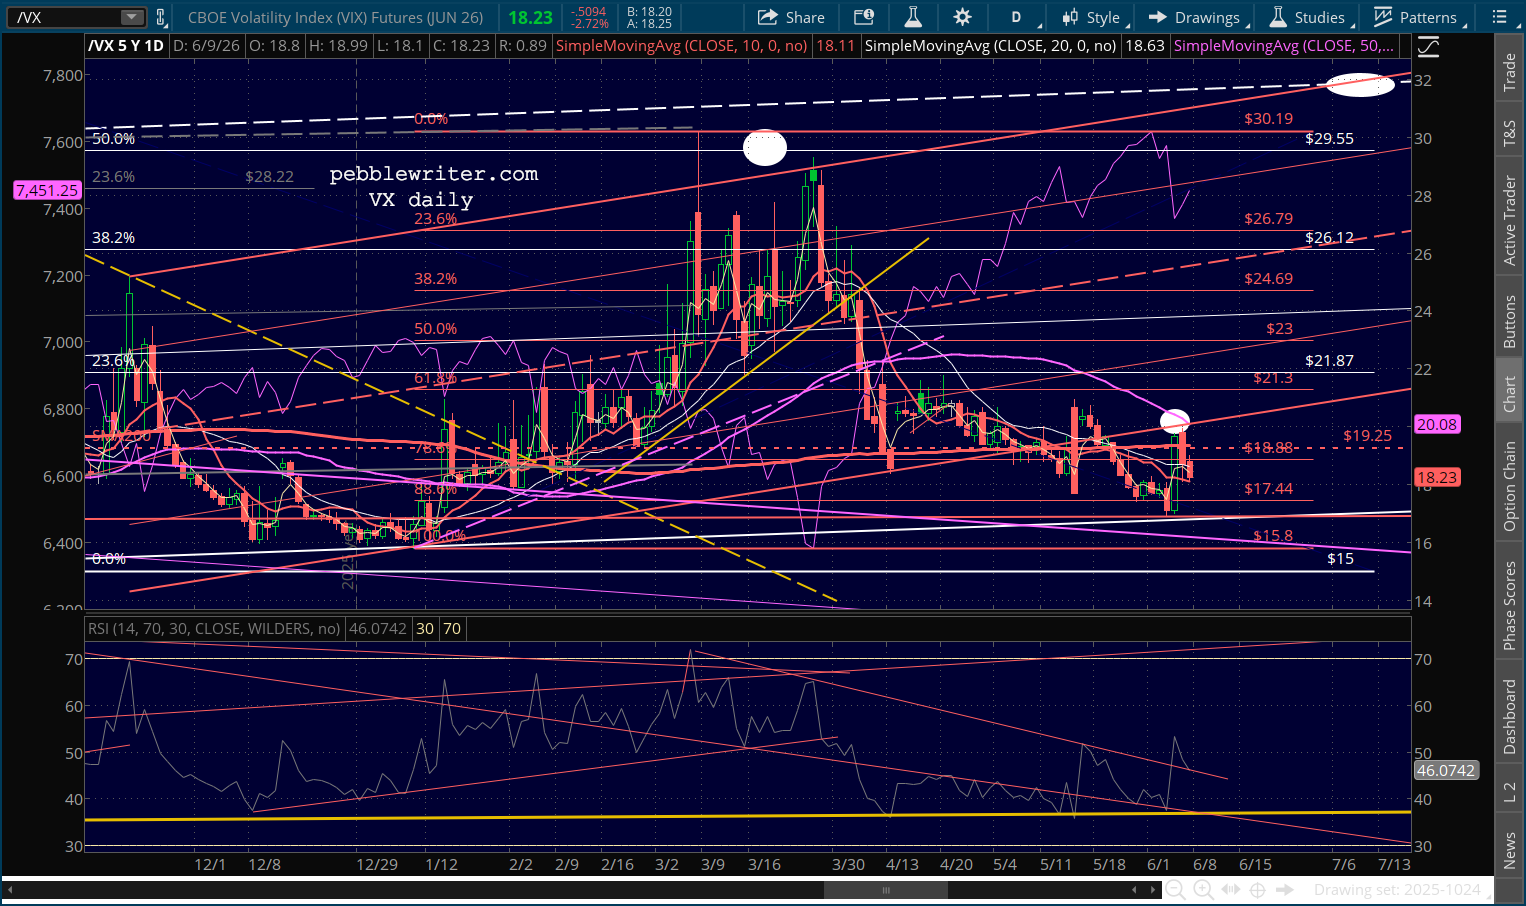
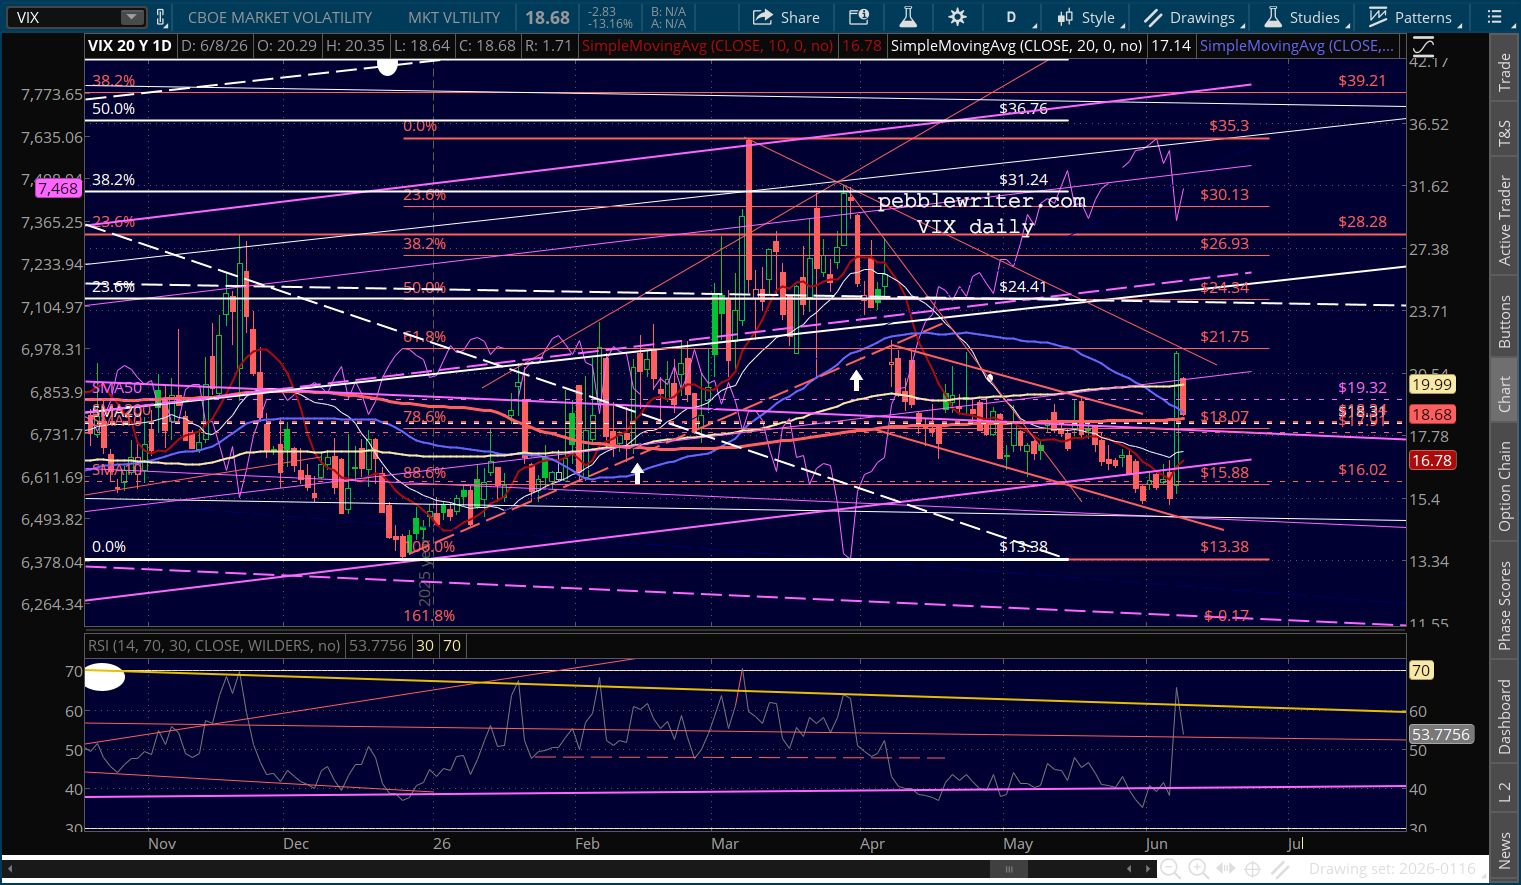
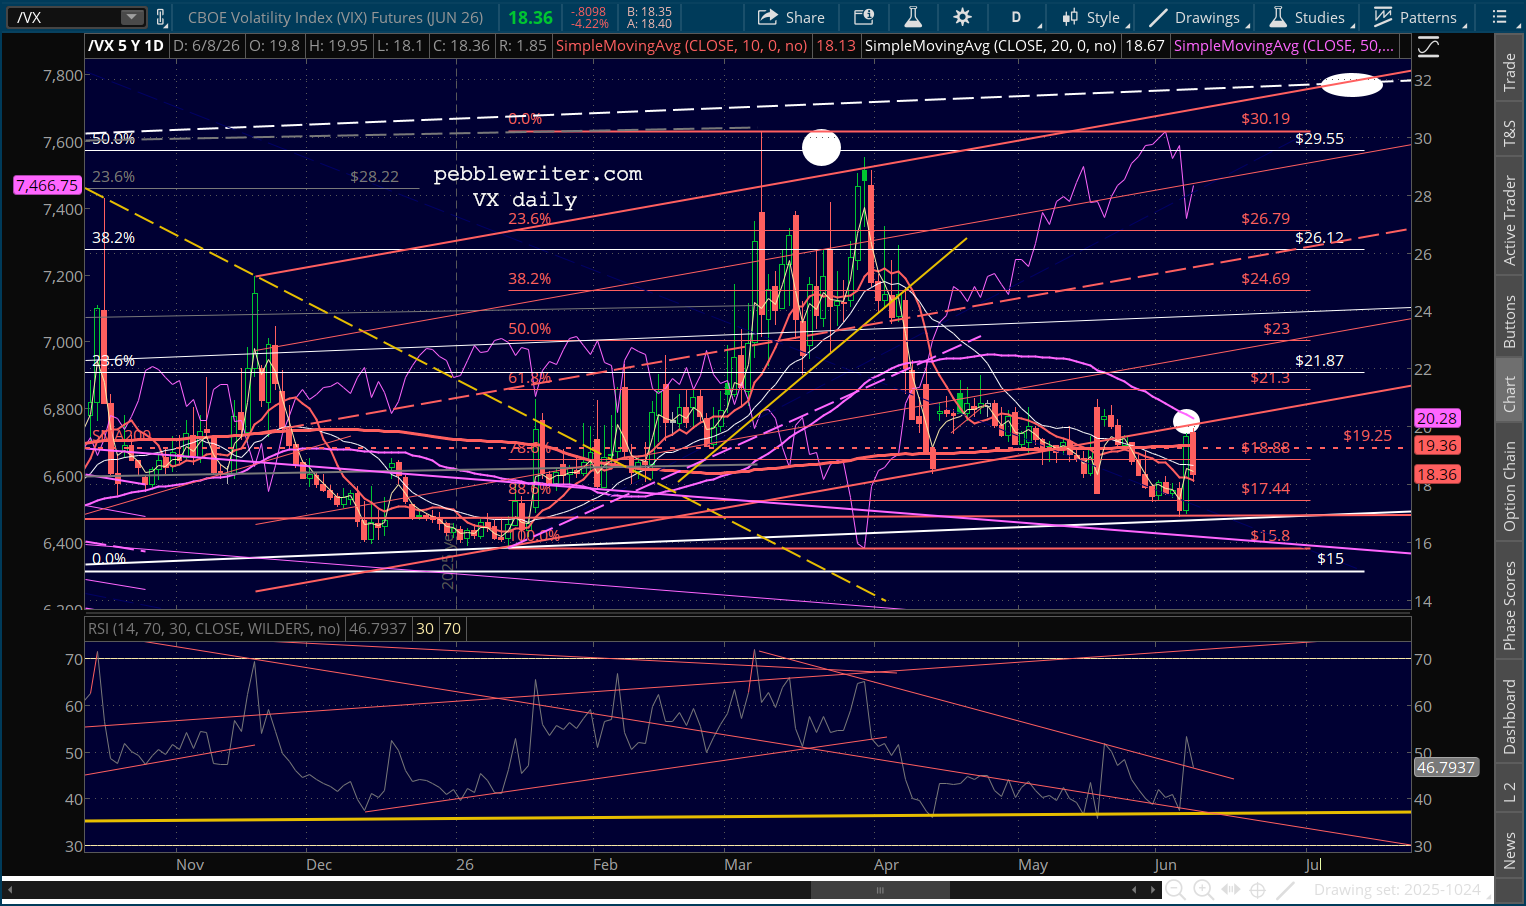
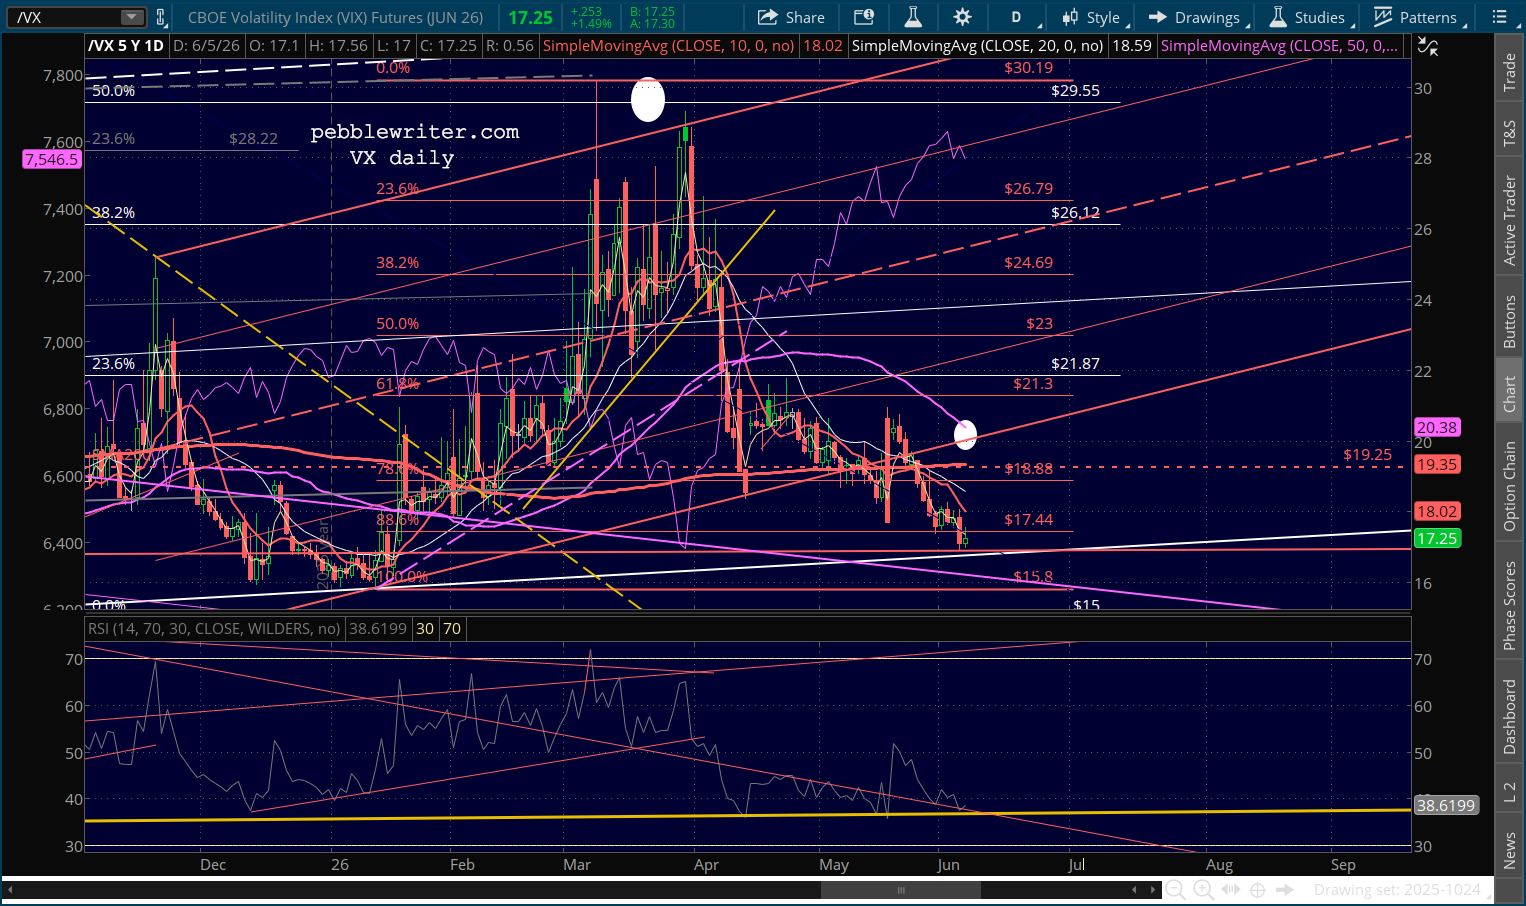
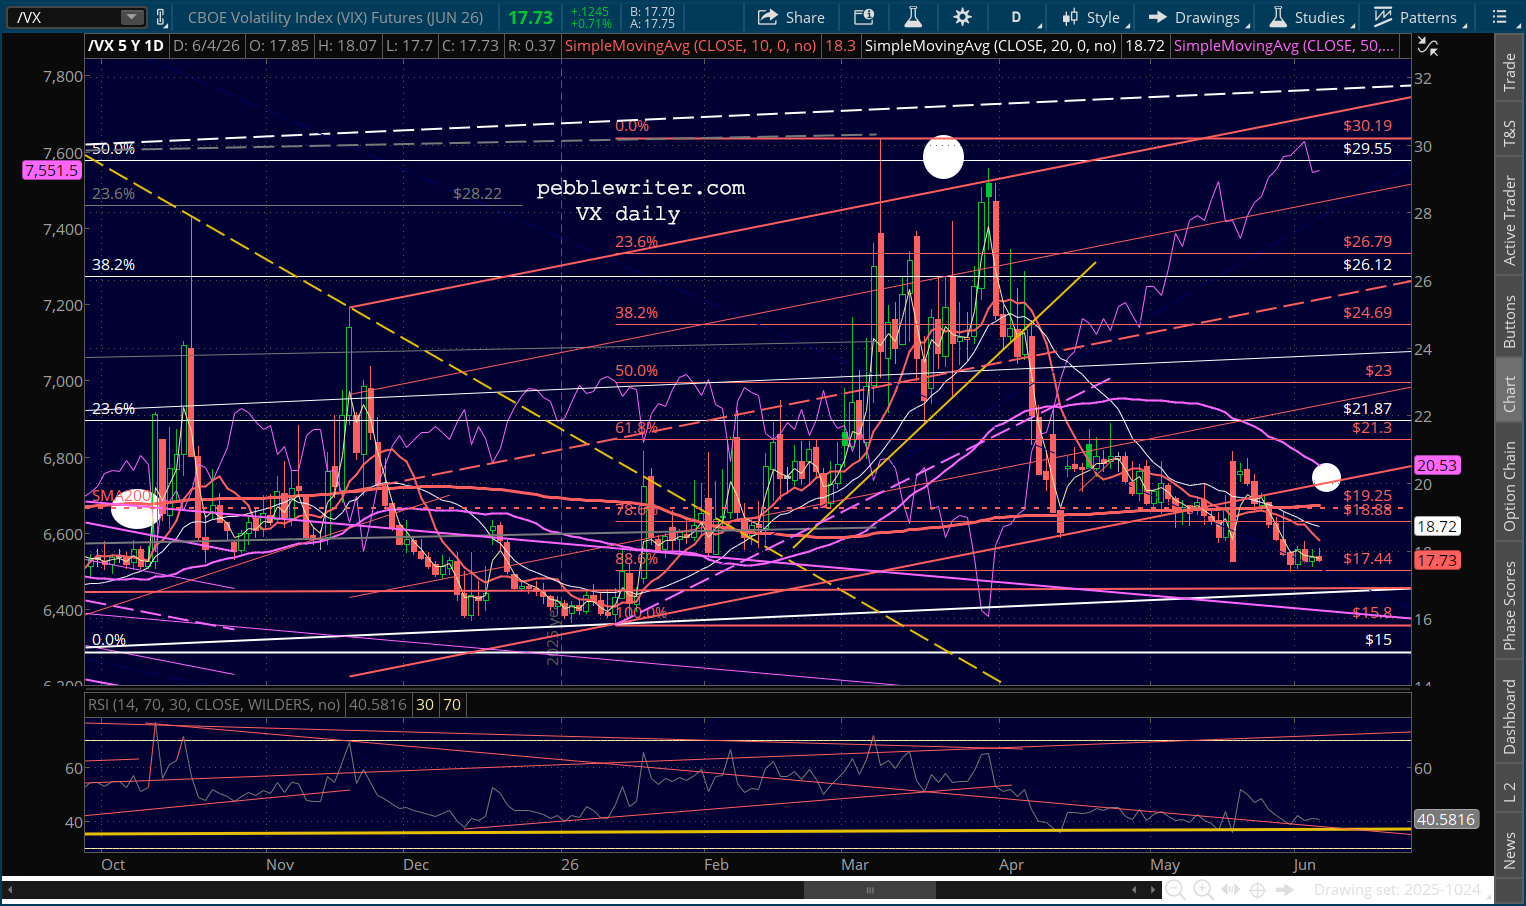
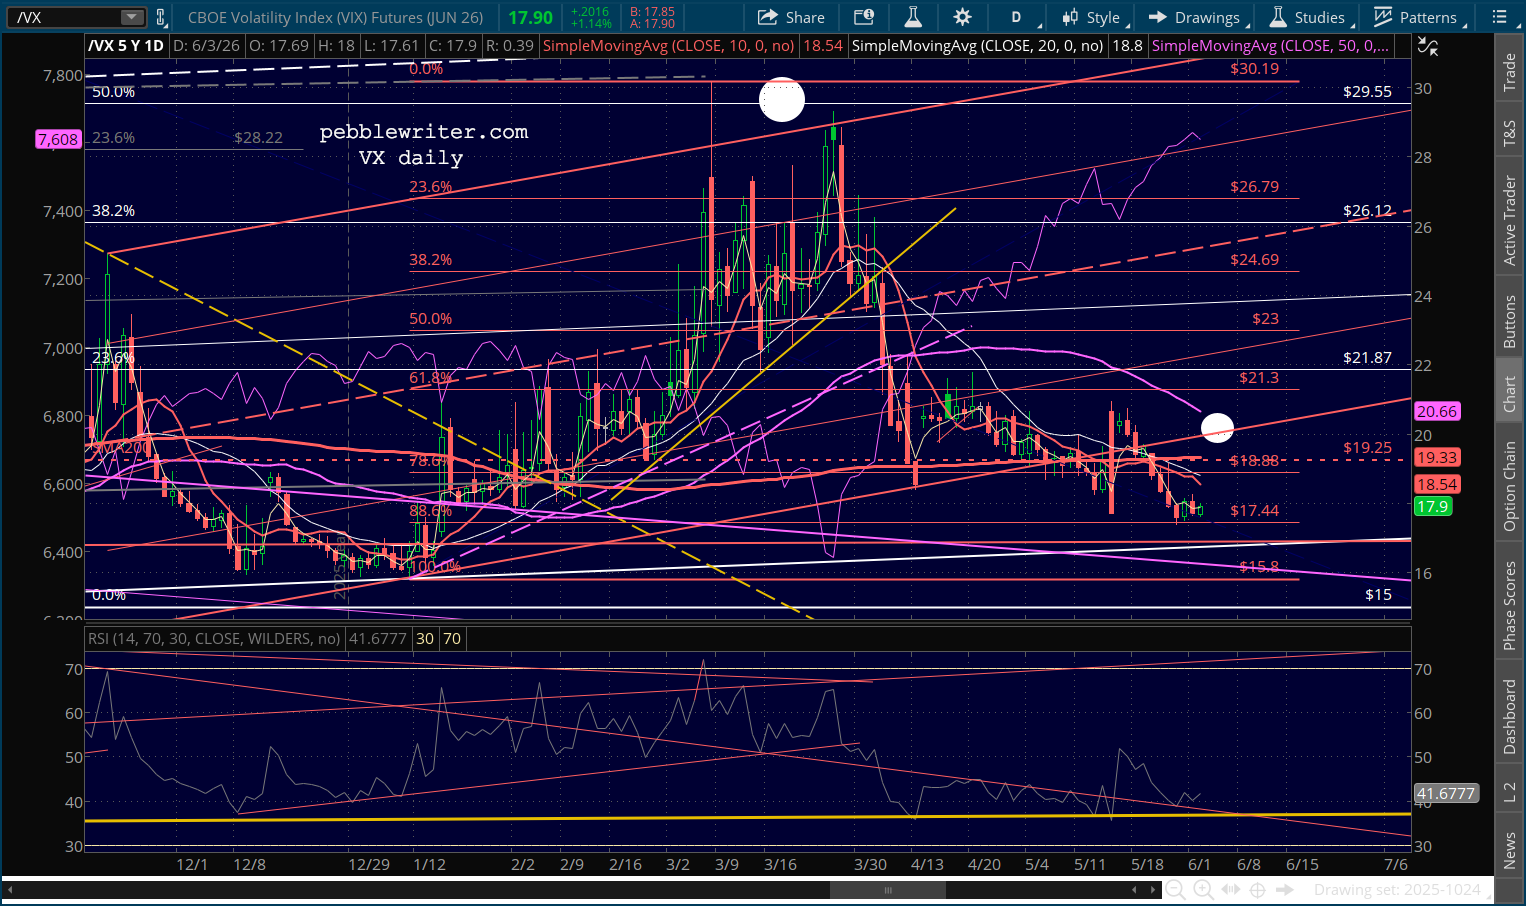
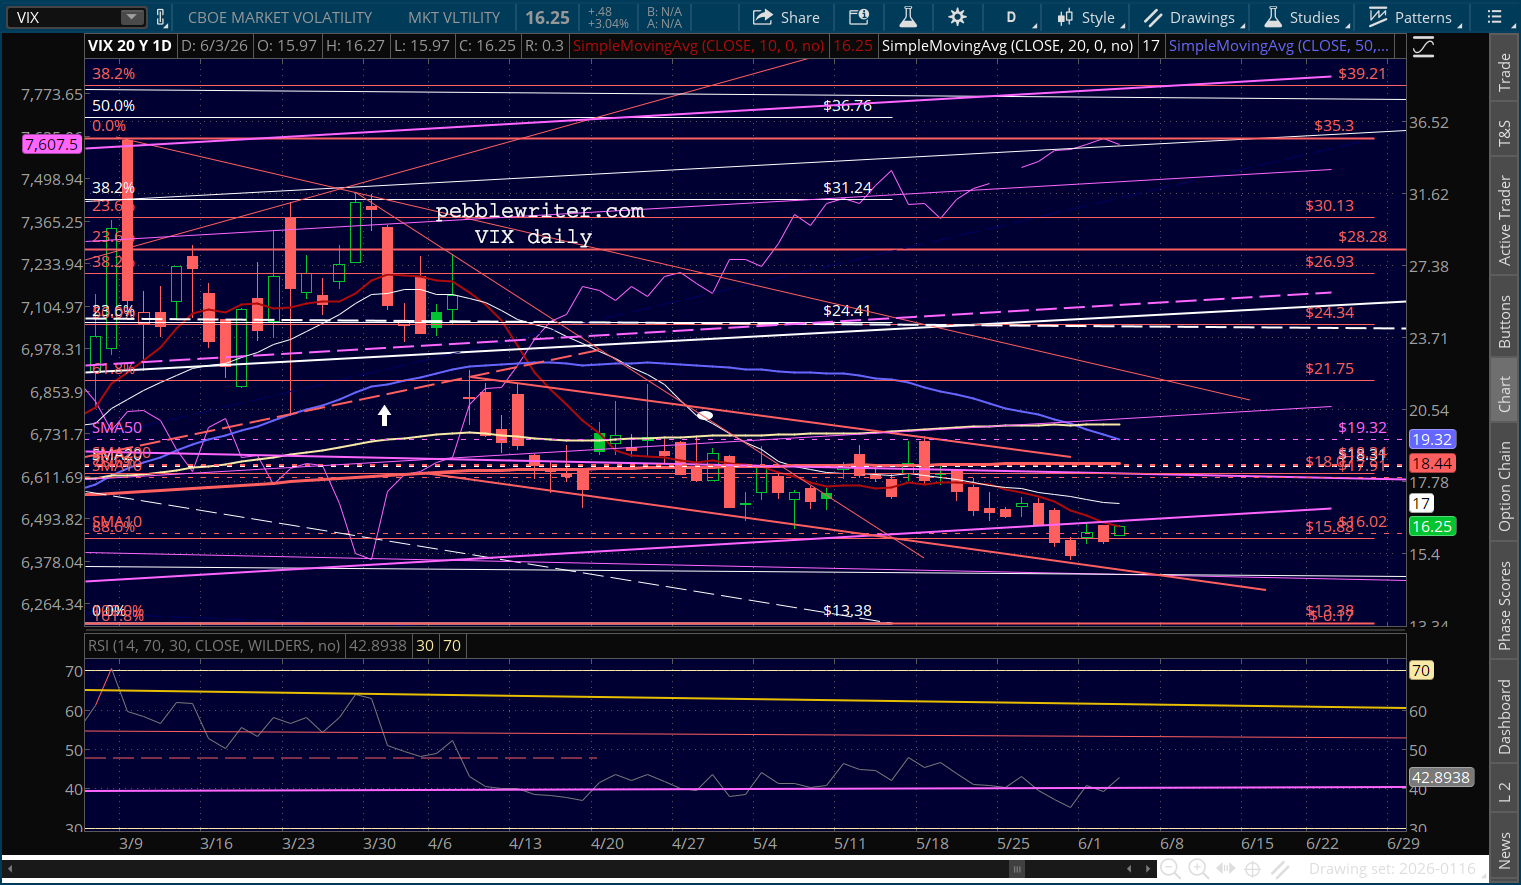
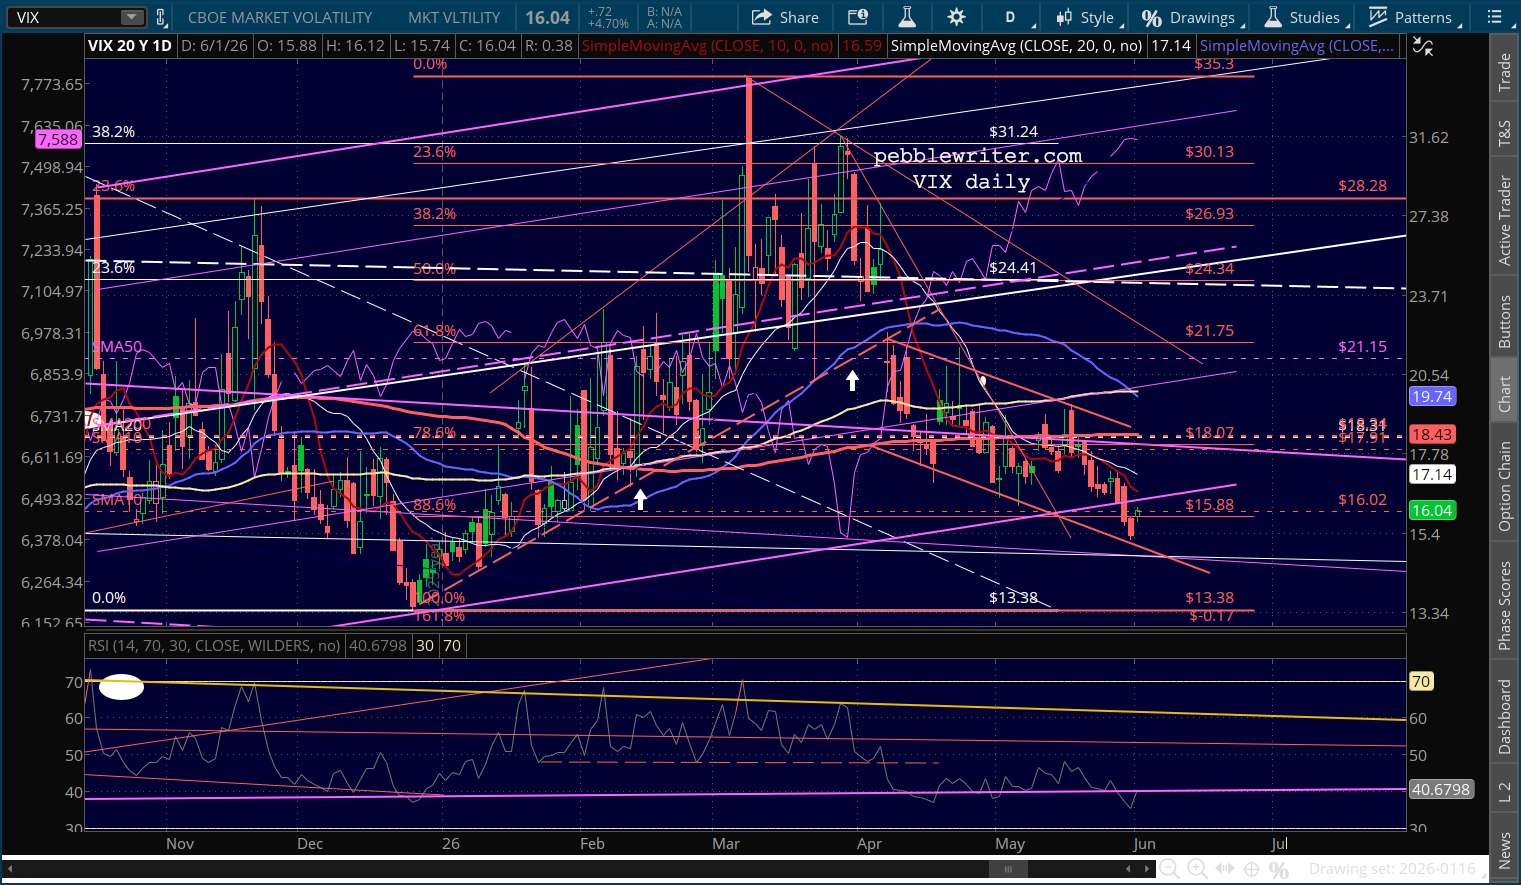
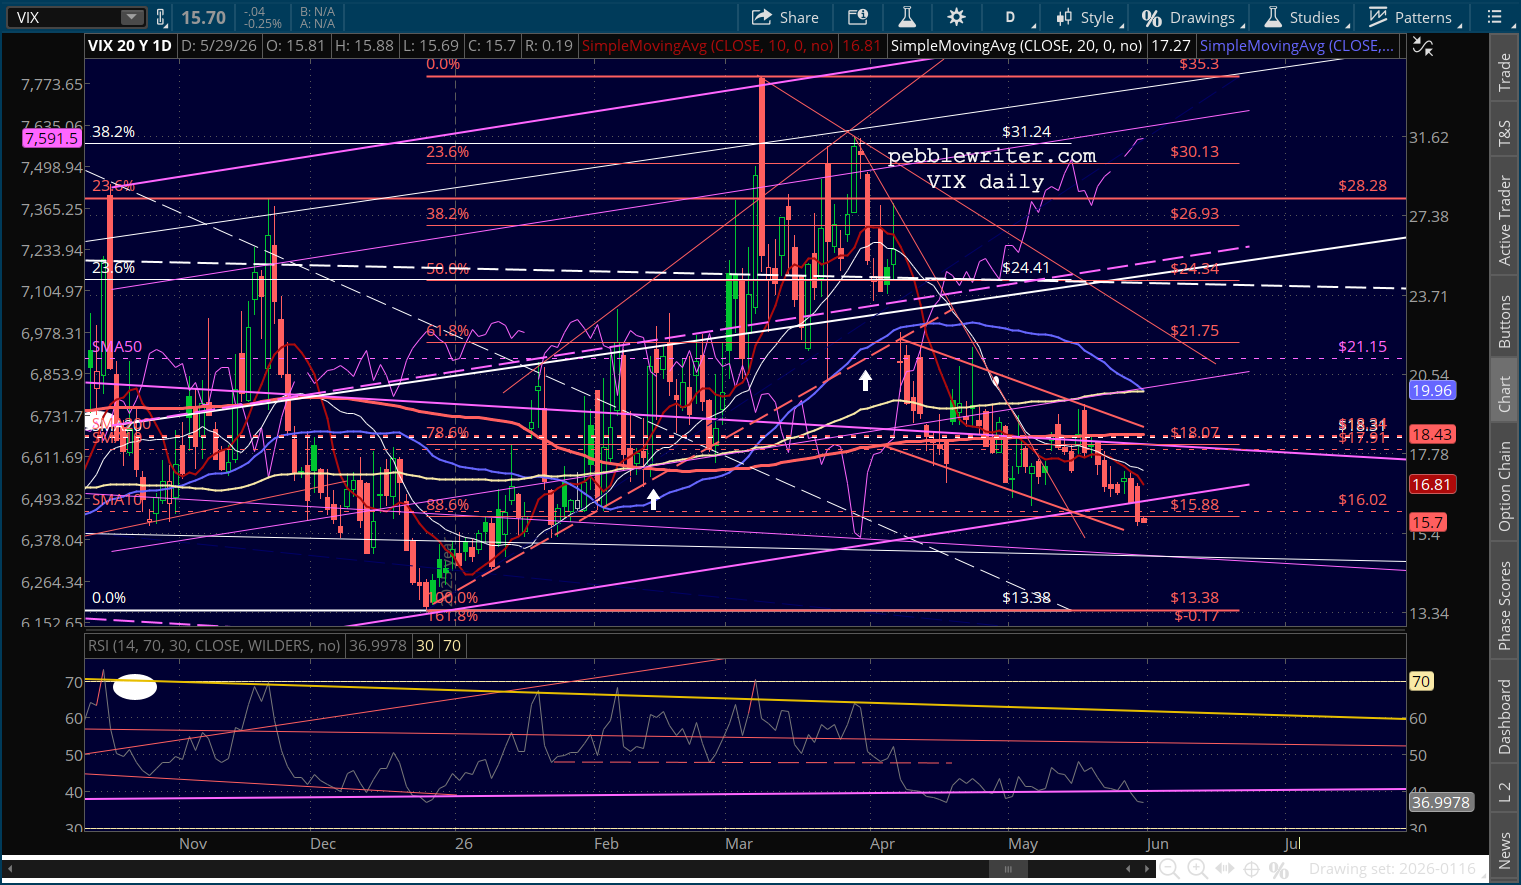
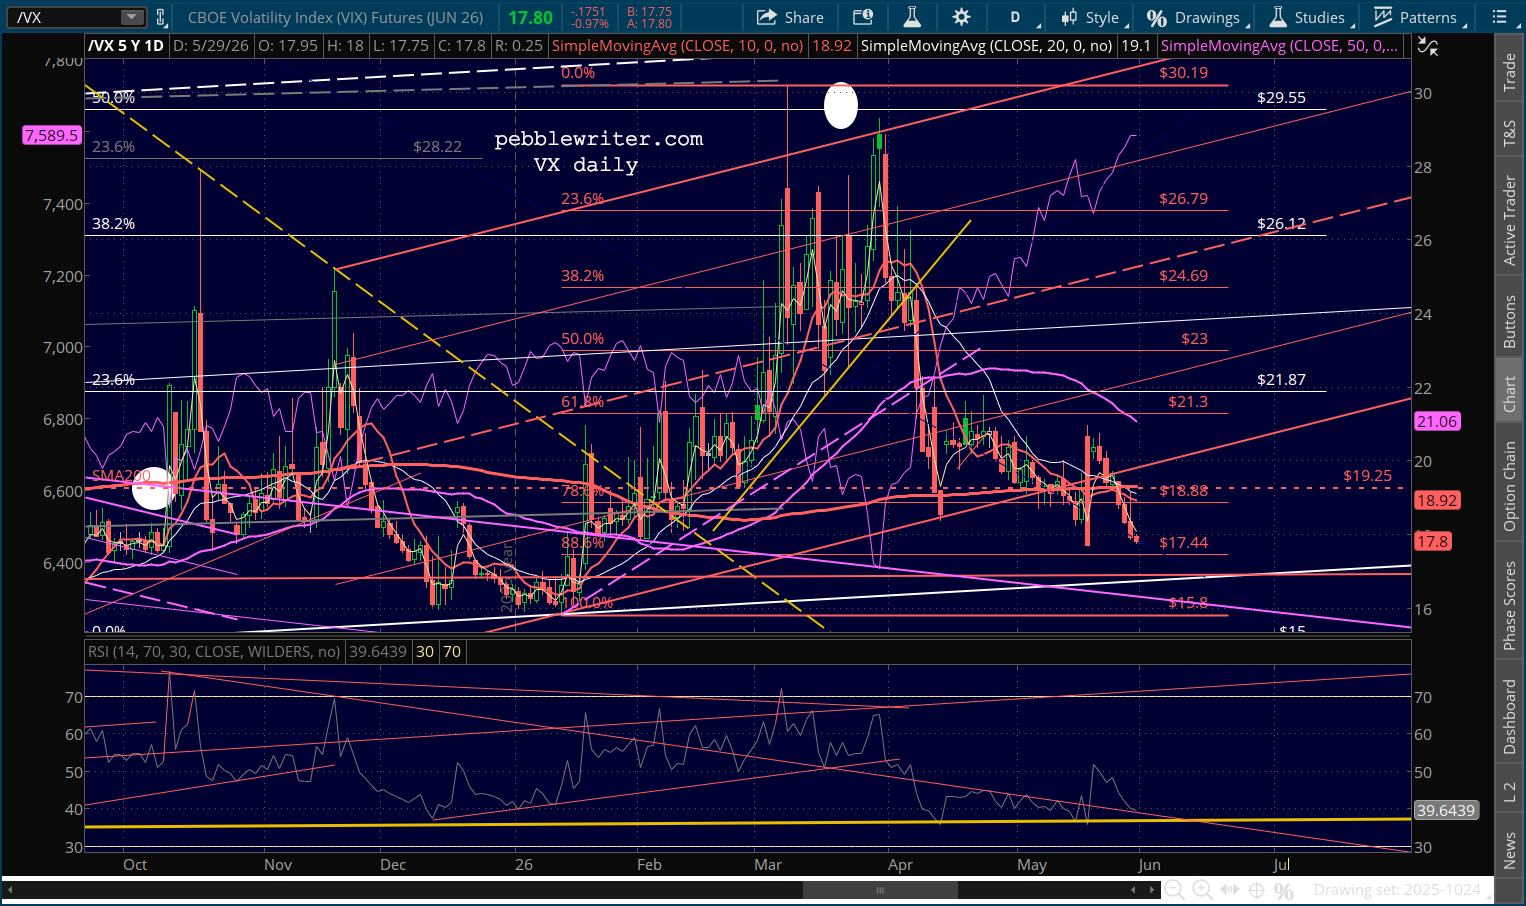
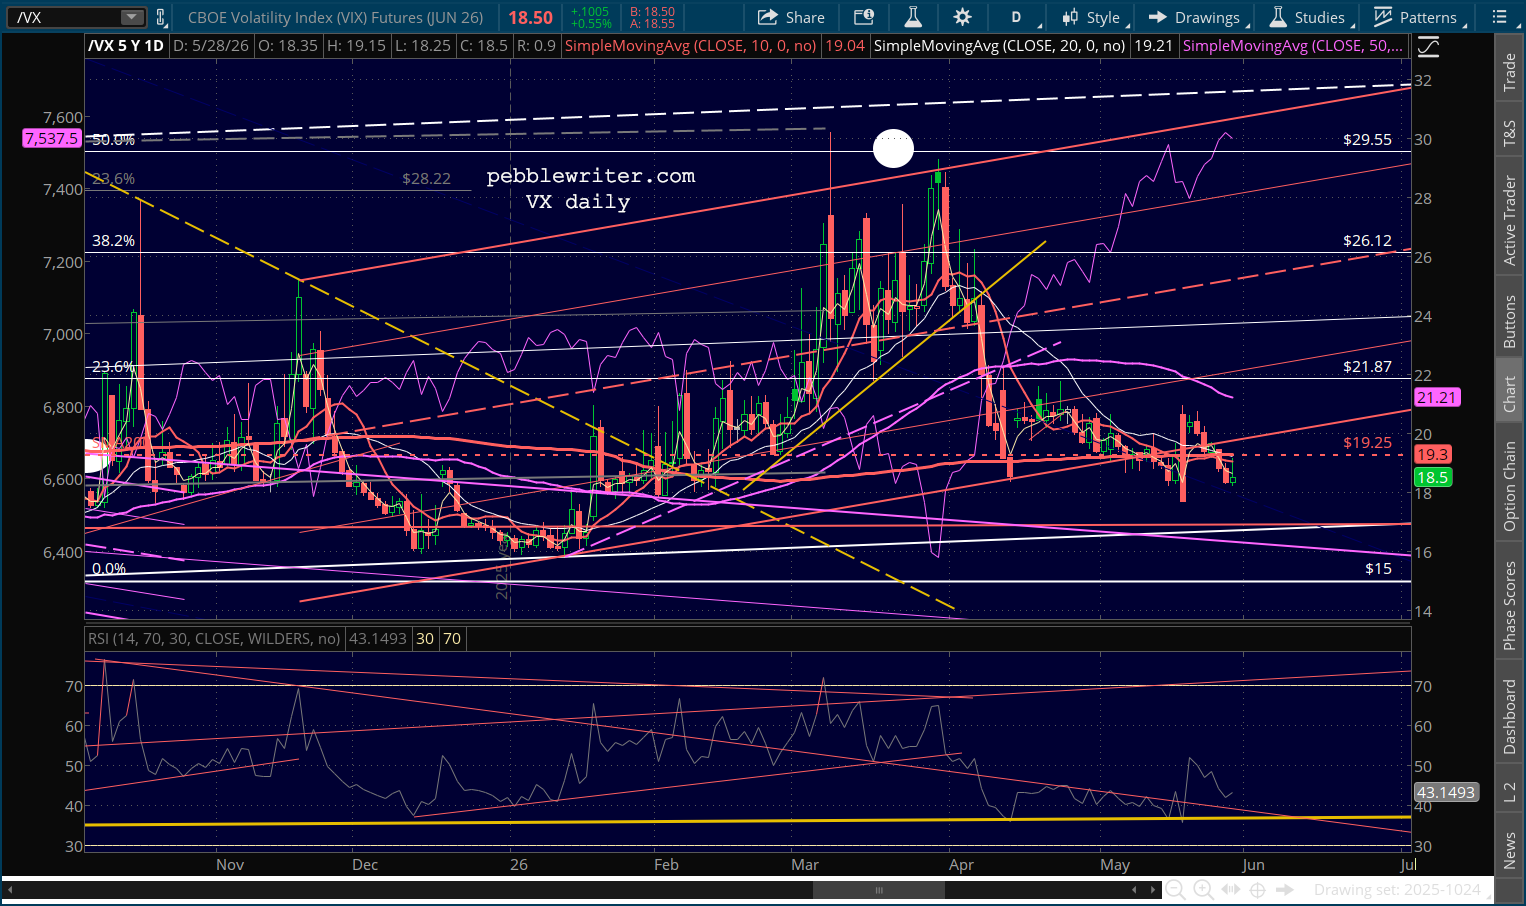
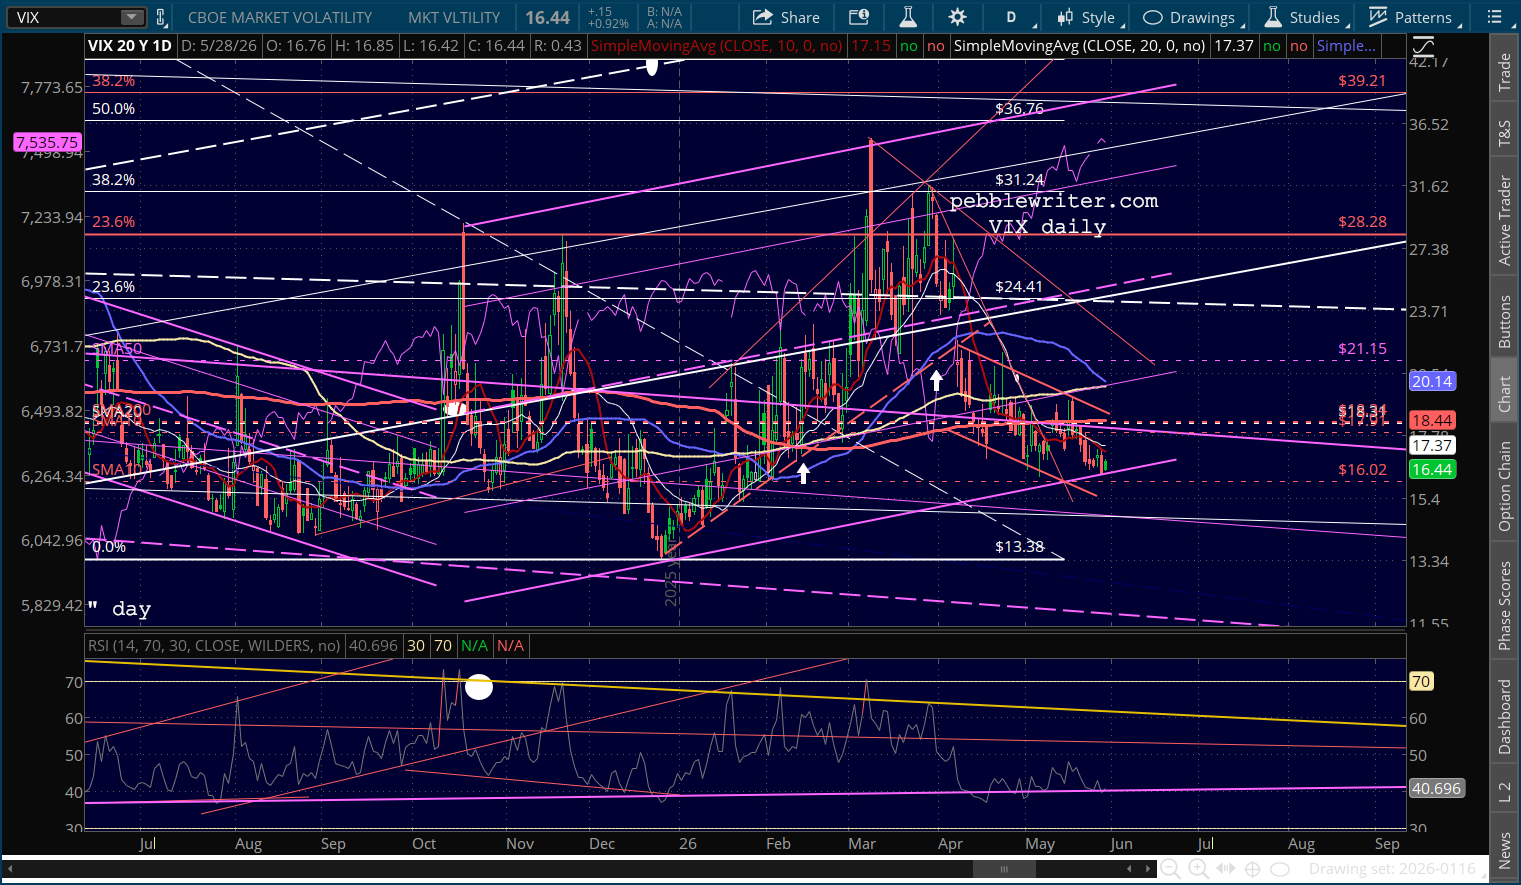
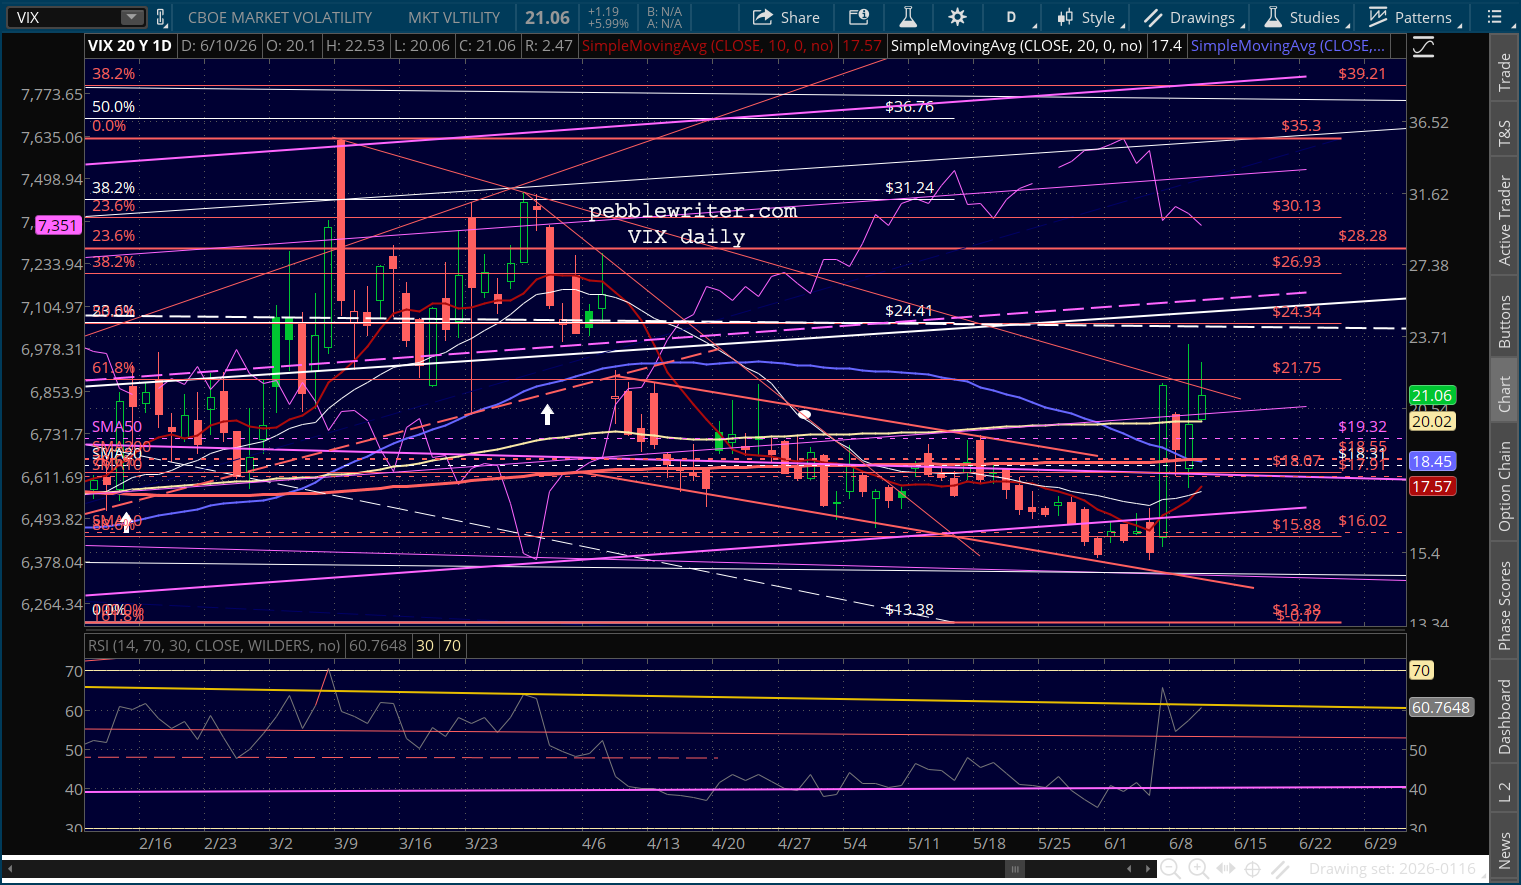
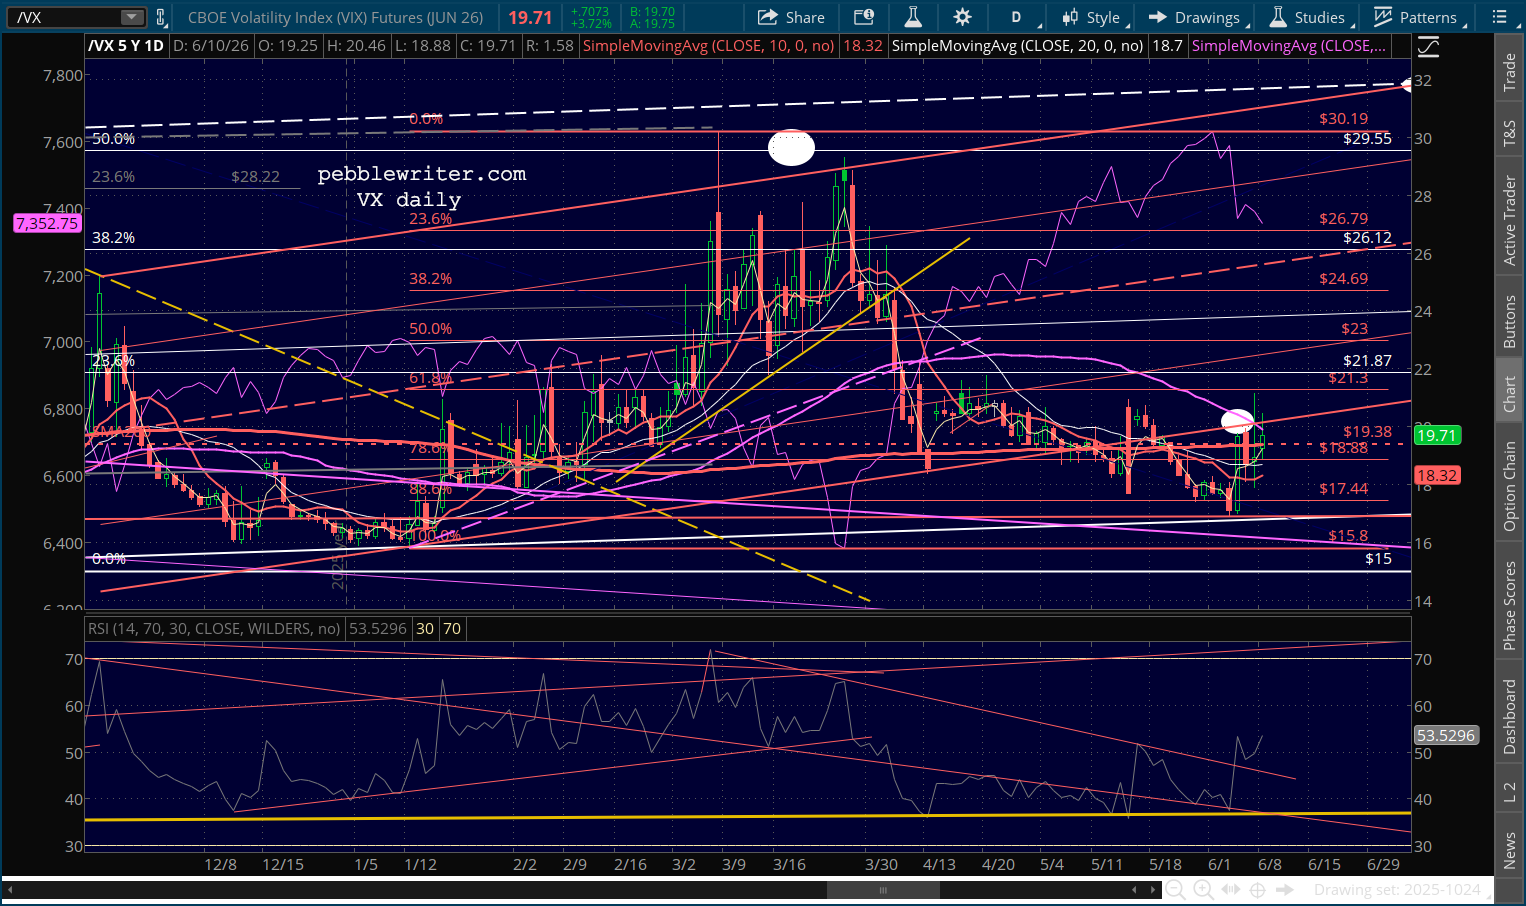
We could say the same for VIX and VX – both of which broke out yesterday but thought better of it.
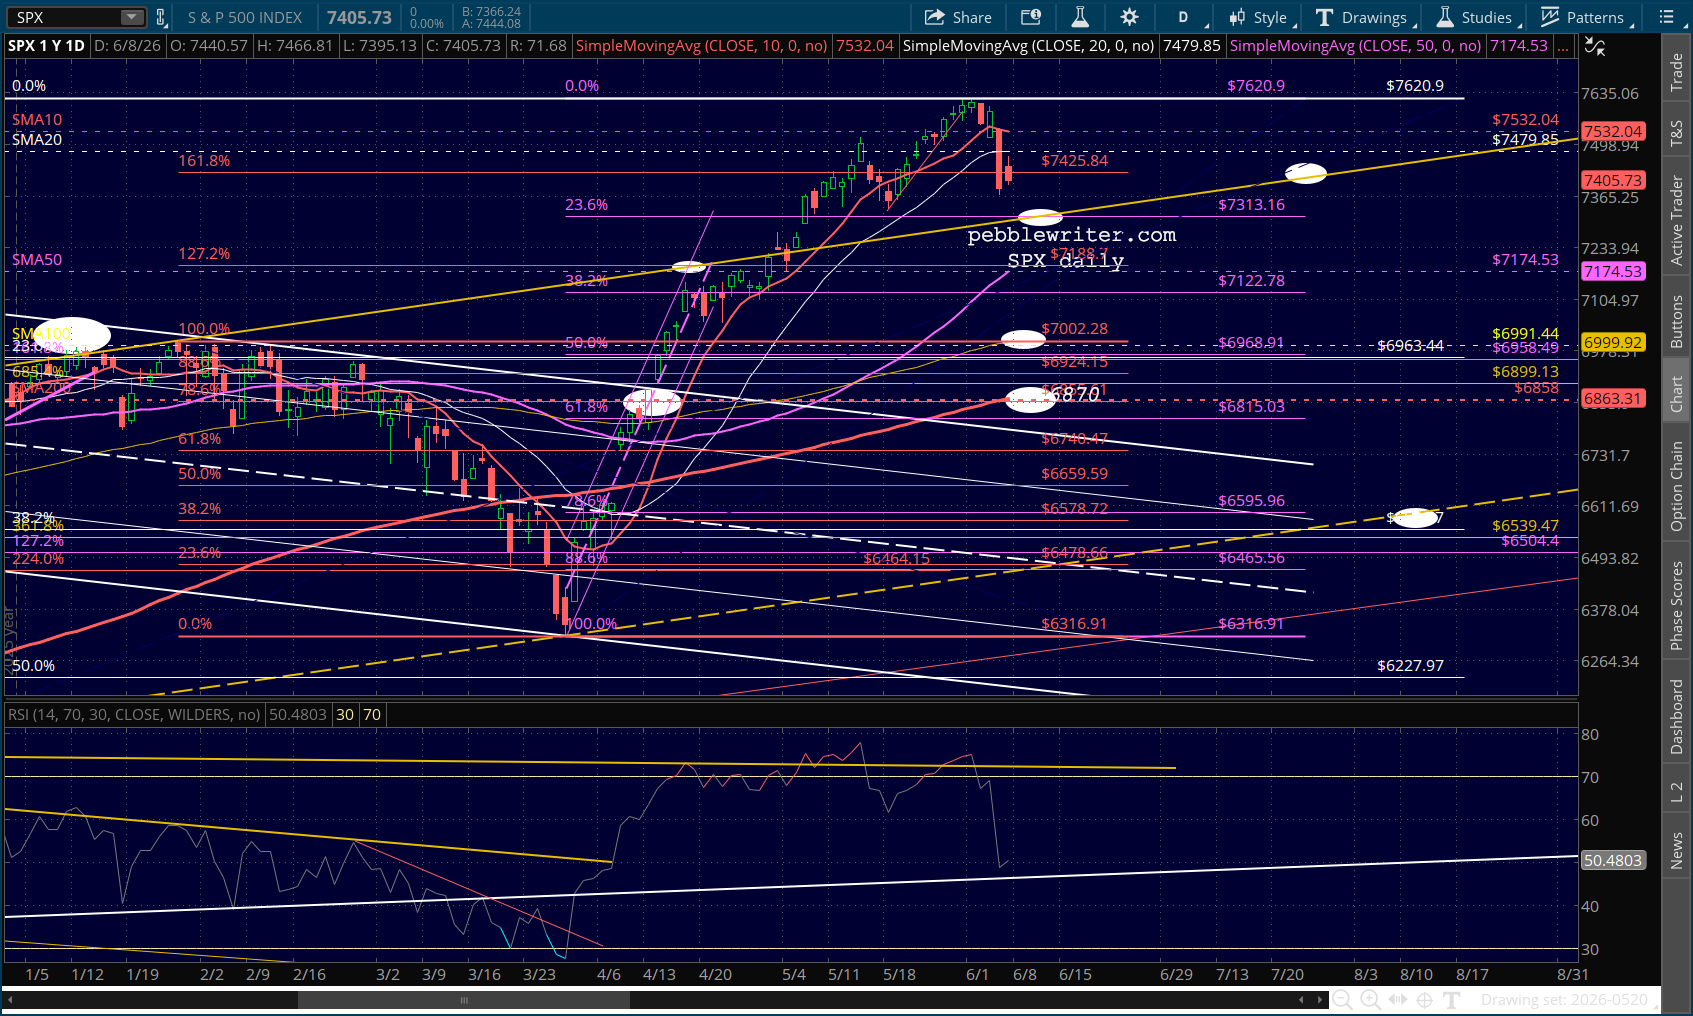
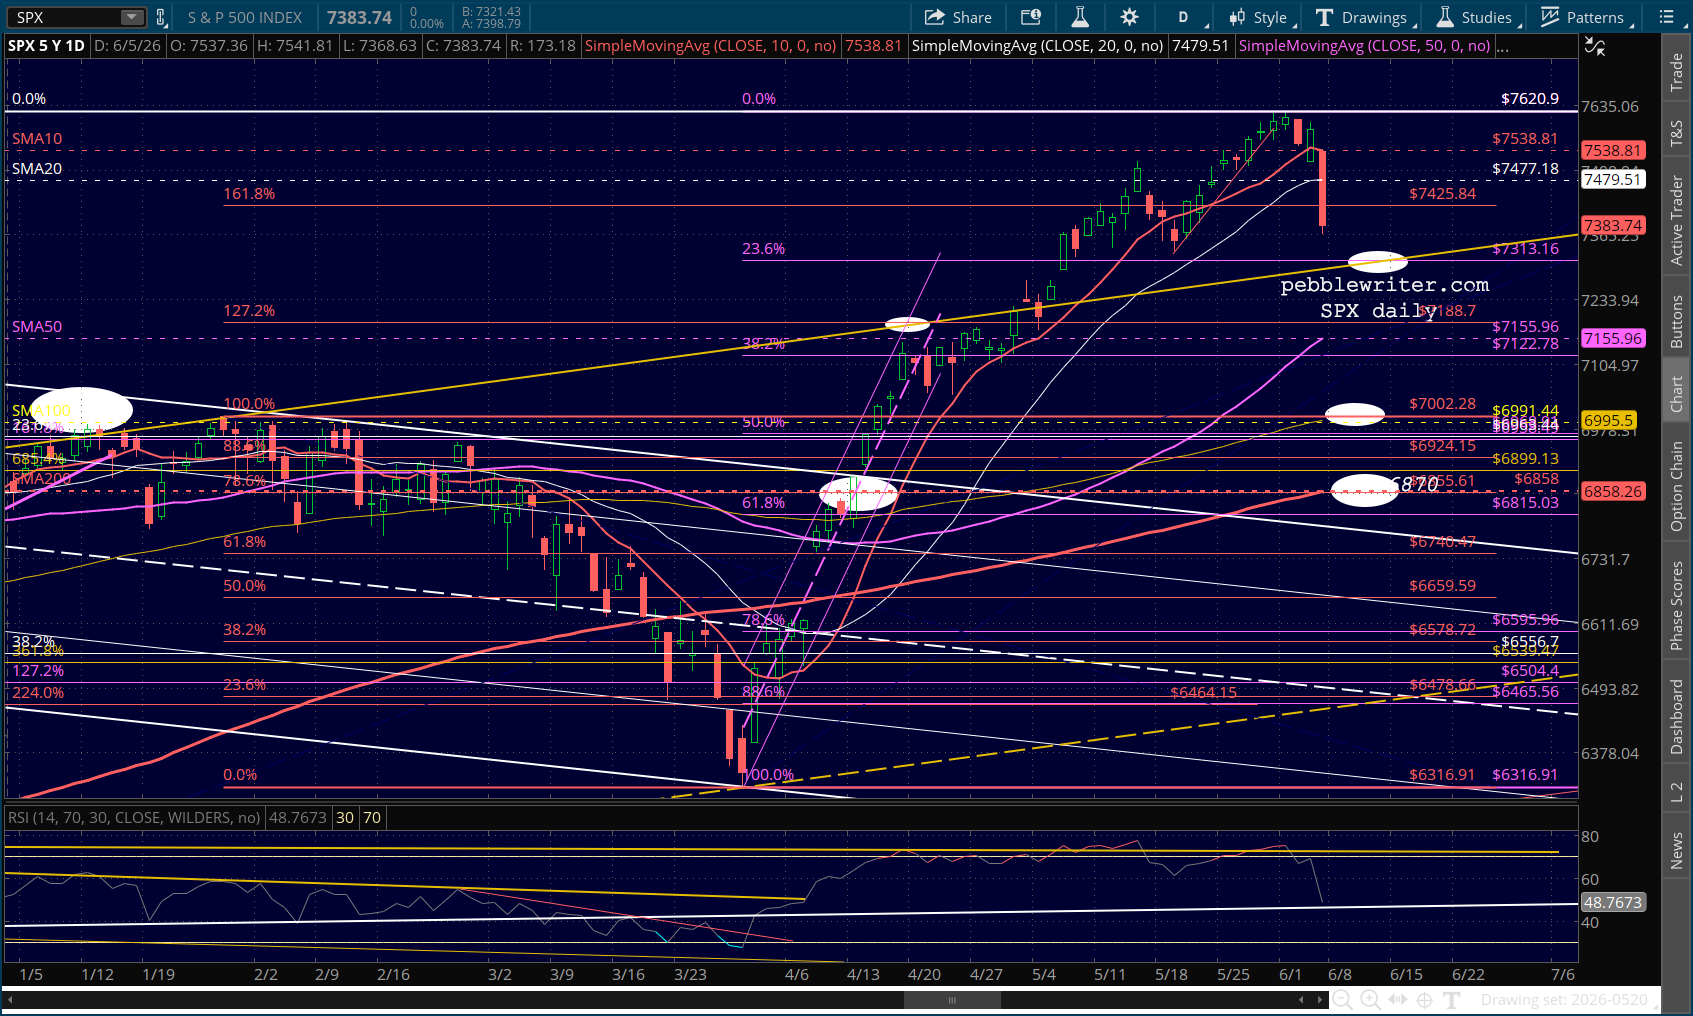
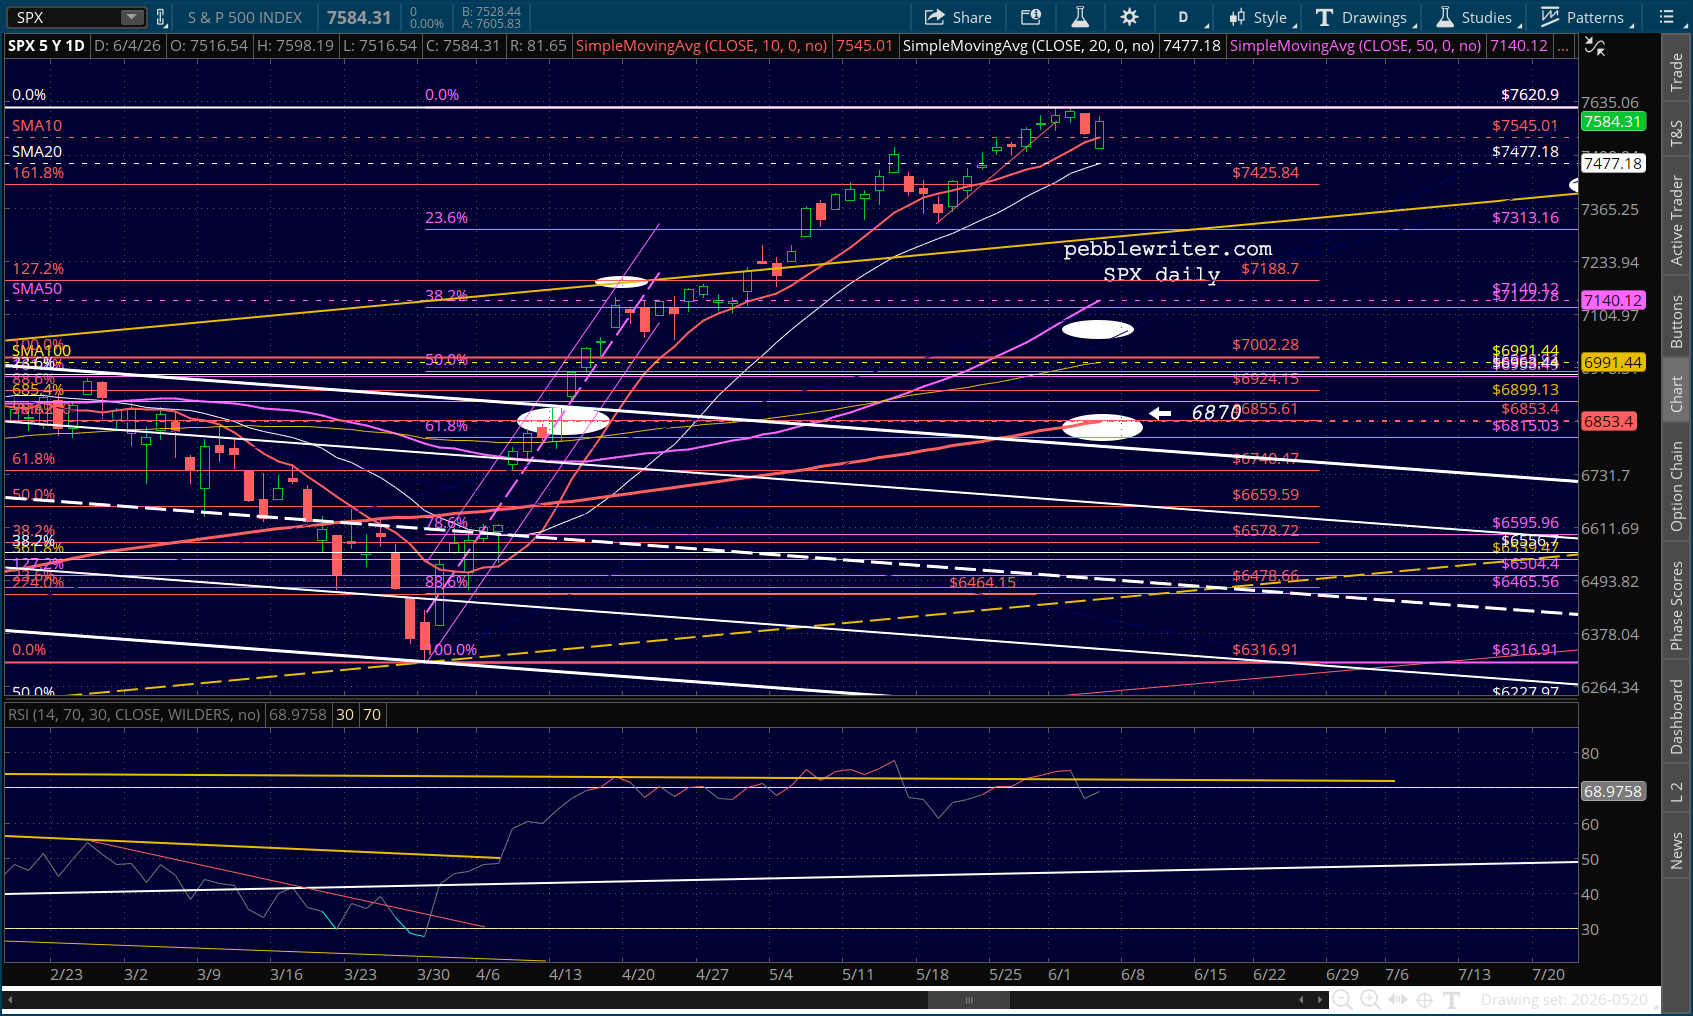
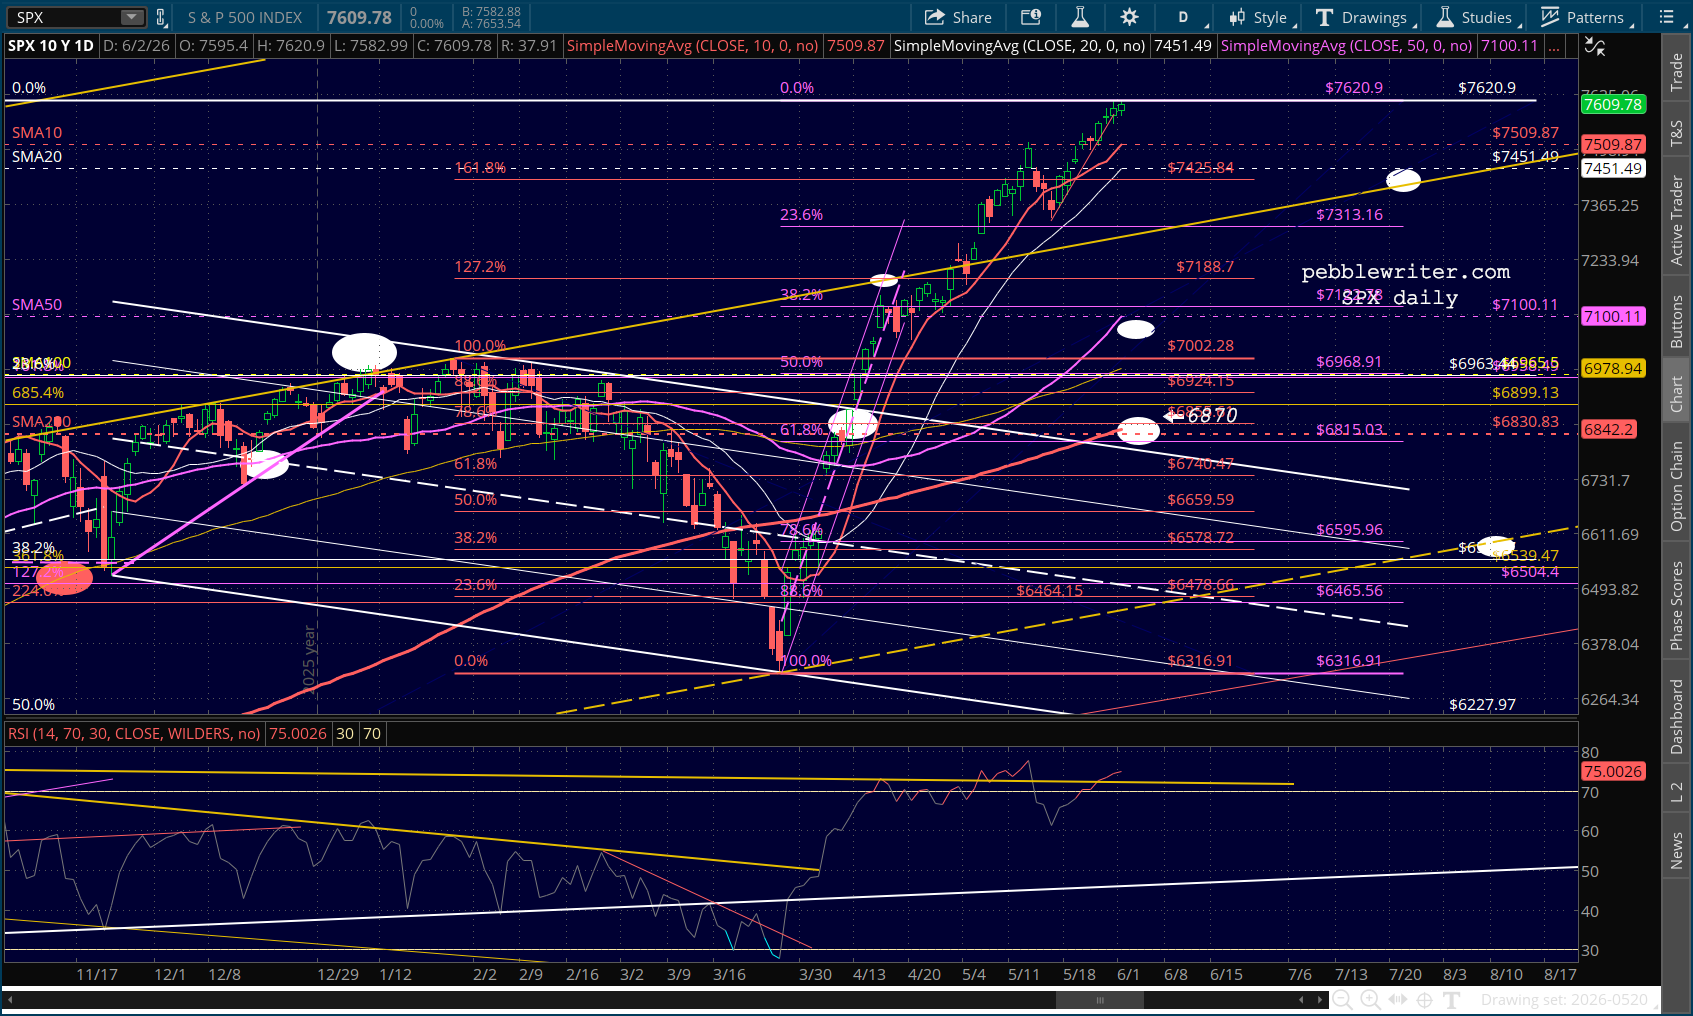
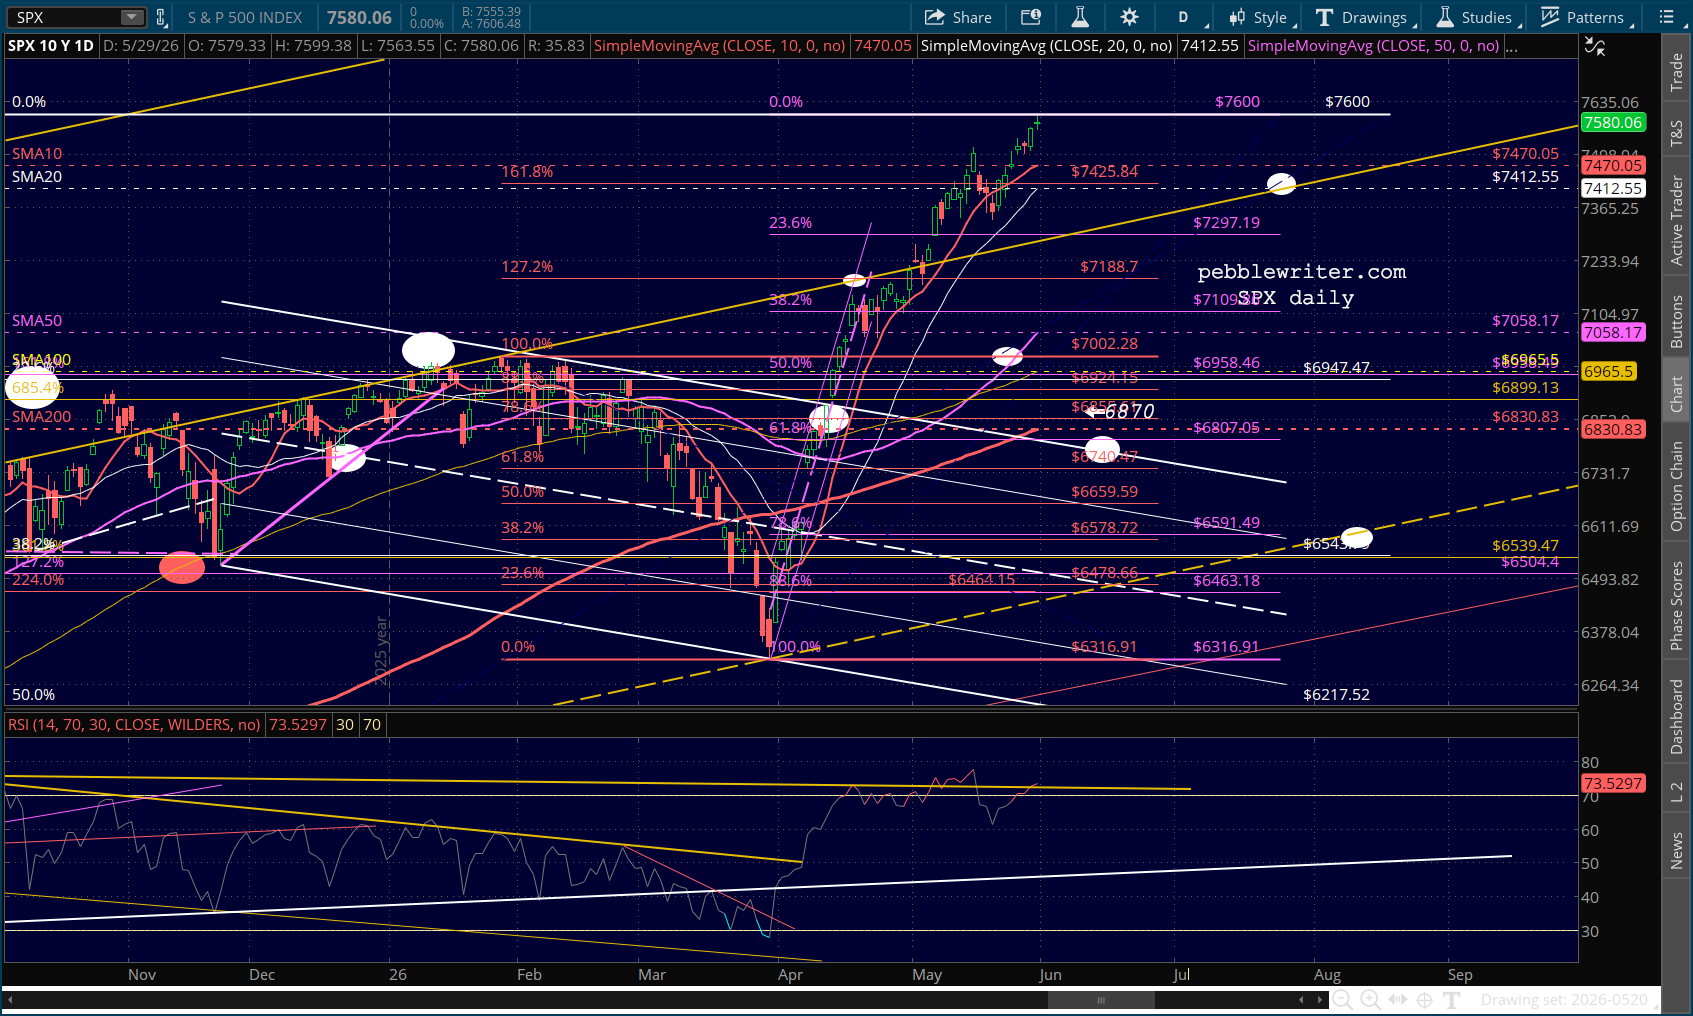
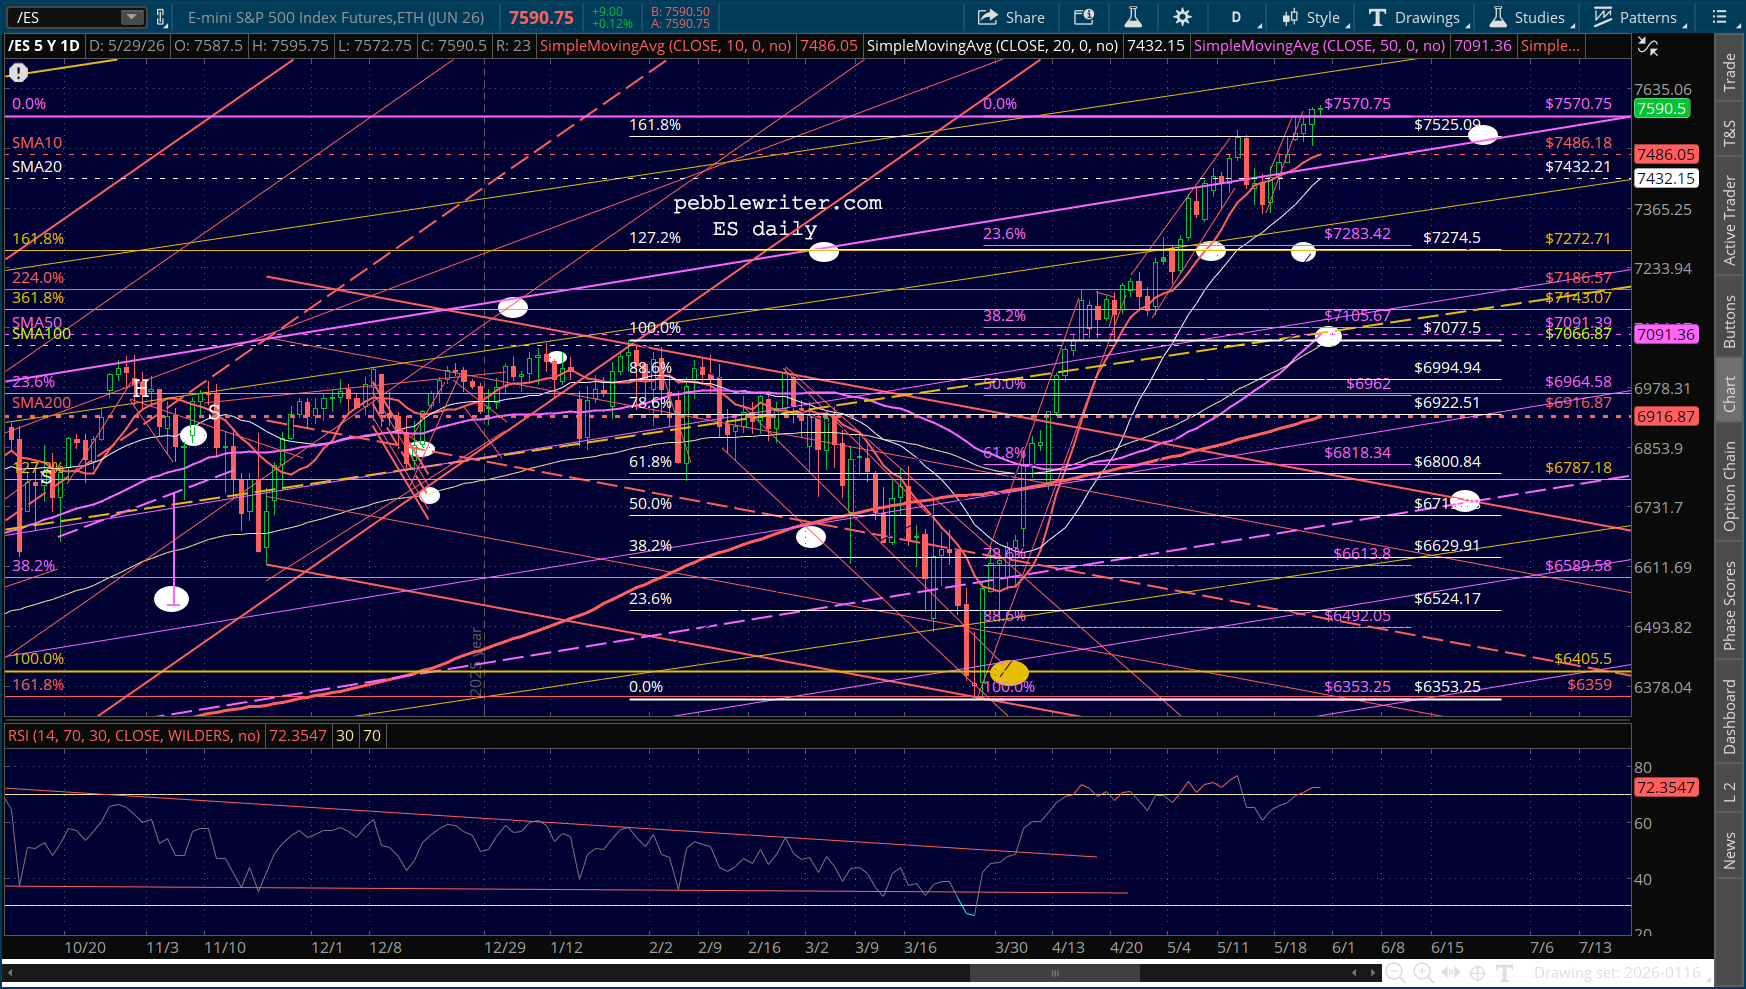
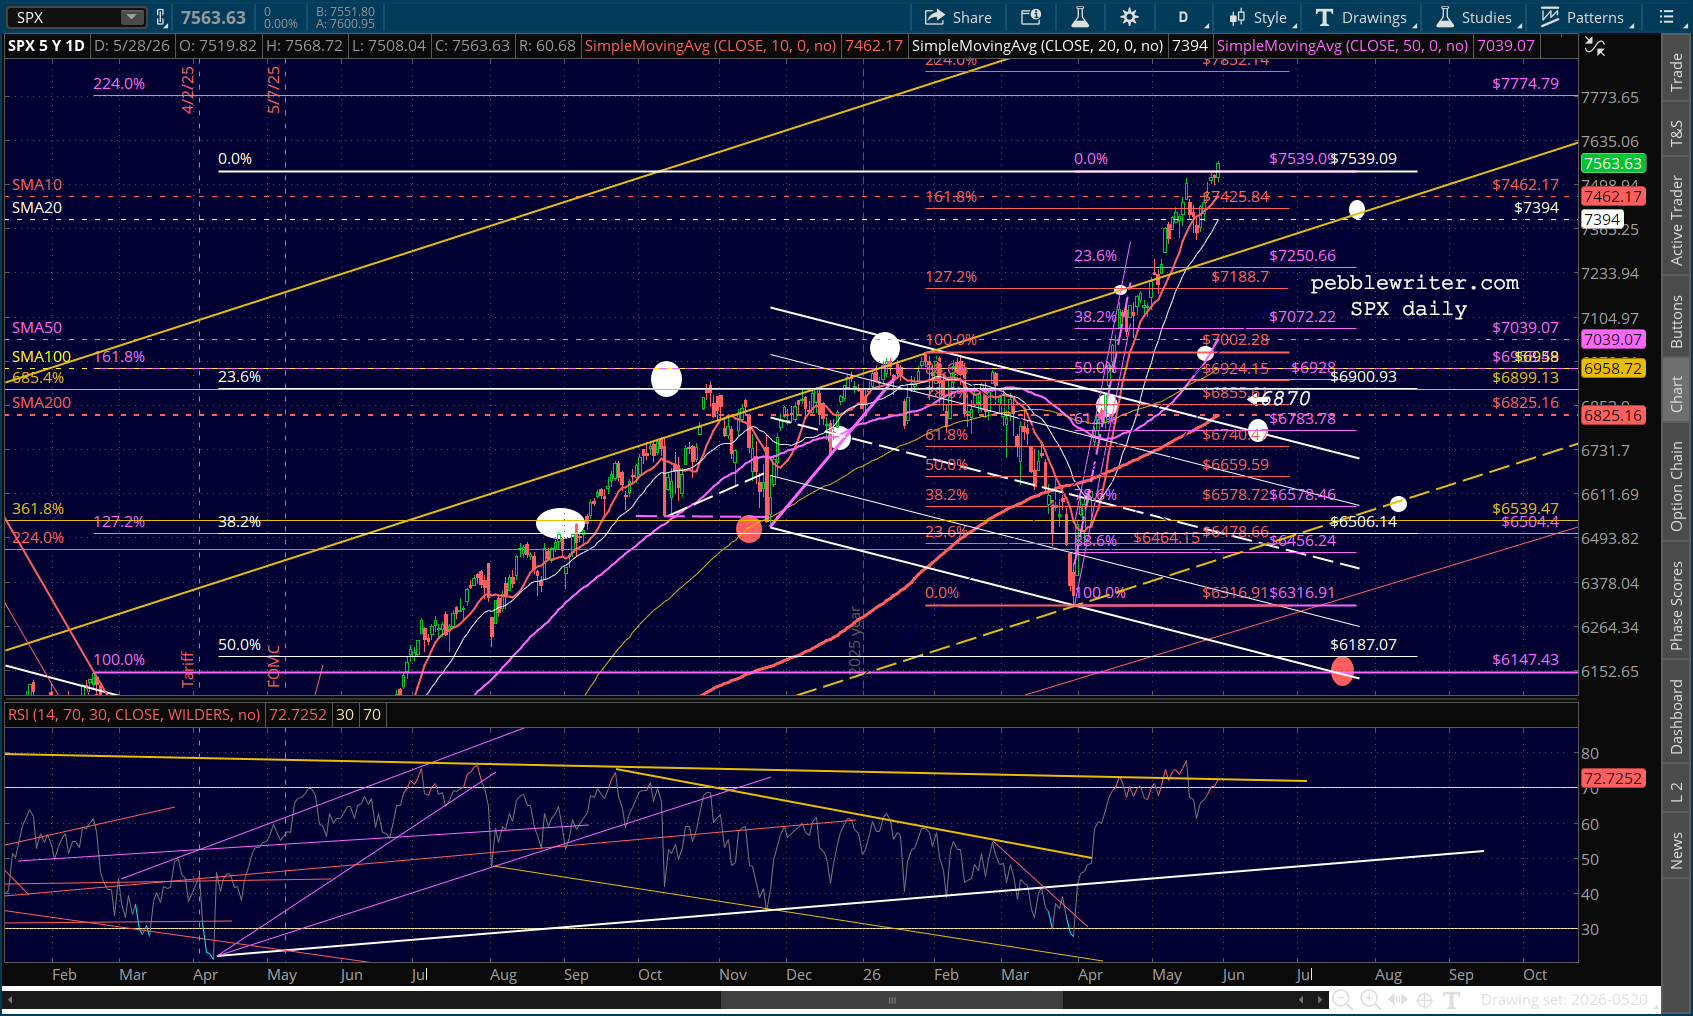
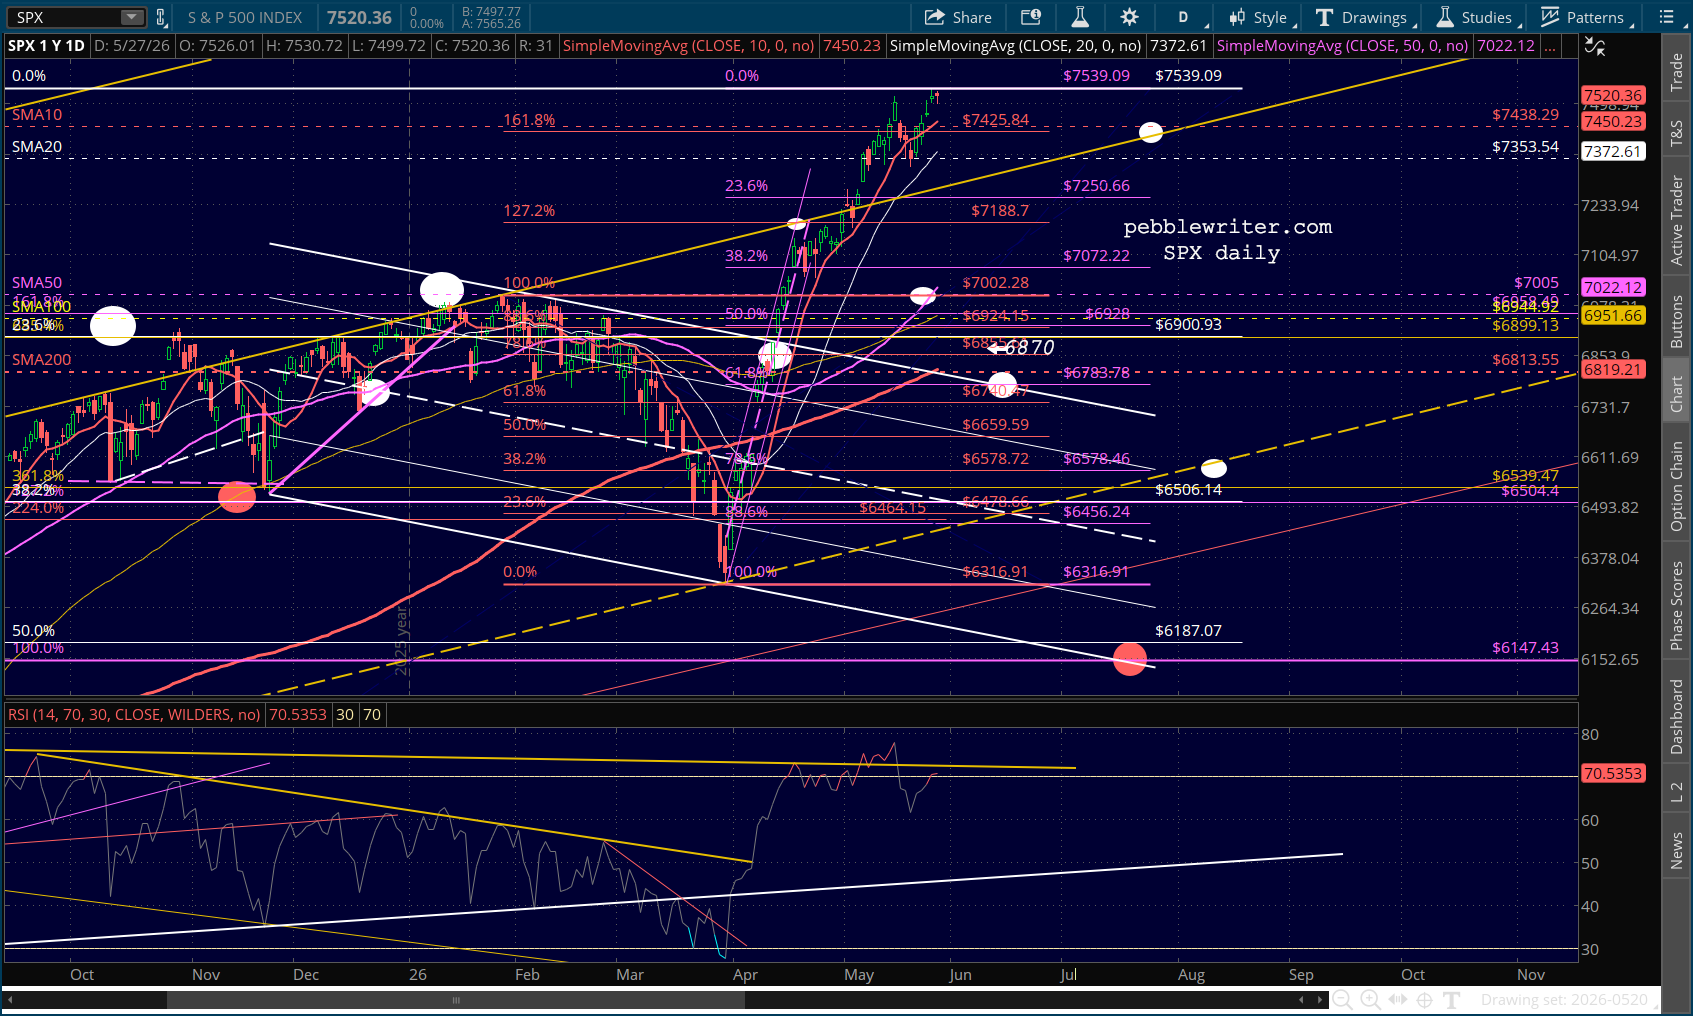
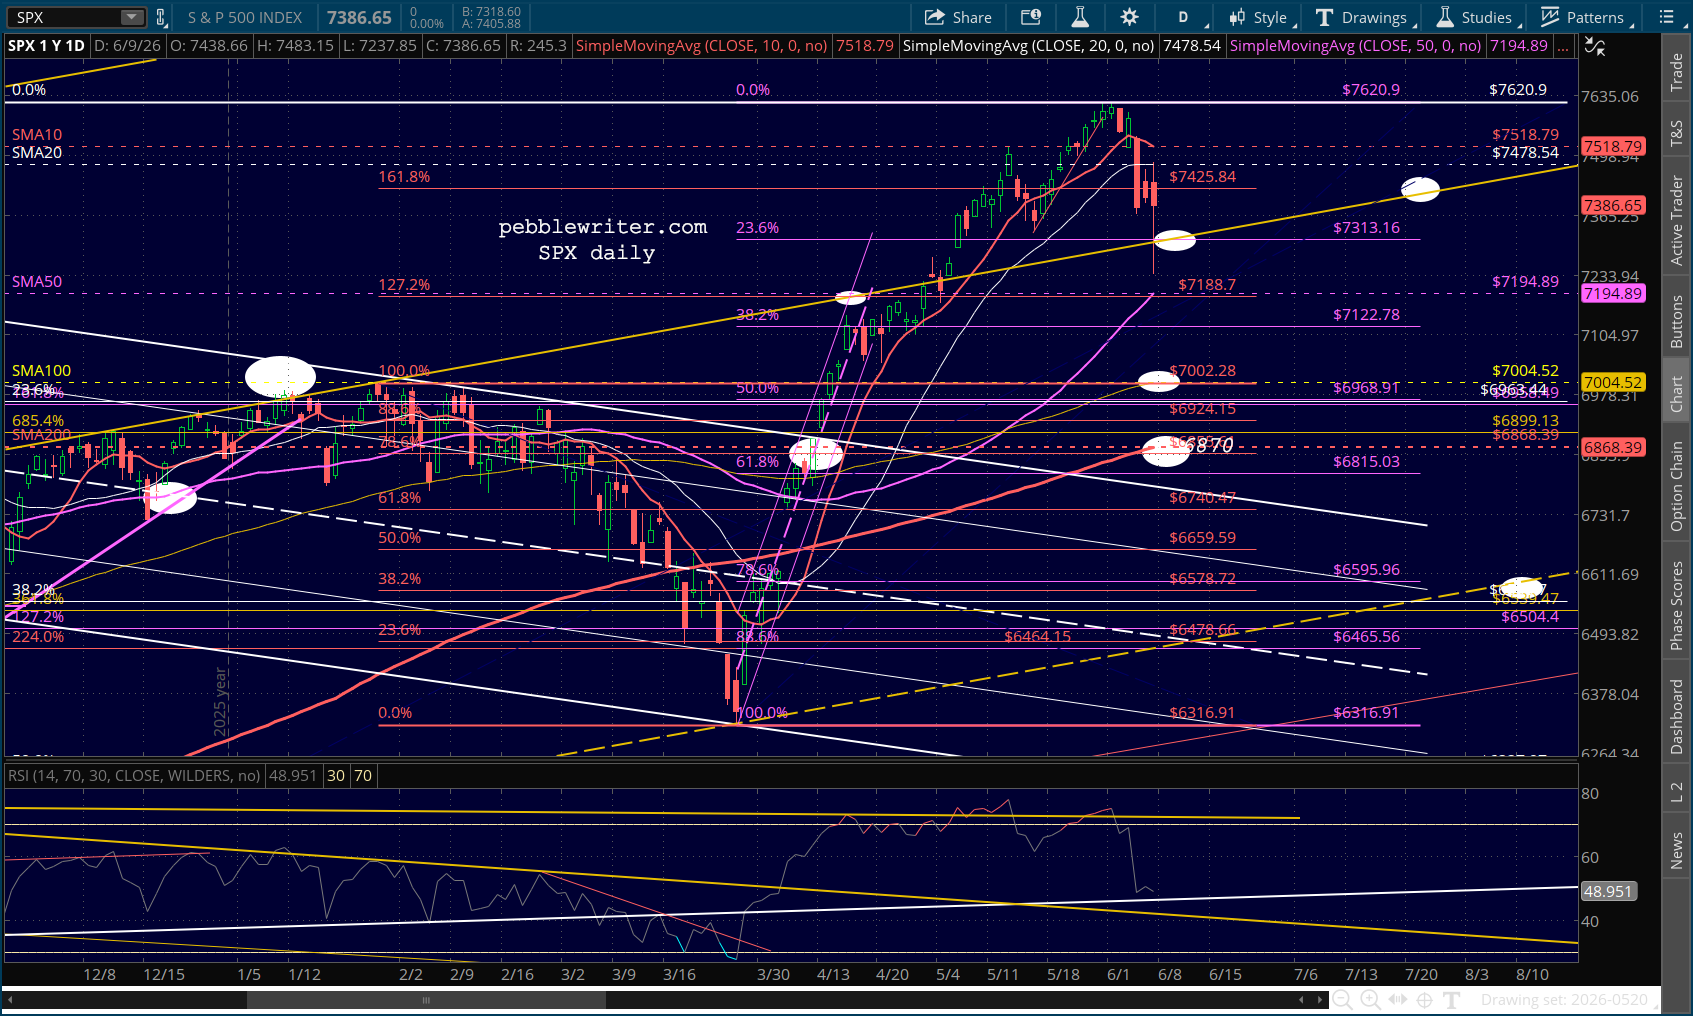
SPX backtested the yellow channel top, but like the ES never made it down to its SMA50 – a lapse by the men behind the curtain.
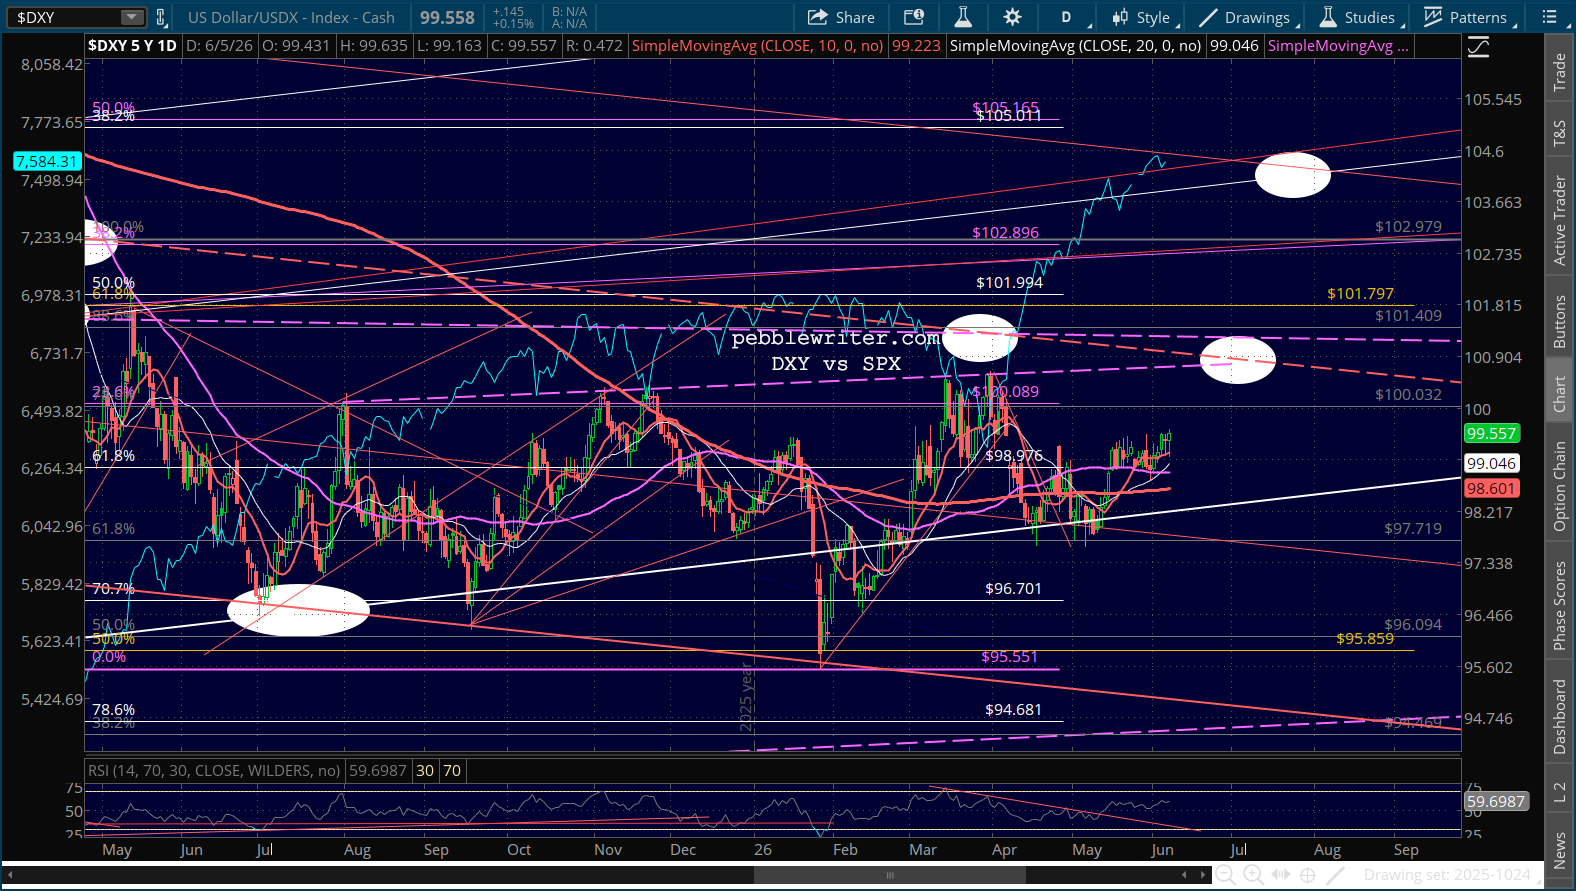
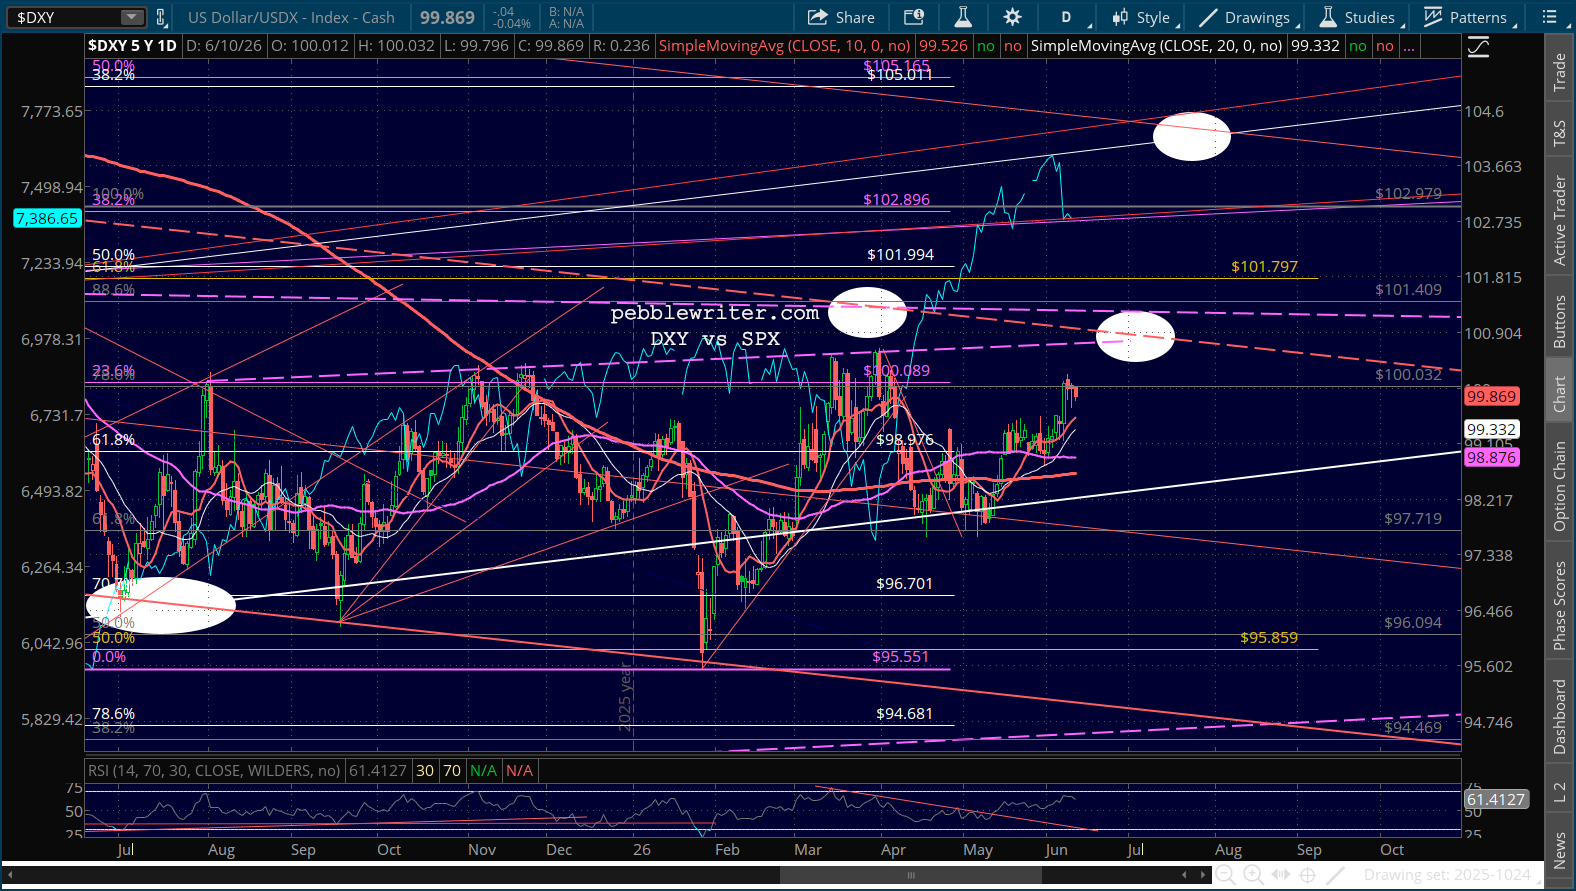
DXY paused prematurely, suggesting that stocks aren’t done correcting.
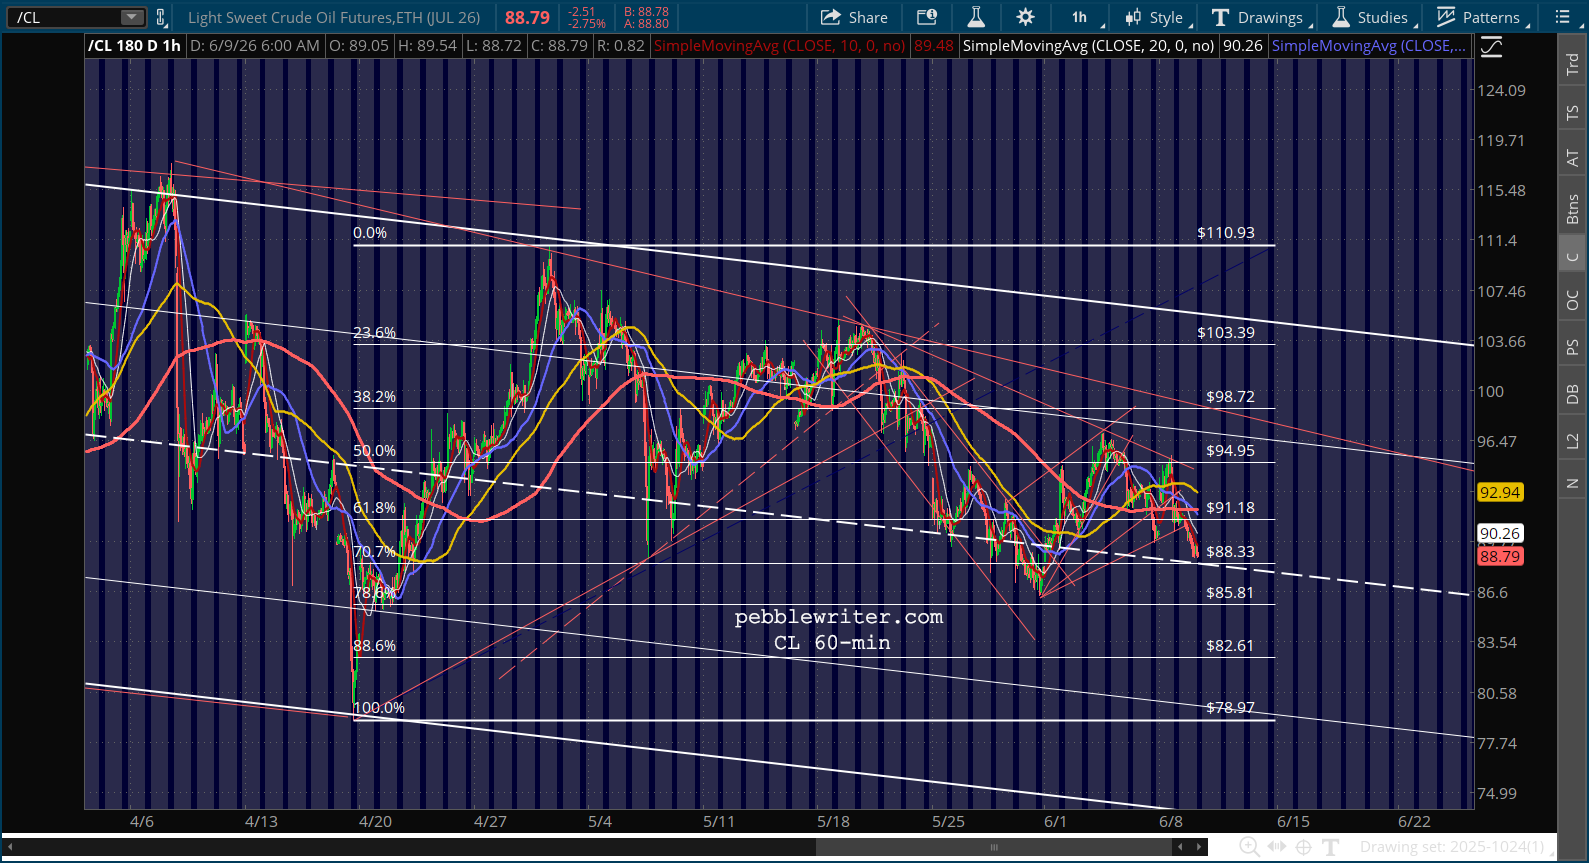
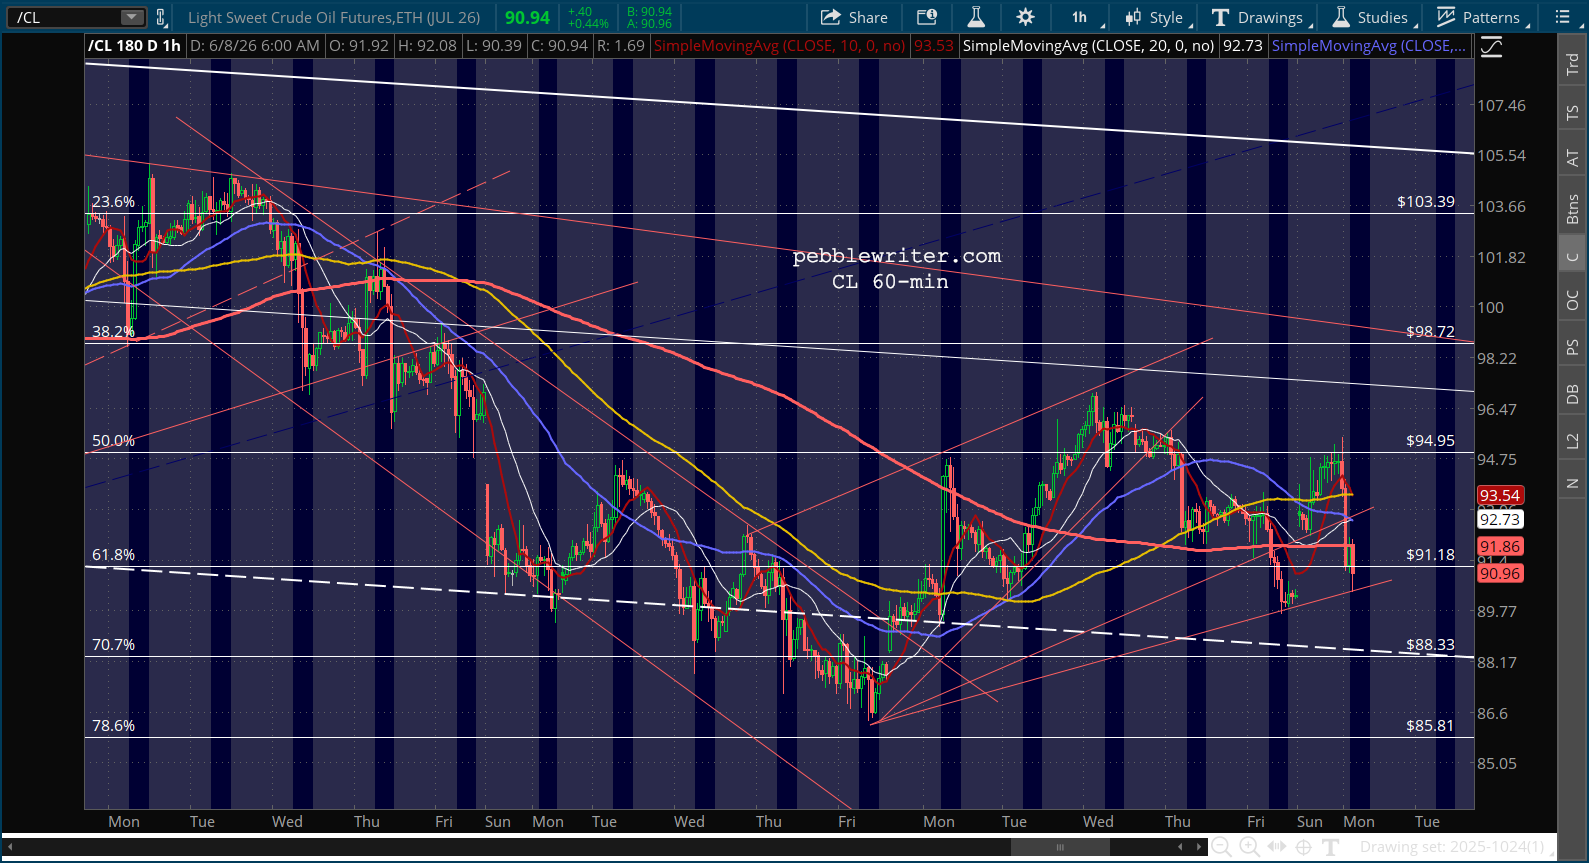
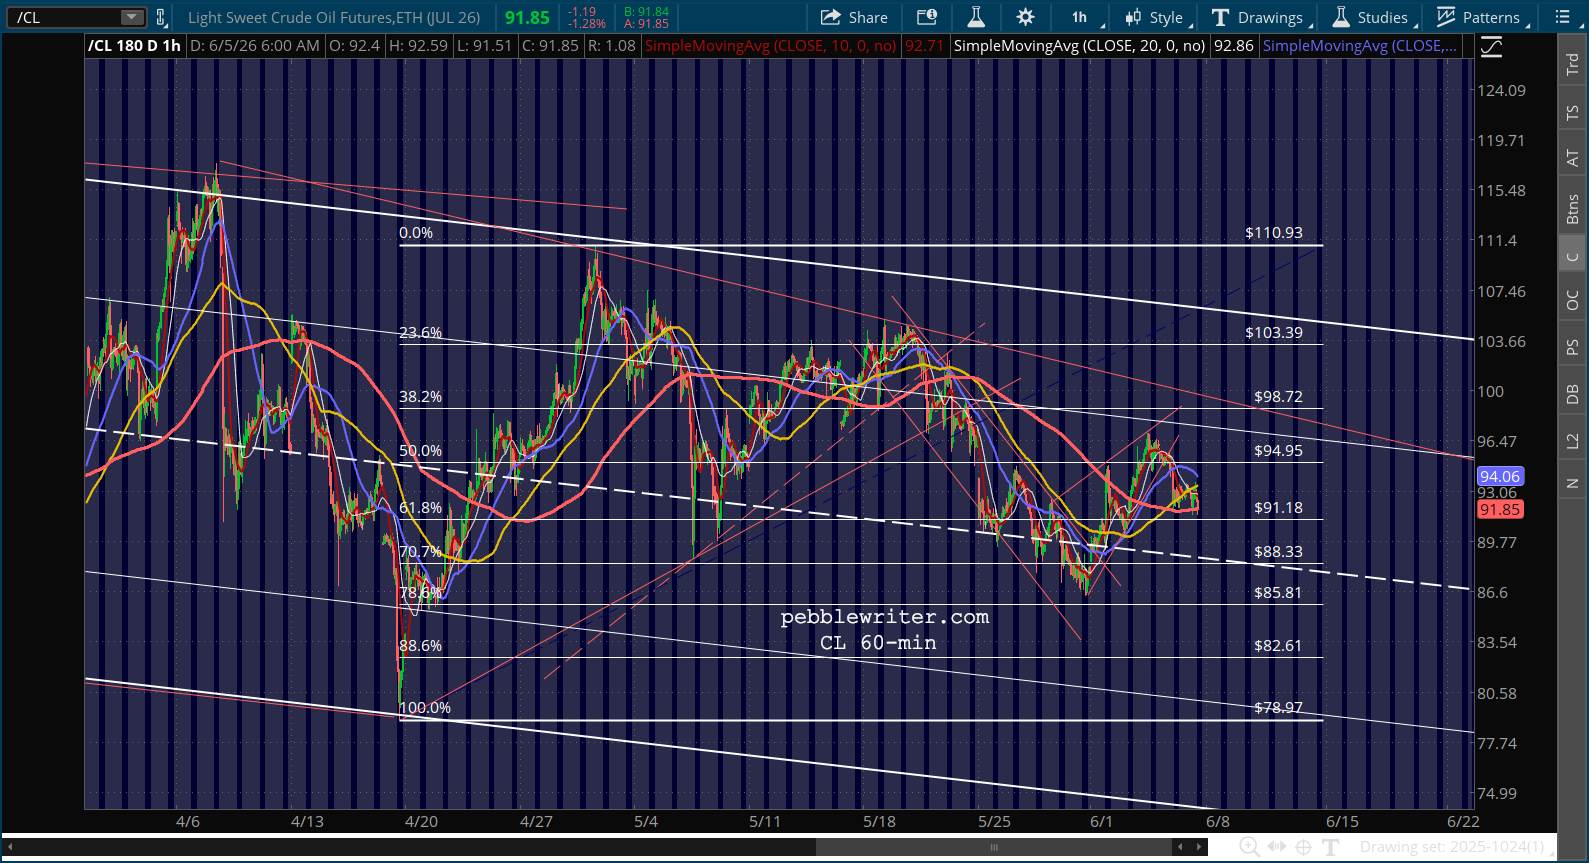
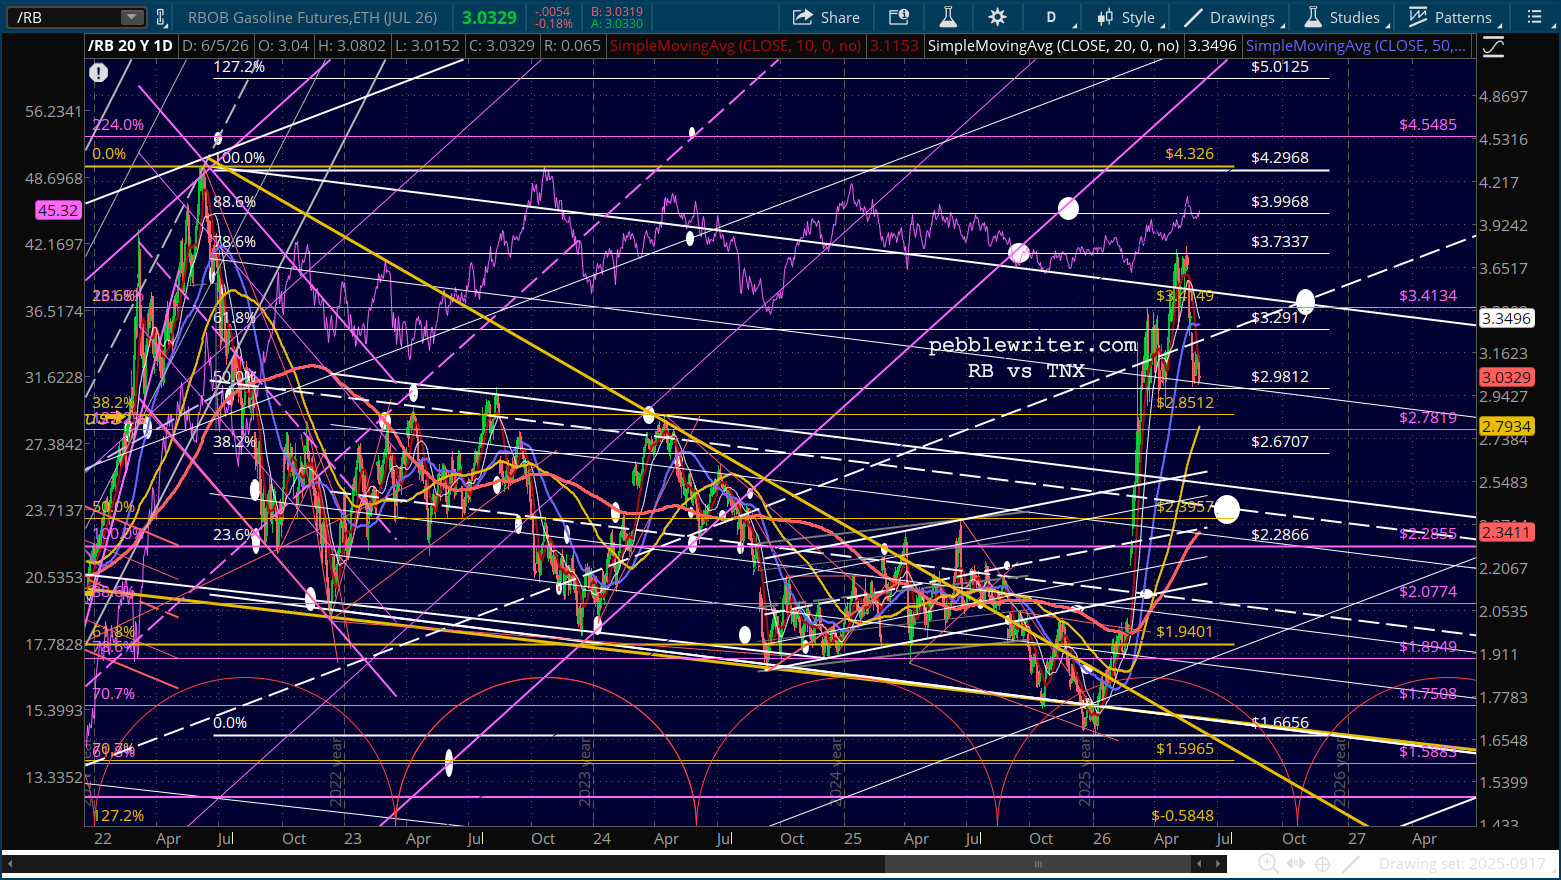
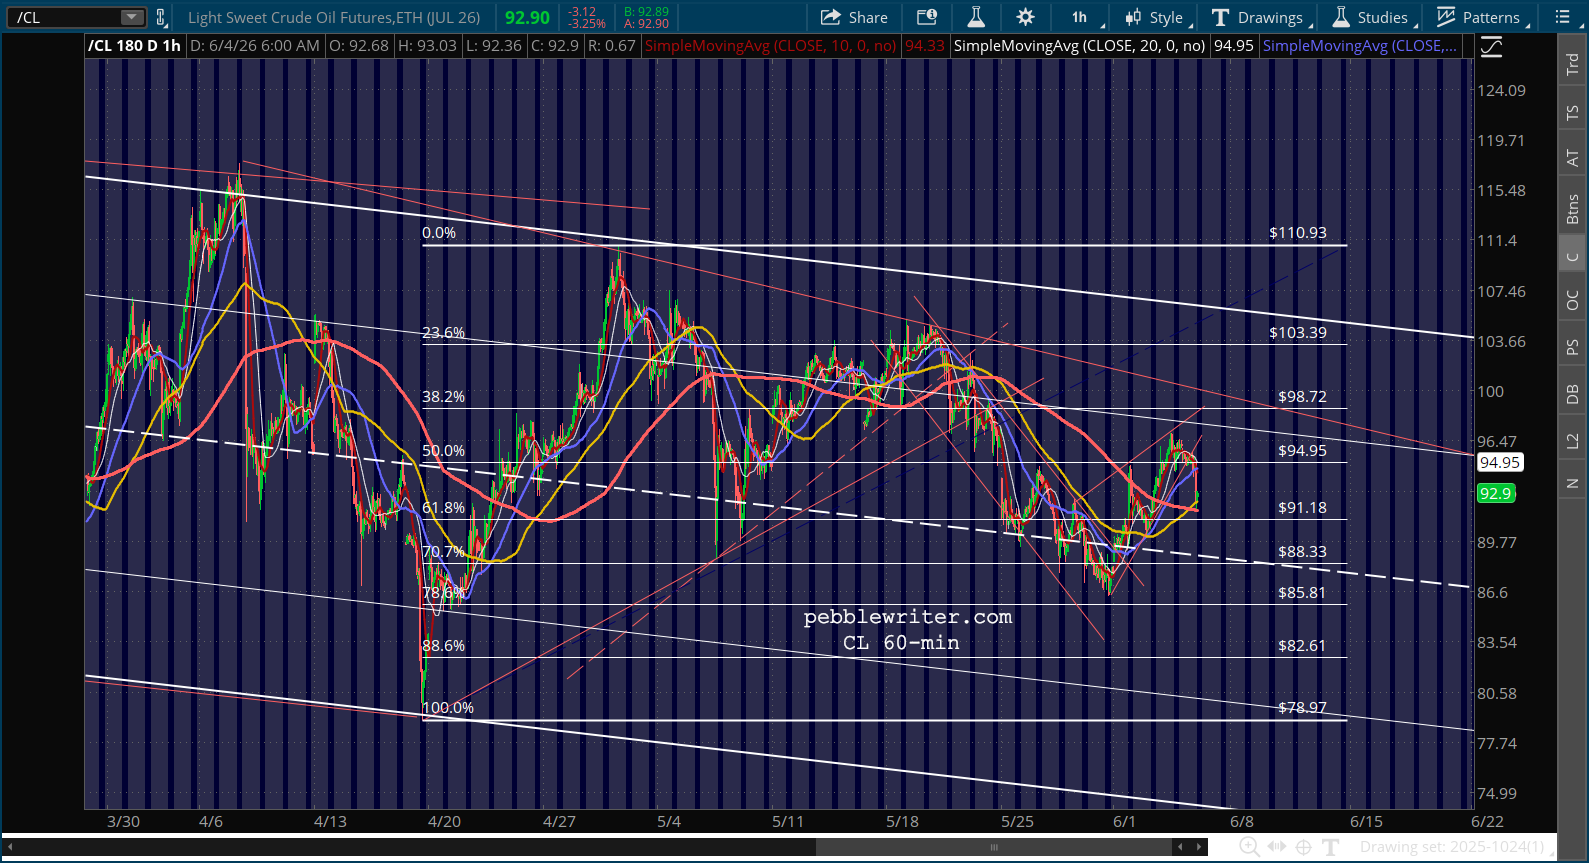
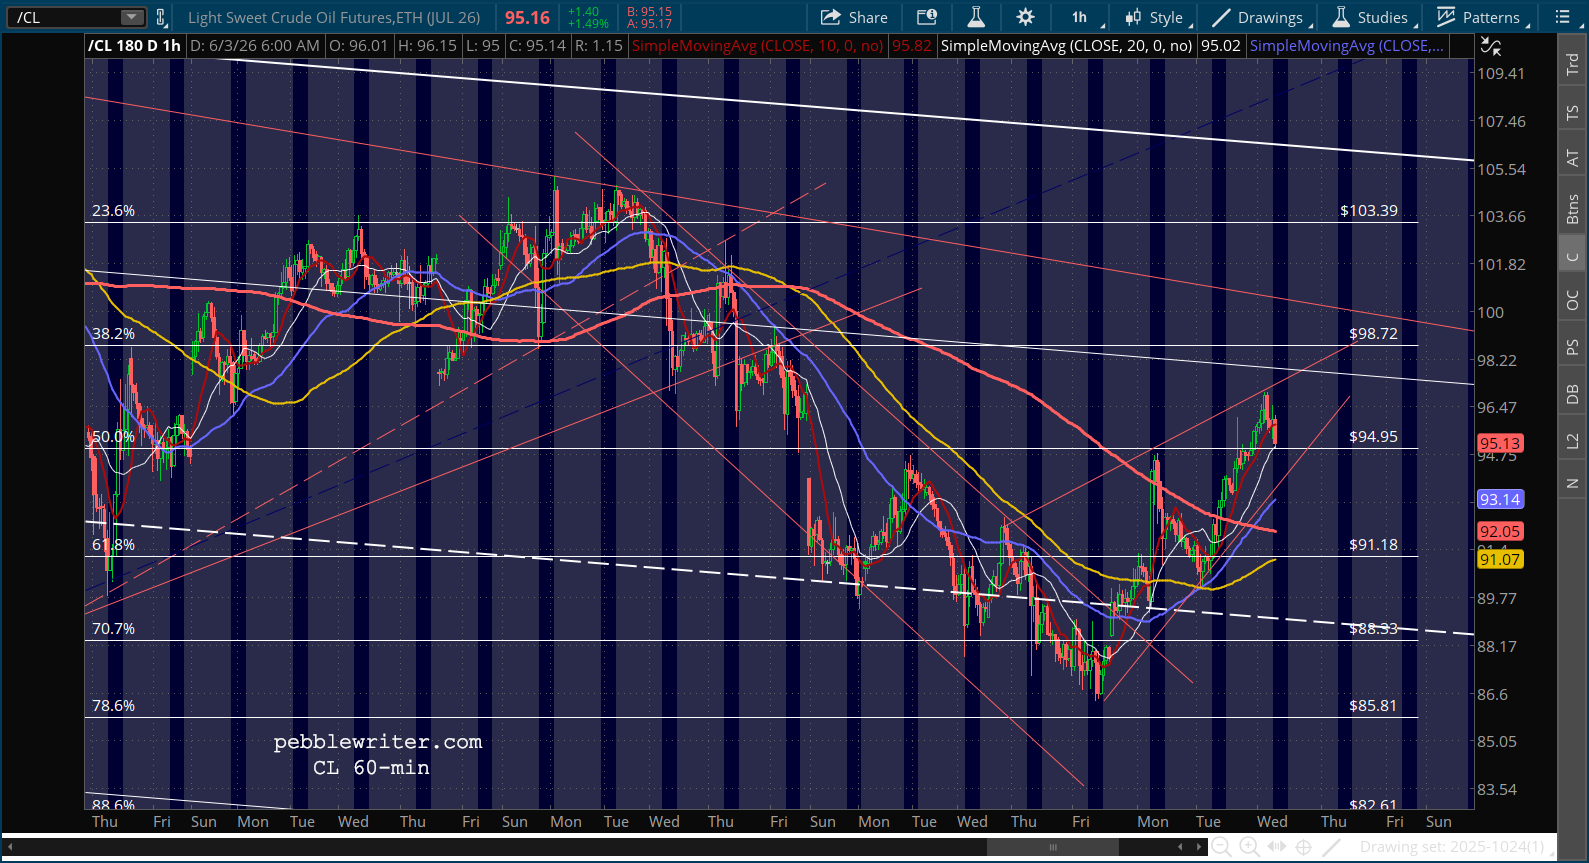
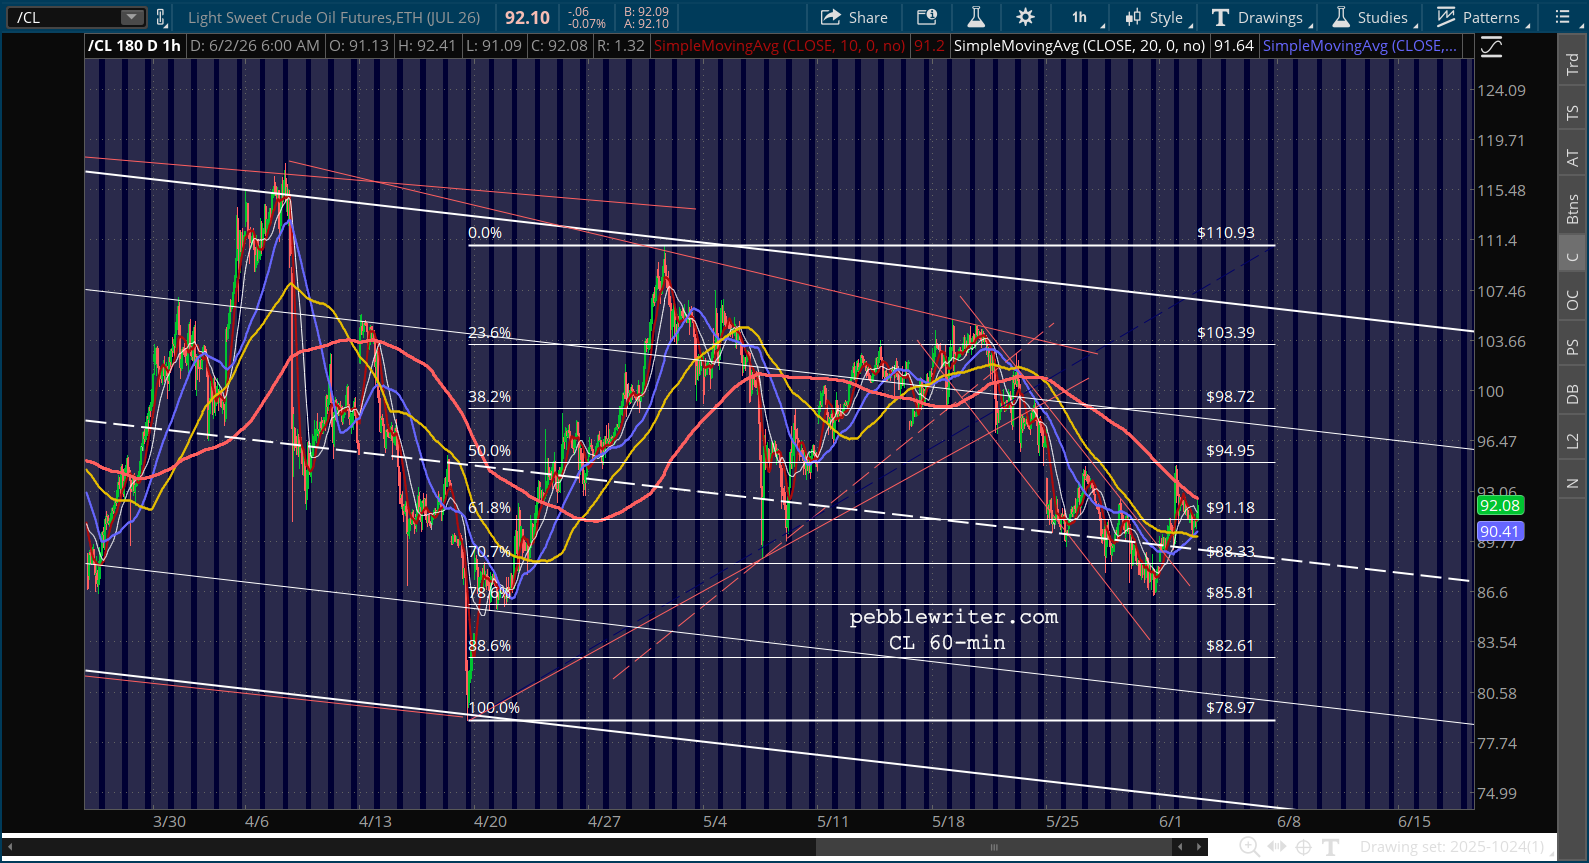
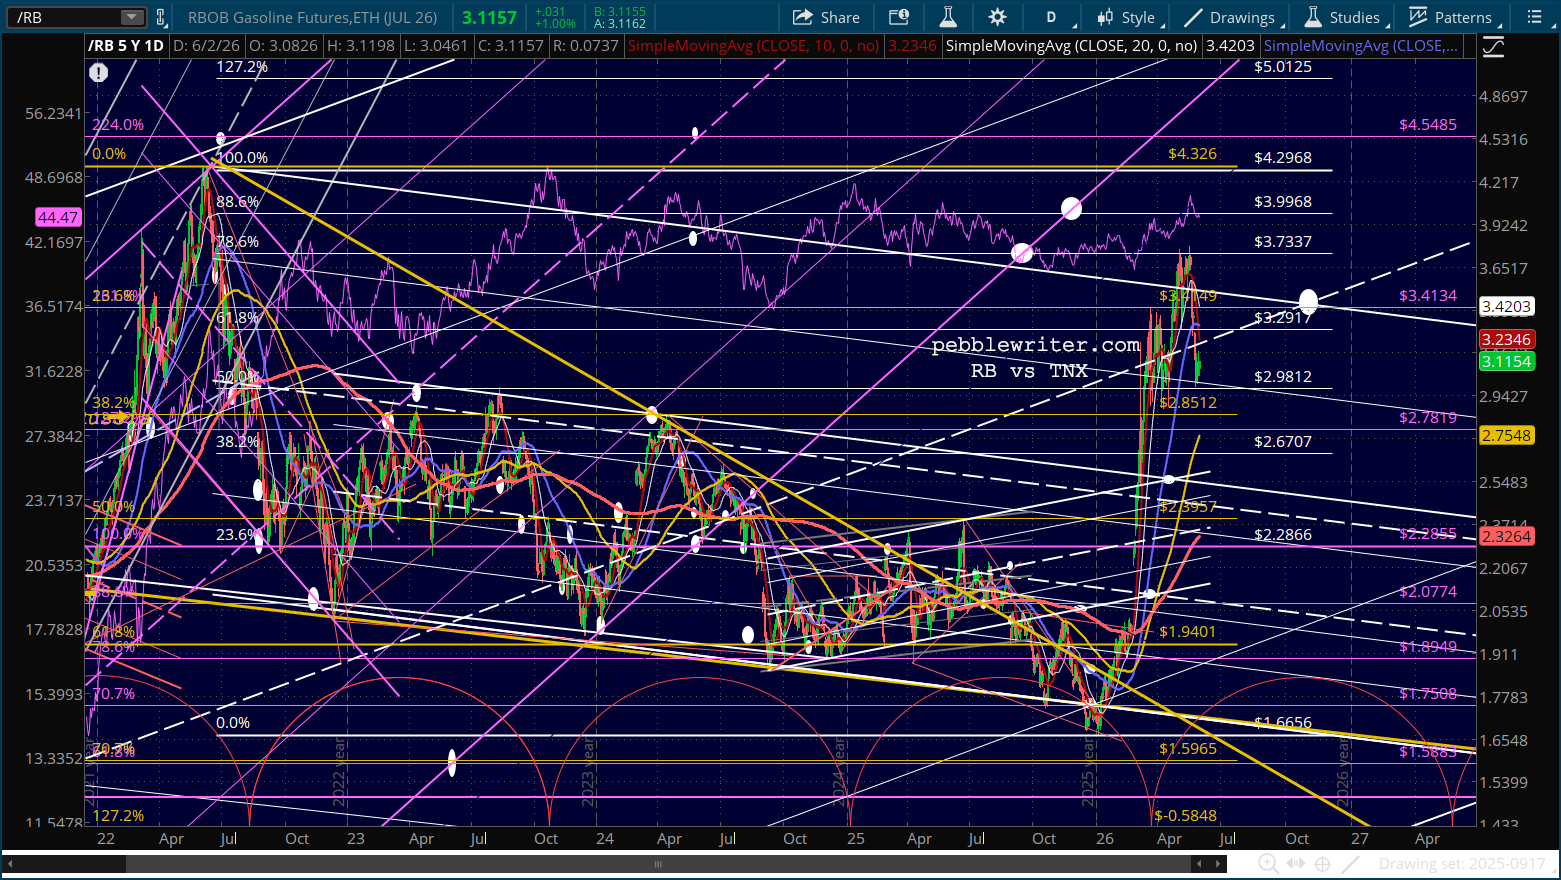
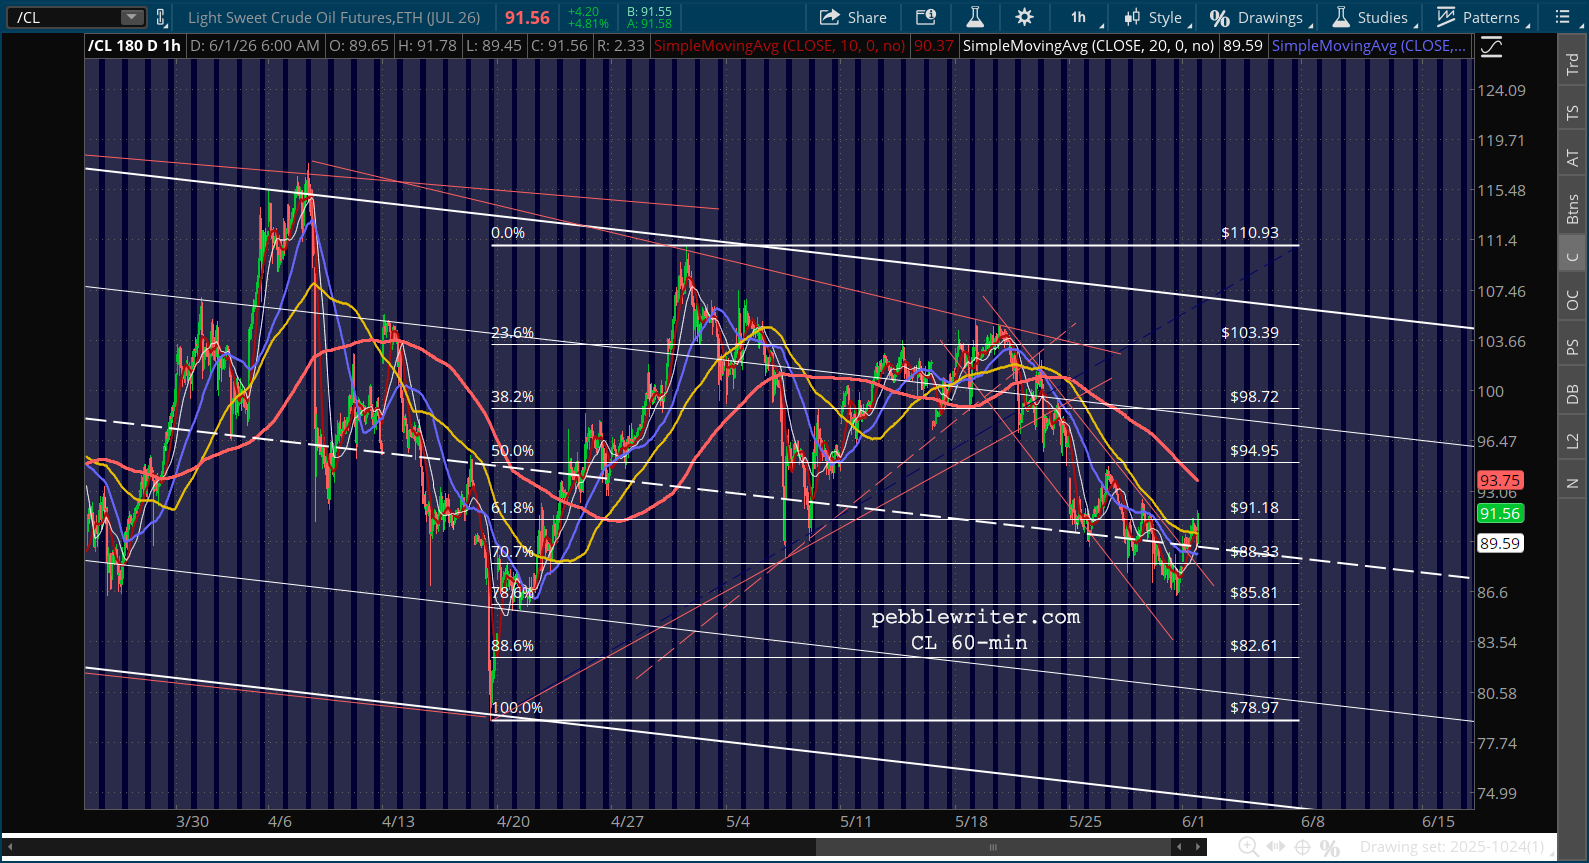
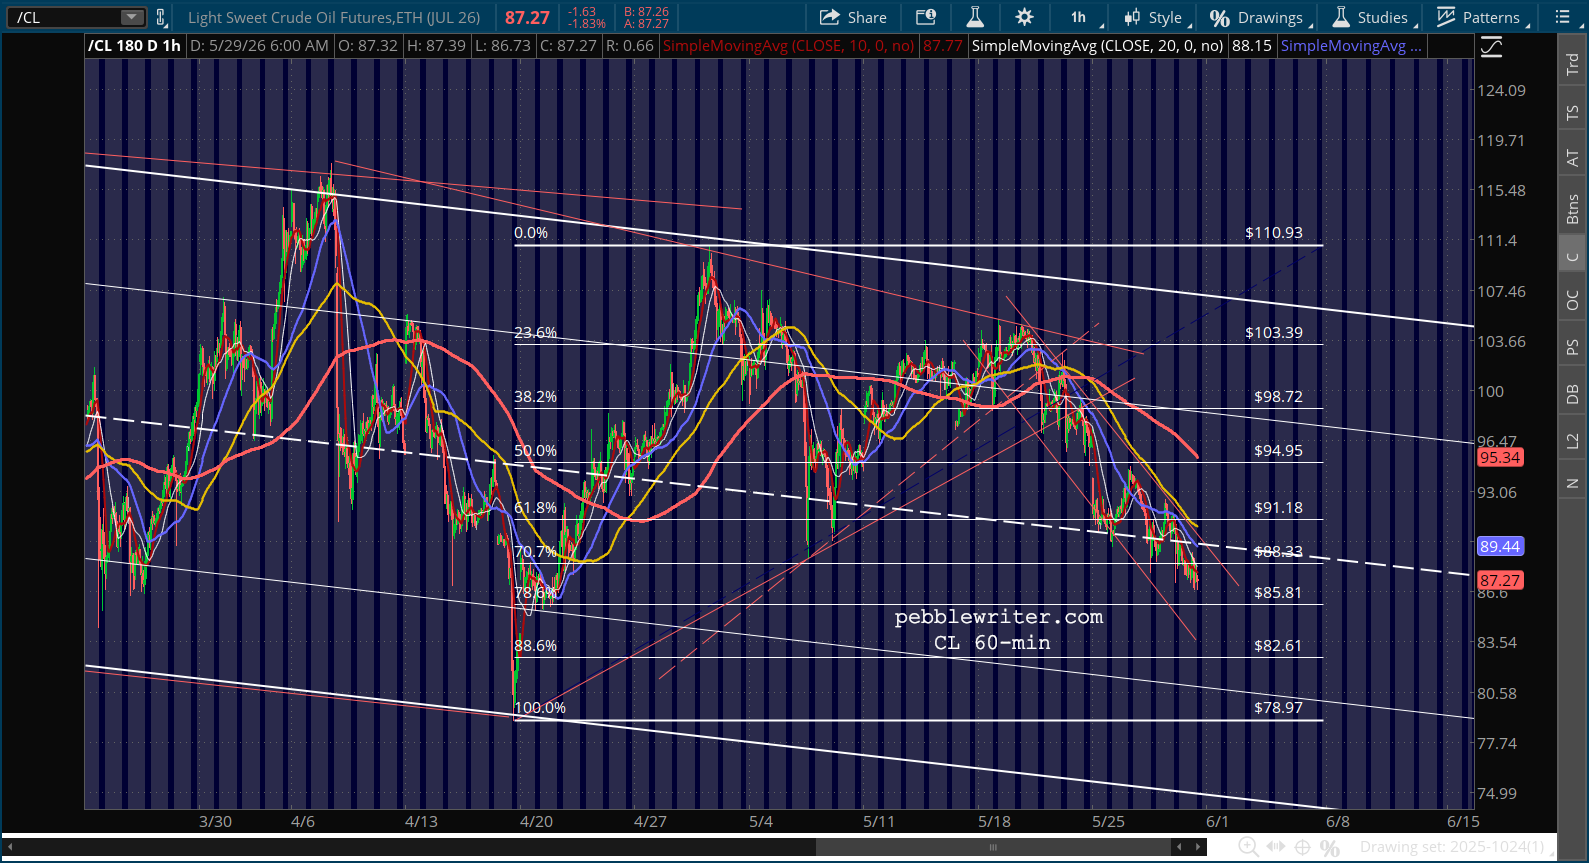
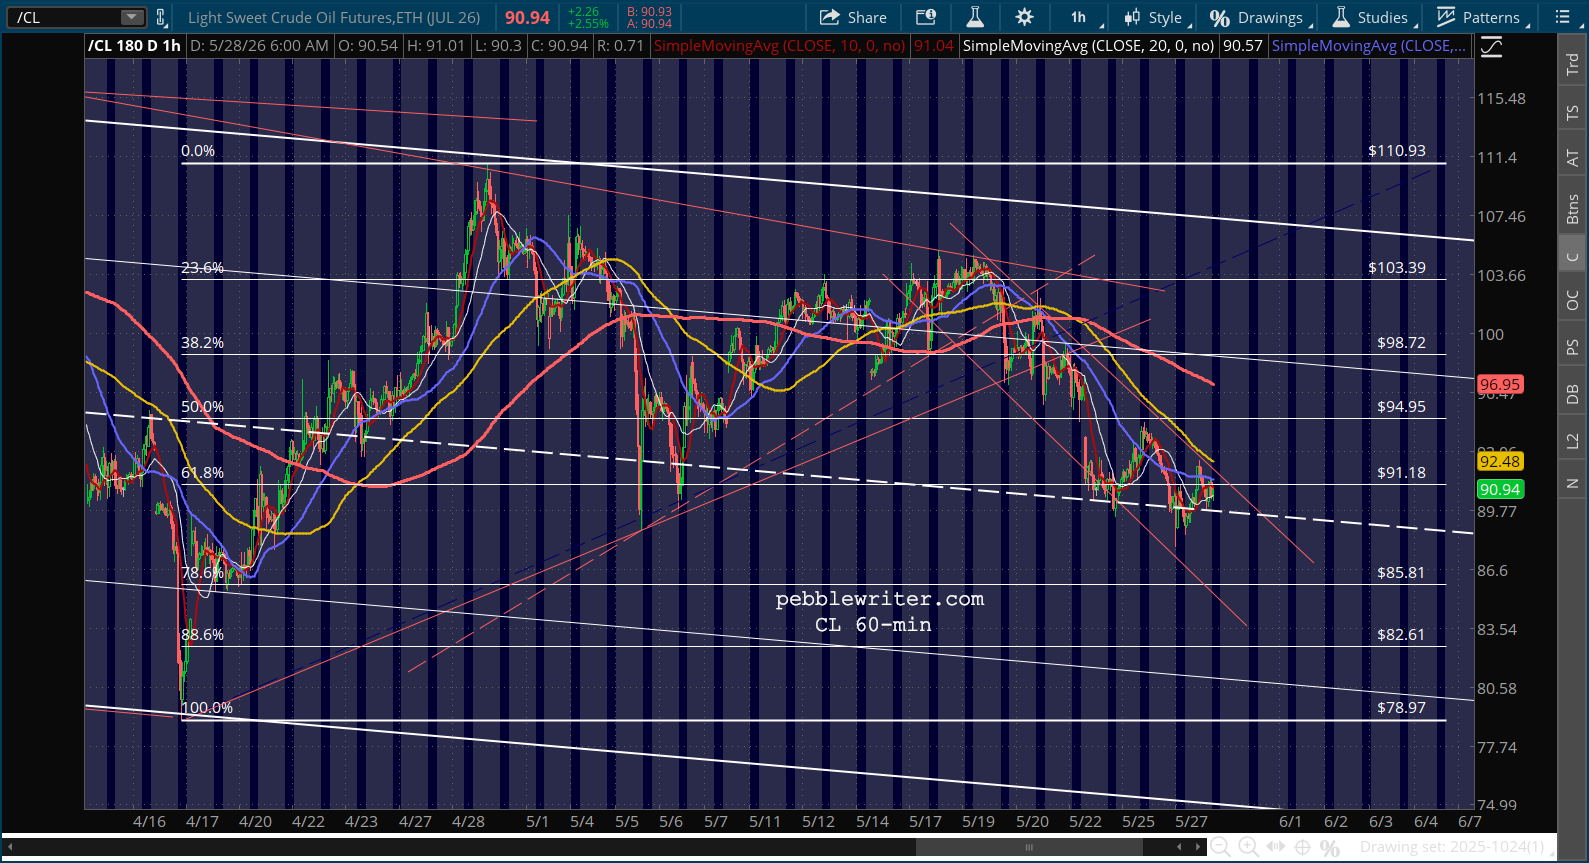
Tell me what “brilliant” move Trump will make next, and I’ll tell you what to expect from oil. But, for now at least, the bond guys are nervous. And, when they get nervous, stock investors start looking for the exits.
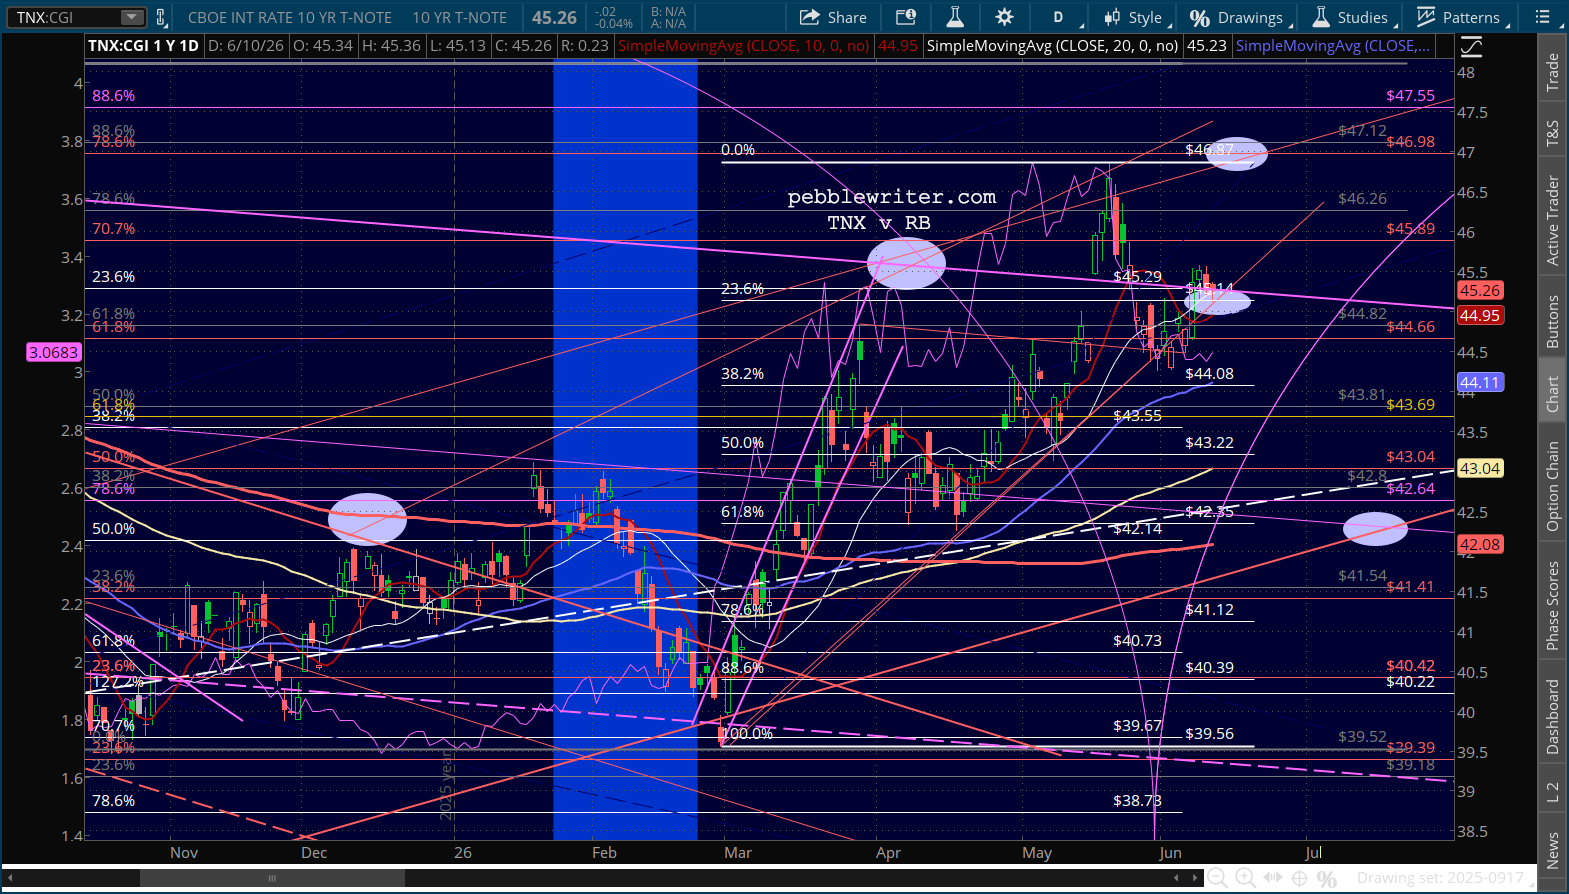
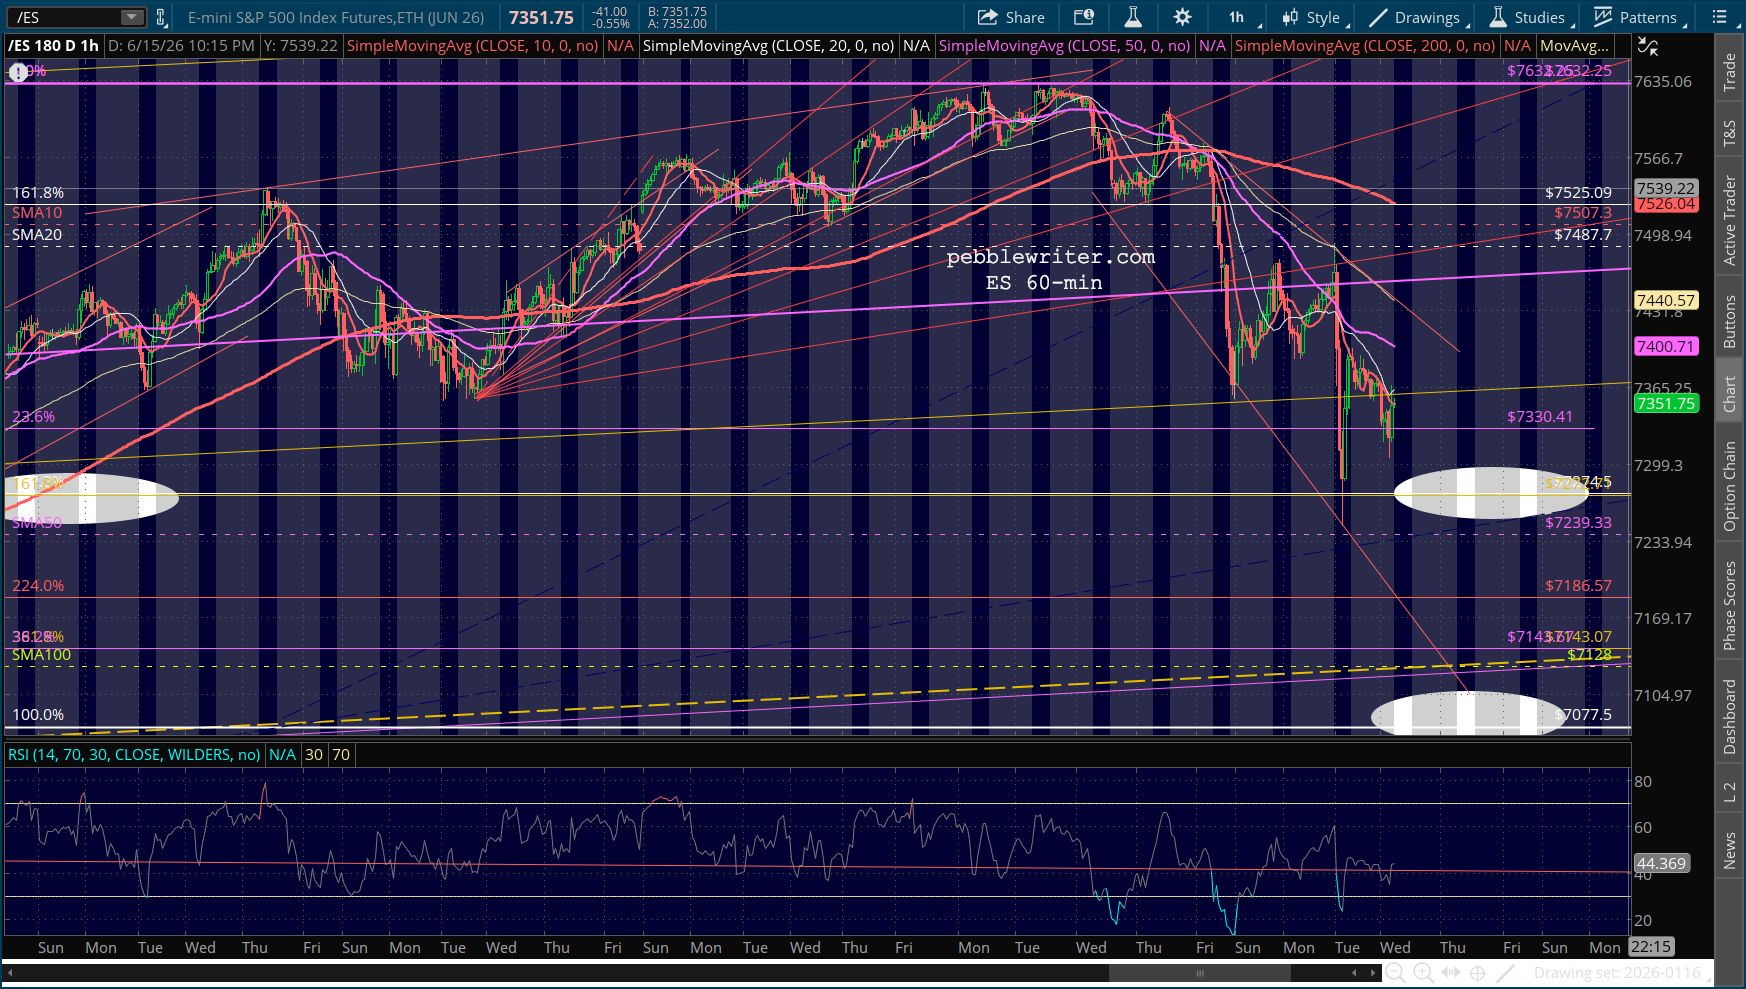
Keep an eye on the 2s10s. ES has formed a H&S pattern that almost exactly targets our next downside target: a backtest of the former high at 7077.50. The chart suggests as soon as tomorrow, but in any case by Jun 15.
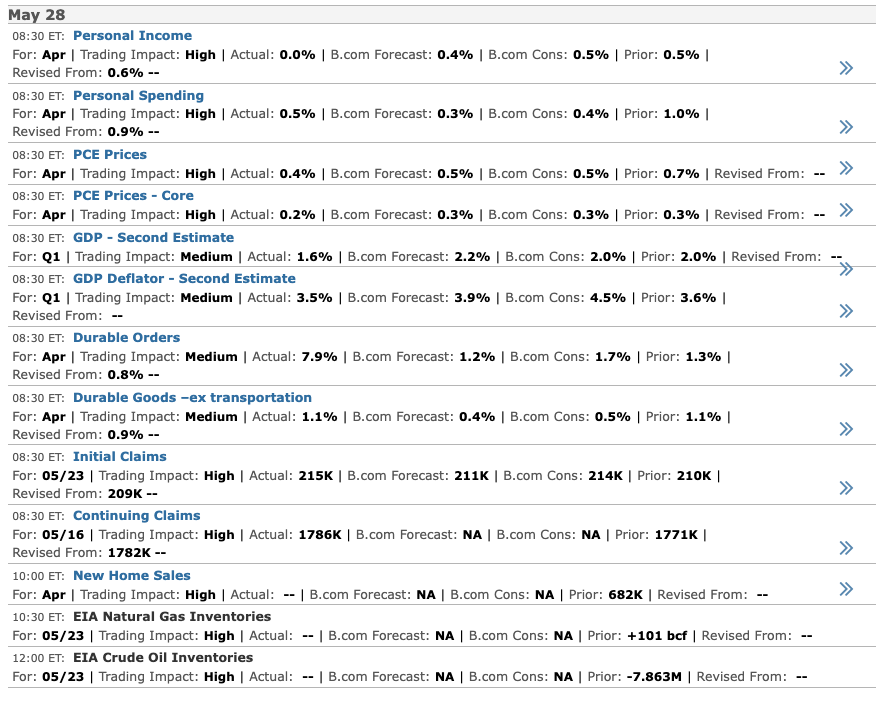
We get PPI tomorrow, UMich sentiment on Friday, housing starts next Tuesday and, of course, the FOMC meeting next Wednesday. This wouldn’t be the first time “the market” threw a fit in order to extort encourage the FOMC into doing the right thing.
Stay tuned…