Posts

  • Good Bad or Bad Bad?

    Retail sales dropped 0.4% versus last month’s +1.0% (revised down from 1.0%.)  In a market where bad economic news provides the Fed cover to extend QE, we have to wonder whether this is “good bad” news or “bad bad” news.

    Surprisingly, the “adjusted” data on which most everyone focuses came in worse than the unadjusted data.   I guess even the bureaucrats wouldn’t mind letting a little air out of this market.

    In an environment of flat to negative real income growth, retail sales obviously can’t continue to grow in real terms unless savings fall.  And, that scenario rarely ends well.   In a perfect world, falling retail sales would mean sentiment has probably backed off as well.  We’ll find out at 9:55am when Michigan data comes out.

    SPX shed about 7 points in the opening minutes and bounced at the former neckline (red, dashed) of the IH&S that didn‘t play out on Mar 25.

    With all the charting I do, I sometimes stumble across an important old pattern I’d forgotten about.  The way this neckline kept popping up in critical situations, I began to suspect it was somehow connected to something more important.

    *  *  *

    BTW, consumer sentiment just came in at 72.3 vs last months 78.6 and expectations of 76.  This is the lowest since last July, when slower job growth and higher food prices were taking their toll on expectations.

    *  *  *

    Getting back to that neckline…

    It’s actually part of a channel system we’ve examined from time to time (in red, below.)

    Seen here in a little more detail…

    So, a drop back through it in a few minutes won’t be a minor event.

    UPDATE:  11:00 AM

    SPX is continuing to sell off nicely.  I’ve added the channels corresponding to the neckline (in red, below) back into to our charts.  It makes things a little busier, but I have a feeling we’ll be seeing more of this system.

    I remain short from 1597 [yesterday’s 11:30 update.]   As usual, we’ll take a shot at divining where this correction might take us.

    The technical elephant in the room is the previous 1576.09 high — now just 5 points below.  I wouldn’t be at all surprised if the market closed right there — forcing the decision as to whether or not to hold short into the weekend.

    Unless 1576 is taken out, any correction will be viewed as a backtest of an important, previously exceeded level of resistance.

    This is the exact same situation SPX faced in October 2007 when it exceeded the previous all-time high by 23 points (versus yesterday’s 21 point beat of the 2007 high.)

    Of course, it had already had the good sense to back off the first time it approached the Mar 24, 2000 1552.87 high.  But, when it finally pushed through, it spent a total of 7 sessions above 1552.87, closing above it only 5 times before reversing for a 170 point decline over the next 7 weeks.

    Are we in for the same kind of shellacking this go ’round?  Before reading any further, I strongly suggest you gather some important supplies:  a comfortable chair, a cold beverage of your choice, and a liberal amount of pixie dust.

    continued for members(more…)

  • The Big Picture: Apr 11, 2013

    The chart of the day:

    We closed our longs (from 1539) yesterday, but are still a few points south of the market’s upside potential.  While yesterday’s 1589.07 might end up being the top, I rather suspect we’ll move just a little higher.

    Recall that we anticipated being in this situation a week ago [Charts I’m Watching: Apr 4 – 1:20 update.]

    I strongly suspect that any move that’s much higher than 1576 will terminate at the purple midline… On April 11, the midline of the purple channel intersects with the TL connecting the 2000 and 2007 highs (red circle below.)  Also on Apr 11, the .25 line of the same channel crosses 1576 (yellow circle.)  So, take your pick.

    So, we can’t very well ignore it now that we’re here, can we?

    I’ll take a shot at a long position this morning — with tight stops of course.  The bottom of the smallest purple channel (from 1539.50) is currently around 1582 and rising about 2.10 per hour.

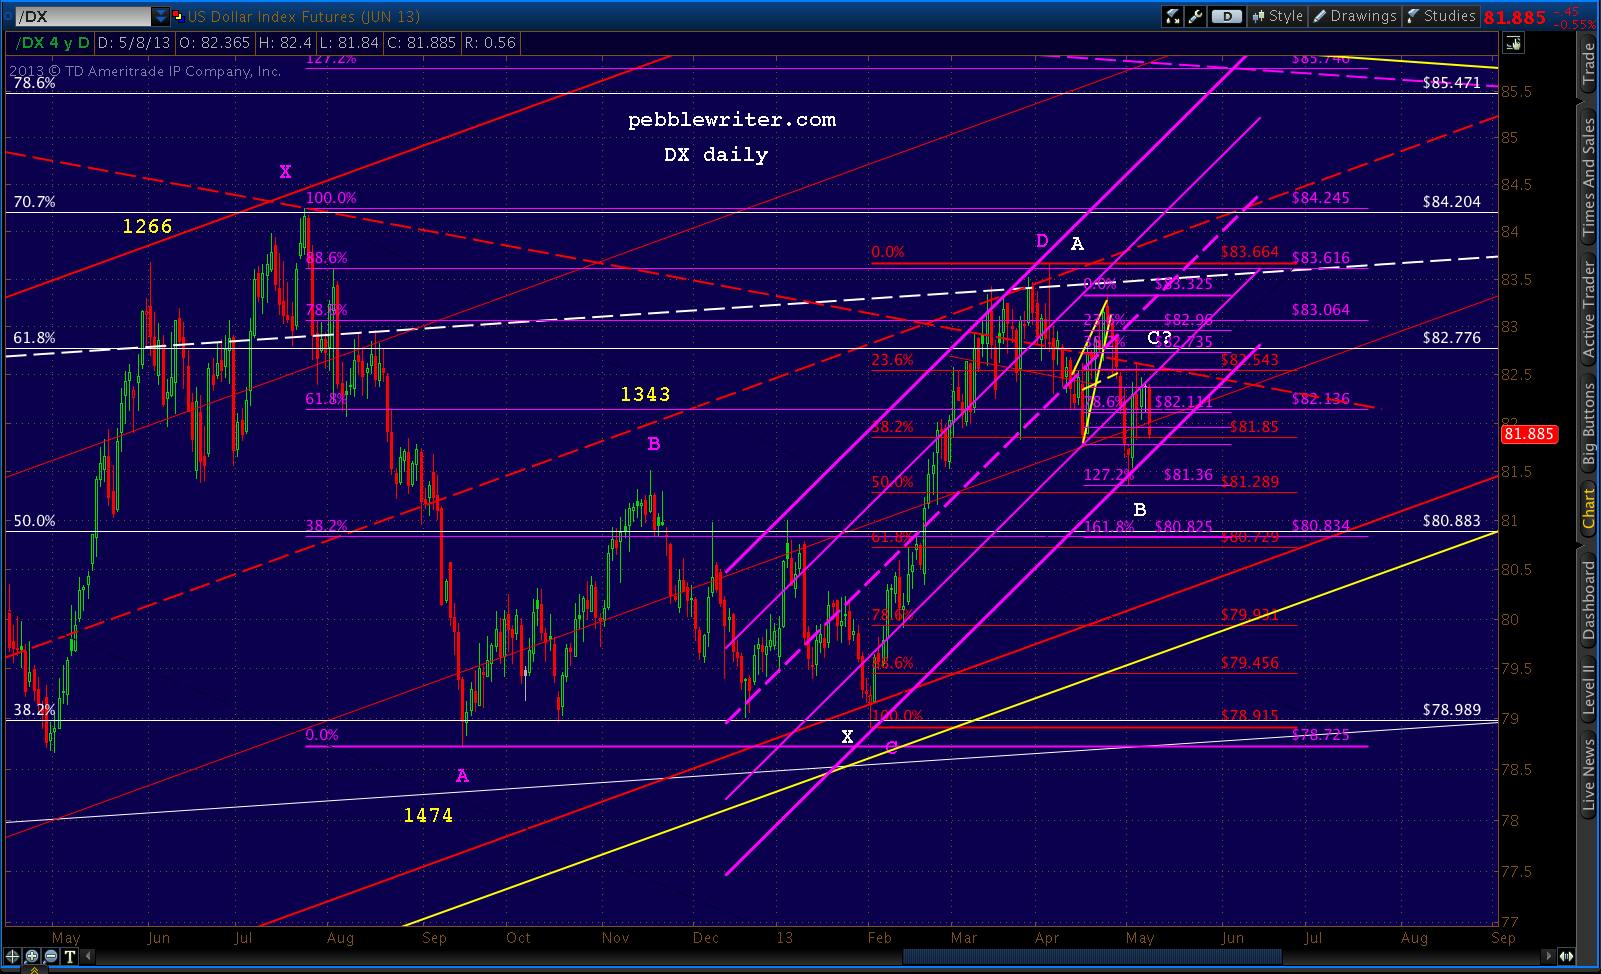
    The dollar reached the next lower line on the falling red channel and will likely backtest the broken white channel as seen on the 60-min chart below.

    But, take a look at a daily chart, and it’s obvious that the push lower would be relegated to tail status and the channel would remain unbroken if DX climbs back to 82.515 or so.  Not a terribly difficult feat if equities top out this morning…

    UPDATE:  10:15 AM

    Just tagged the midline of the purple channel that’s guided SPX since 1343 on November 16.  I never dreamed when we went long that morning [CIW: Nov 16 – 10:05 update] that we’d tack on nearly 250 points in the next five months.

    SPX also reached the IH&S target (1591.66) from the small pattern completed on Tuesday.  It wasn’t a very well-formed pattern, but here we are.

    We’ve discussed it many times in many contexts, but completing a tag on even a 13-year old channel top doesn’t guarantee a bear market.  But, the odds of at least a correction are pretty good.

    If anyone’s wondering about the dashed yellow line that intersects with our smallest channel around 1597.68, it’s the TL shown on the first chart up above.  It connects the 1994 low and the 2002-2003 lows. If we exceed the TL connecting the 2000 and 2007 tops, this is also a great target.

    UPDATE:  11:30 AM

    SPX just topped 1597, which is good enough for me.  I’m switching sides here and opening a short position.  Stops around 1605 should work.

    My only hesitation is that we’re sooo close to 1600.  Do we leave a milestone like that for another day or go ahead and add it to the QE trophy case.  Hmmm…

    If 1600 is in the cards, expect a bounce at the red TL (1593.25) which bulls will, quite legitimately, interpret as a backtest of an important broken TL of resistance.  BTW, a bounce there would also be a backtest of the large purple channel midline.

    If we fall back through both, however, this excursion to 1597 will appear as a shooting star at the top of a nice little Crab Pattern (the 1.618 extension of the drop from 1573 to 1539.)

    Next key level below the red TL is the bottom of the little purple channel from 1539 — currently around 1589.  And, of course, the 2007 1576.09 high is awaiting its own backtest.

    UPDATE:  1:40 PM

    SPX has retraced .886 of its drop from this morning’s 1597.35 high.  If it’s going to try for 1600, now’s the time.  For the bears, a drop through the channel bottom at 1589.40 would really help get the downside going.

    UPDATE:  2:15 PM

    Got the reversal almost to the penny at the .886 retracement, completing a nifty little Bat Pattern.  The bottom of the small channel is coming up at about 1590.

    Since we’re dropped back through the red TL and the purple channel midline, the next backtest will be from below.

    I’ll update our forecast if/when SPX drops through the channel bottom.

    UPDATE:  3:25 PM

    Such a simple thing: breaking through a channel bottom.  SPX doesn’t even have to chase it.  The channel is rising up to meet the index.  But, no breakdown yet.  Instead, two well-engineered bounces that came at just the right time and place to prevent more serious damage to the bullish case.

    And, now we’re entering into the last-minute ramp zone — the last 30 minutes of the session where markets are only allowed to go up.  Good thing it’s an efficient market, randomly walking down a present-value path to future cash flows and not some trillion-dollar casino manipulated by rich and powerful interests with unlimited funding.  That would suck, right?

    If the little H&S is permitted to complete, it targets all the way down to 1585 — the neckline of the last H&S that completed but didn’t pay off thanks to a ramp job in the futures overnight.

    The way this market has been going, it’ll close at the neckline — forcing us to choose whether or not to play ramp job roulette with an overnight position.

    continued for members(more…)

  • Our Little Secret

    Just in case there was anyone left out there who still believed the game wasn’t rigged, the FOMC comes along and confirms that certain people are more eligible than others to receive potentially market-shaking information in advance.

    Not to worry, though, as it was only politicians, their staffers, the lobbyists, their organizations and employers, relatives, friends, neighbors, household staff, the folks at the next table over at Minibar, the valet parking guys…

    In any case, the minutes confirm what we could have surmised based on the governors many speeches, CNBC appearances, etc.  There is dissension in the ranks about tapering or ending QE, but it’s still a minority.  They’re still worried about unemployment, etc. etc.  Nothing new here.

    A few moments ago, a Fed spokesman opined that they weren’t aware of anyone on the early distribution list having traded on the information.  Riiiiight…..

    *   *   *   *   *   *   *   *  

    In the biggest development of the last 24 hours, the channel the US dollar’s been in since Jan 11 officially broke down.  Recall that DX completed a Bat Pattern on Apr 4, signalling a reversal that is playing out nicely.

    This gave SPX the go-ahead to make a new all-time high, which it did this morning — finally exceeding the Oct 2011 1576.09 high.

    We remain long from 1539.86 [CIW: Apr 5, 9:33 update] and are now looking ahead to several potential turning points — the first of which are coming up between 1579-1583.

    The most significant appears to be 1582.95 — a Butterfly Pattern 1.272 extension of the drop from 1573.66 to 1539.50 last week.  It happens to intersect this morning with the former H&S neckline (red, dashed) and a TL connecting the 1994 low with the scheduled  May 2011 high of 1381.50 (yellow, dashed.)

    UPDATE:  10:15 AM

    Just tagged the low end of our target range — the 1.618 extension of the 1563-1538 drop at 1579.10 (in purple, below.)  This also represents a tag of the white channel that’s guided the swings of the past 3 weeks.

    We could get a pause here, as SPX has broken out of its ridiculously steep red channel. Traders might wish to take a crack at what could be a pullback to 1573  (channel midline) or 1570 (channel bottom.)

    But, the interim goal remains 1582.95.  Of course, the question then becomes “now what?”

    A quick check of the daily RSI shows that the game could be over at any point now.  This marks the 5th distinct point of divergence and a tag of the yellow channel top and white midline.

    The yellow channel is the same slope as the falling channel from 1474 to 1343 last Fall and the falling channel from 1422 to 1266 in the Spring.  Can it put an end to this rally?

    continued for members(more…)

  • Charts I’m Watching: Apr 9, 2013

    LOTS of freshly updated charts under the Markets tab: RUT, USDJPY, NG, SPX, COMP, DX, NYSE, FTSE, GOLD.  Check ’em out.

    *   *   *   *   *   *   *   * 

    Apparently jumped the gun a little yesterday by getting out at the .618.  The last 5 minutes saw prices ramp up through our entry point and our 1562.50 stop, but the basic thesis is still intact.  We should see a small reversal either here or around 1570.

    I went long last Friday at 1539.86 [CIW: Apr 5 9:33] after riding a short position down from 1573, but got cold feet at holding a long position into the close — especially after bagging a 20-pt gain.

    The market has gapped open more often than not over the past few weeks — typically on a change of direction.  This time I outsmarted myself and left several profits on the table.

    I’ll play along on the long side and look for a loss of momentum at the .786 (1566.35) or the .886 (1569.77.)

    UPDATE:  9:35 AM

    Just reached the .786 of 1566.35.  Will revert to full short here with stops at 1570ish.

    UPDATE:  11:35 AM

    We got a nice sell-off from the .786 retracement (1566.51) but have yet to flesh out the rising channel I’ve charted.  Since it features such a steep slope, the bottom is rising rapidly — now up to 1560 or so.

    The 6-pt drop to 1561.38 might suffice for a right shoulder on the IH&S Pattern, but it’s rather skimpy compared to the 12-pt left shoulder.  And, it’s not even one Fib level lower than the .786 turning point.

    A more balanced right shoulder would take SPX down to 1555 or so.  That would mean a broadening of the channel, of course.  But, that’s to be expected with such a steep, narrow channel.

    Keep an eye on the previous high.  A break of 1566.51 means this isn’t the right shoulder at all; it opens up the .886 at 1569.77.  But, a reversal shy of there (and especially 1566) means we’re more likely to tag 1560 or even 1555 before moving higher.

    More later.

    UPDATE:  12:30 PM

    There’s the breakout, settling the question of whether we’re getting a deeper pullback or not.  Switching sides here for the run up to 1570ish.

    Assuming we reach 1570, then what?

    continued for members(more…)

  • Gold: Breaking Out?

    Gold has been smacked down pretty severely, falling 14.4% in the past six months.  But, the charts suggest it will soon be time to start melting down that jewelry again.

    GC has reached the lower bound of a well-formed channel that dates back to 2000.  While not every channel bottom tag results in a reversal, odds are this one will.

    In Sep 2011, GC topped out at 1923.  Since then, it has traced out several descending triangles in a row — breaking out of each one in turn.  Each breakout has been followed by a very deep retracement or back-test and subsequent breakout.

    The latest back-test is most likely completed, clearing the way for a test of the highest yellow dashed TL presently up around 1740.

    But, it’s worth noting that the previous breakouts have all ended up around the same price level: 1800ish.

    Were the next breakout to advance at the same slope as previous ones, and were it to backtest the LT channel’s .25 line as occurred in Oct 2012, we could see a 14.4% rally by mid-June.

    It’s difficult to draw such a long-term channel with absolute precision, so there’s a small possibility that the true channel bottom is closer to 1525.  But, the daily RSI suggests the next move will be higher.

    If I’m wrong, and this latest bounce fails, we’ll know pretty quickly with a bearish drop through horizontal support at 1525ish. So, watch your stops.

    GLTA.

  • USDJPY Update: Apr 8, 2013

    The largest channels are all pretty loose fits, with plenty of incursions that make forecasting with them iffy at best.

    But, the smaller channels and Harmonic Patterns have been pretty effective.  Even though USDJPY has been running like a 燃える尾を持つ猫, there is growing risk of a downturn as it approaches 100.

    Consider the new channel constructed by today’s high.  It lines up with the Oct 31, 2011 and Mar 14, 2012 highs.  It would carry more weight if there were more than one tag on the bottom, but we shouldn’t ignore the potential for a correction.

    Given the tear the pair has been on lately, it would probably be motivated more by a weak US dollar than a strong yen.

    The pair put in a decent correction at the red .786 (of the decline from 101.44 in Apr 09), hinting at a future Butterfly Pattern.  The 1.272 is at 108.47 and the 1.618 is at 117.43 — right next to the large purple .886 at 118.59.

    There’s also a small Crab Pattern (white, above) completion at 99.26.  So, though I wouldn’t necessarily put money on it (the trend is your friend), it appears the pair might have hit at least interim resistance at today’s high.

    A failure to reverse here will likely mean a trip to the purple .618 (at least) at 105.57.

    But, that would mean barging back into the daily RSI channel (in green below) that broke down in mid-Feb and is undergoing its 2nd back test.  It’s certainly not impossible, but it would be easier after a pullback to reset RSI to lower levels.

    Stay tuned.

  • Natural Gas: Apr 8, 2013

    I’ve been watching natural gas for the past few weeks, an interesting chart as suggested by a member.  One quick caveat: I don’t follow the industry, nor do I have an opinion on the fundamentals.  This is simply a read of the current charts as I see them.

    NG has been exceptionally volatile over the years.  As seen in the chart below, there are a few key channels that have guided prices over the longer term.  Since the 2005 peak, the most influential candidates appear to be the well-formed falling red and yellow channels.

    Regardless of which channel ultimately holds, NG has clearly broken above the red midline, the yellow .75 line,  and a trend line (yellow, dashed) connecting several important lows.  For this reason, NG appears to have continued strong upside potential in the near term — perhaps another 10% or so to the 4.50 – 4.69 range.

    Note the tight cluster of Fib levels there: the purple .886, the white .618 and the yellow .236.  They intersect with the yellow channel top later this year (beginning around September.) So, either the torrid pace of the past two months will ease, or — more likely — NG will trace out a more complex path between now and then.

    NG has completed a 1.272 extension of the drop from 3.93 to 3.05 (Nov 12 – Jan 2) right at the rising purple channel midline.  The prior reversal (Point B) came near the .618, so NG will likely form a Crab Pattern at the 1.618 extension (4.48.)

    If I’ve charted the purple channel correctly, look for it around May 24 following a pause that could range anywhere from the bottom of the purple channel (3.50) to a more likely back test of the red midline (around 3.83) or prior high (3.93.)

    Traders would do well to watch the small, rising white channel for an indication of which.  If it breaks down, the purple channel bottom or .25 should provide key support.  But, that could mean a substantial drop from current prices.


  • Charts I’m Watching: Apr 8, 2013

    As expected, the EURUSD has turned the corner, easily topping our 1.30 target from Apr 4.

    The daily RSI shows a break out through the resistance of two long-term channel midlines (yellow and white) with a third, shorter term midline to come.  So, while we could see some near-term consolidation, the pair appears to have room to run.

    The dollar has likewise met still resistance at the .886 Fib (83.616) we discussed a few weeks ago and turned down.  Recall that this resistance also came at the intersection of two price channel midlines (red and white.)

    While, daily RSI shows a conflict between a long-term midline (yellow) and the inclination to tag the lower bound of the rising purple channel.

    We shorted at 1573 on Apr 2  [CIW: Apr 2 10:37 update]  looking for a pullback to the .786 (1546) or .886 (1542) of the rally from 1538 to 1573.

    The market slightly overshot those levels on Friday, but remained north of the Mar 19 low of 1538.57 — thus completing a Bat Pattern.  So, we went long at 1539.86 [CIW: Apr 5 9:33] with tight stops.

    I remain long, but will take an interim short position on the drop through the channel midline at 1551. Stops right there.

    A drop through 1548.50 would be cause to consider switching sides.  But, I suspect the weakness we’re seeing this morning is continuation of the shakeout attempt from late last week — so I look at this intra-day short as a protective position that’s unlikely to register more than a few points to the bottom of the little white channel.

    UPDATE:  10:05 AM

    Stopped-out on the protective short position for no gain — will let the long position run.  Note that we’re safely back in the large purple channel dating back to 1343 in November.  The bottom of the little white channel is now around 1549.25, so set stops accordingly.

    I should mention that we’re basically playing around in the tails of the daily candles.  That is, on the daily chart all of this action will be disregarded as was Friday’s dip and subsequent recovery.  So, anyone not inclined to day trade should really ignore all this stuff and stay focused on the forecast.

    UPDATE:  10:20 AM

    The little white channel actually looks better with this drop down to 1548.63.  Looks like a good place for SPX to make a stand.  Perhaps a run up to 1558-1560 now?

    Keep an eye on this channel, as any departure is cause to hedge or play the downside — at least on a short-term basis.

    continued for members… (more…)

  • Charts I’m Watching: Apr 5, 2013

    Looks like we’re going to hit our downside target after all, thanks to a dismal payroll number.  I’ve had 1546.08 as my top choice [CIW Apr 3, 2:25 update for members.]

    I’m inclined to stay short for the purple channel bottom at 1546.08 or the 1.618 at 1549.09, with stops at 1558.47ish.  But, anyone who doesn’t mind the extra trading might consider going long here — with the understanding we might run into trouble at the channel top (small falling white) at 1558 or so.

    But, if the downside momentum builds, 1542.57 is definitely in reach.

    To the extent it’s available on the opening, I’d play the downside to those levels and be ready to bail.

    A drop through 1538 opens up much lower prices and essentially busts the channel that dates all the way back to November’s 1343.

    UPDATE:  9:33 AM

    I think it’s worth taking a shot on any loss of momentum just shy of 1538.57 (lower really damages the bullish case.)

    So I’ll take a stab here at 1539.86.  Going long again with stops at 1538.

    Note that at these prices, SPX has completed a Head & Shoulders pattern, albeit with a very steep slope.  But, it’s not verified unless we close below 1545 or so.   Even then, we’ve had two such (normally very reliable) bust in the past several weeks.

    If drops like this morning’s make you nervous, the market makers have done their jobs.  Remember, this morning’s plunge is by design. The open interest on the SPY 155 weekly calls that expire today, for instance, is 97,000 contracts.

    Each contract gives you the right to buy 100 shares of SPY at 155 through today.   It’s the equivalent of SPX 1550. They’re currently trading at 12 cents (probably a good deal.)  But, three days ago — when SPX nudged into the 1570’s — market makers would have been happy to sell you all you wanted at 2.33.

    A $23,300 “investment” in 100 contracts at the high would be worth $1,200 — a 95% loss in 3 days.  This is an example of the typical game played by market makers who just love optimists.

    They love pessimists, too, and just sold a boat load of puts this morning to those expecting this morning’s plunge to keep going to 1500.

    It’s taken me a couple of years to come to the conclusion:  if you can get the kind of results we do without leverage and without options, why take the risk?  It’s hard enough to be right on the direction and magnitude of a move, without having to be right on timing too.

    Even if we had held long instead of shorting at 1573 on Tuesday, we’d be down a whopping 1.7%.  Beats the heck out of -95%.  By shorting, we actually made money.

    *  *  *

    I met an old friend for coffee yesterday, and we talked about pebblewriter.com and my investment strategy.  He asked if the results we got this past year weren’t simply attributable to a great market.  The question took me by surprise.

    The S&P 500 was up 8.75% between Mar 22, 2012 (our inception) and Feb 28, 2013 (without dividends.)  That includes a 12.8% gain from Nov 16 – Feb 28.  I guess the MSM has done a bang-up job of selling this as a “great market.”

    But, the question did get me to thinking.  As of Feb 28, just shy of a year since inception, we were up about 113% in a theoretical portfolio where we bought SPX at called bottoms and shorted at called tops.

    Forty-eight percent of our gains came from long positions and 52% from short positions. In other words, we benefited slightly more from declines than from rallies.  Unlike almost all long-short funds, we did it by being either long or short, depending on my outlook.

    The major moves during that period were:

    • Apr 2 – June 4, 2012 (1422 to 1266, an 11% decline)
    • June 4 – Sep 14, 2012 (1266 to 1474, a 16.4% rally)
    • Sep 14 – Nov 16, 2012 (1474 to 1343, an 8.9% decline)
    • Nov 16, 2012 – Feb 28, 2013 (1343 to 1515, a 12.8% rally)

    So, anyone who captured all of those major moves earned about 49% — much better than the buy-and-hold approach of 8.75%. They would have had short-term rather than long-term capital gains; but, anyone with a marginal tax rate below 85% wouldn’t have minded.

    My objective is simply to capture most of the moves most of the time.  If 49% represents the most we might have earned by capturing all the major moves all of the time, we apparently earned about 64% by playing interim moves — going long and short.

    Shorting the market scares some people.  When I was a shiny new broker back in the Middle Ages, all they had to say was “when shorting, you have unlimited losses.”  It sure scared me — which was the point.

    But, by using stops this past year, we limited our single biggest losing trade to 1.5%.  There’s always the possibility of a 10% gap down, but by using e-minis rather than cash markets and going to cash in precarious situations, that risk can be greatly reduced.

    What I find really risky is buy-and-hold investing, where investors hold long through 10-20% declines.  If your name’s Buffett, no big.  But, if you need money for a wedding/college education/vacation house in a few months, and that 10% decline turns into 58% (2007-2009), 51% (2000-2003) or even 22% (May-Nov 2011)?

    Everyone’s talking about whether the S&P 500 will make a new all-time high, topping 2007’s 1576.09.  But, after inflation, it’s still down about 25% from its 2000 peak.  The real Nasdaq is down over 50%.  For someone planning to retire, that’s risk.

    One final thought…the beauty of our strategy is it provides concrete decision points.  If you buy AAPL at 500 based on the hype around the new iWatch and the stock falls the following day to 490, should you hold?  What if it falls to 460?

    What if the iWatch is released and the stock only recovers to 485?  Do you sell?  Double down?  Wait for the sales numbers? Wait for the next quarterly report?  At what point do you pull the plug?

    Between Harmonics and chart patterns, we’re rarely left without a sense of whether our investment thesis is correct or not. Even a simple channel will usually tell you if you’re on the right track.

    In early December 2012, we had been following an analog that had earned us over 10% per month — forecasting all the major moves since the previous March. The analog called for a reversal and move lower from either at 1424 or 1446.

    I tried shorting both times, giving up a few points before it became apparent the market wasn’t going to tumble.  The same thing happened a few weeks later, when the Fiscal Cliff “solution” sent the market gapping higher after New Years Day.

    There were multiple potential targets to the upside, so I have tested the short waters many times on the way up from 1474 to 1573.  It’s always fun (and more profitable) to be right for a big score, but by managing my exposure and paying attention to the trends, I’ve still pulled in decent returns without taking undue risks (March update coming this afternoon.)

    I will continue refining the strategy and trading techniques in anticipation of our new fund that I anticipate coming out next month.  I have developed a distribution list for those who have expressed interest.  If you’d like to be on it but haven’t yet contacted me, please CLICK HERE.

    *  *  *

    UPDATE:  3:50 PM

    The market has rebounded nicely since this morning’s 1539.50 low.  Anyone too wigged out about Cyprus, the NFP number, Korea, etc. should take the money and run.  Forget about the market and enjoy your weekend.

    But, 60-min RSI just broke out of the most severe of the bearish channels and SPX should have no trouble reaching 1560 either today or Monday.  What it does then matters a lot, but I suspect our forecast is still intact.

    I’ll hold long unless we reach 1560 today, at which point I’d probably go to cash.  Stay tuned.

    UPDATE:  4:05 PM

    Nice safe close, back in the loving arms of both the purple channel and the white channel.  I’ll update the forecast later this afternoon, but I believe we’re in good shape re the forecast.

    Oh… and congratulations to anyone who bought SPY 155 calls at 12 cents earlier (they traded up to .38 shortly before the close.)  Take the money and do something nice for somebody deserving.  Karma and all that…

    More later.


  • Charts I’m Watching: Apr 4, 2013

    Keep an eye on the channel we’ve been charting since Tuesday.  If SPX breaks out, it’s time to take an interim long position.

    Upside potential if this is only a countermove is the white channel midline around 1561.45.

    UPDATE:  10:00 AM

    Things are happening faster than I can type this morning.  We just reached the white channel midline and are still going strong.  I’ll set stops here and see if we can reach the purple .25 line at 1563.40.  Charts in a few…

    UPDATE:  10:12 AM

    Almost reached the .25 line and immediately backed off, triggering stops on my long position at 1561.45.  Reverting to full short.

    The falling purple channel I’ve inserted is more a place holder than anything else.  It’ll give us something by which to judge the upcoming moves.

    UPDATE:  10:45 AM

    Here’s the chart I’ve been focused on this morning.  Even with all the whipsawing, the 60-min RSI shows a likely move lower to tag the bottom of the big white channel.  The reversal at 1562.60 came in slightly higher than the midline.

    But, as the chart shows, many of the reversals have missed a precise midline tag — making reading RSI channels equal parts science and hermeticism.  Remember, each data point happens on the hour, so the current blip lower than the midline could reverse itself and turn higher in the next 20 minutes.

    UPDATE:  11:15 AM

    Seeing some support at the (new) proposed channel midline.  Stops at 1561.50ish.

    UPDATE:  1:20 PM

    I’ve had several questions about whether the push lower than our original 1560 target busts our leading forecast.  Many hours of charting later… I don’t think so.  Once SPX broke through 1560, we targeted 1549 — which we came every close to tagging yesterday (1549.80.)

    I had no objection to taking the 23-pt profit, but I think there’s more where that came from.

    continued for members(more…)