Posts

  • Charts I’m Watching: Apr 3, 2013

    ADP unemployment miss, FOMC gov’s publicly debating QEn, a growth warning for China even as PMI levitates and the Volcker Rule might not become law till 2014.

    Yesterday’s last minute ramp in stocks has fizzled as expected, and we remain short from 1573 [10:37 update] a price that proved to be 0.66 from the high.  We have a 30-day forecast in place, now [see: yesterday’s 11:50 update]; and this morning’s sell-off is falling in line so far.

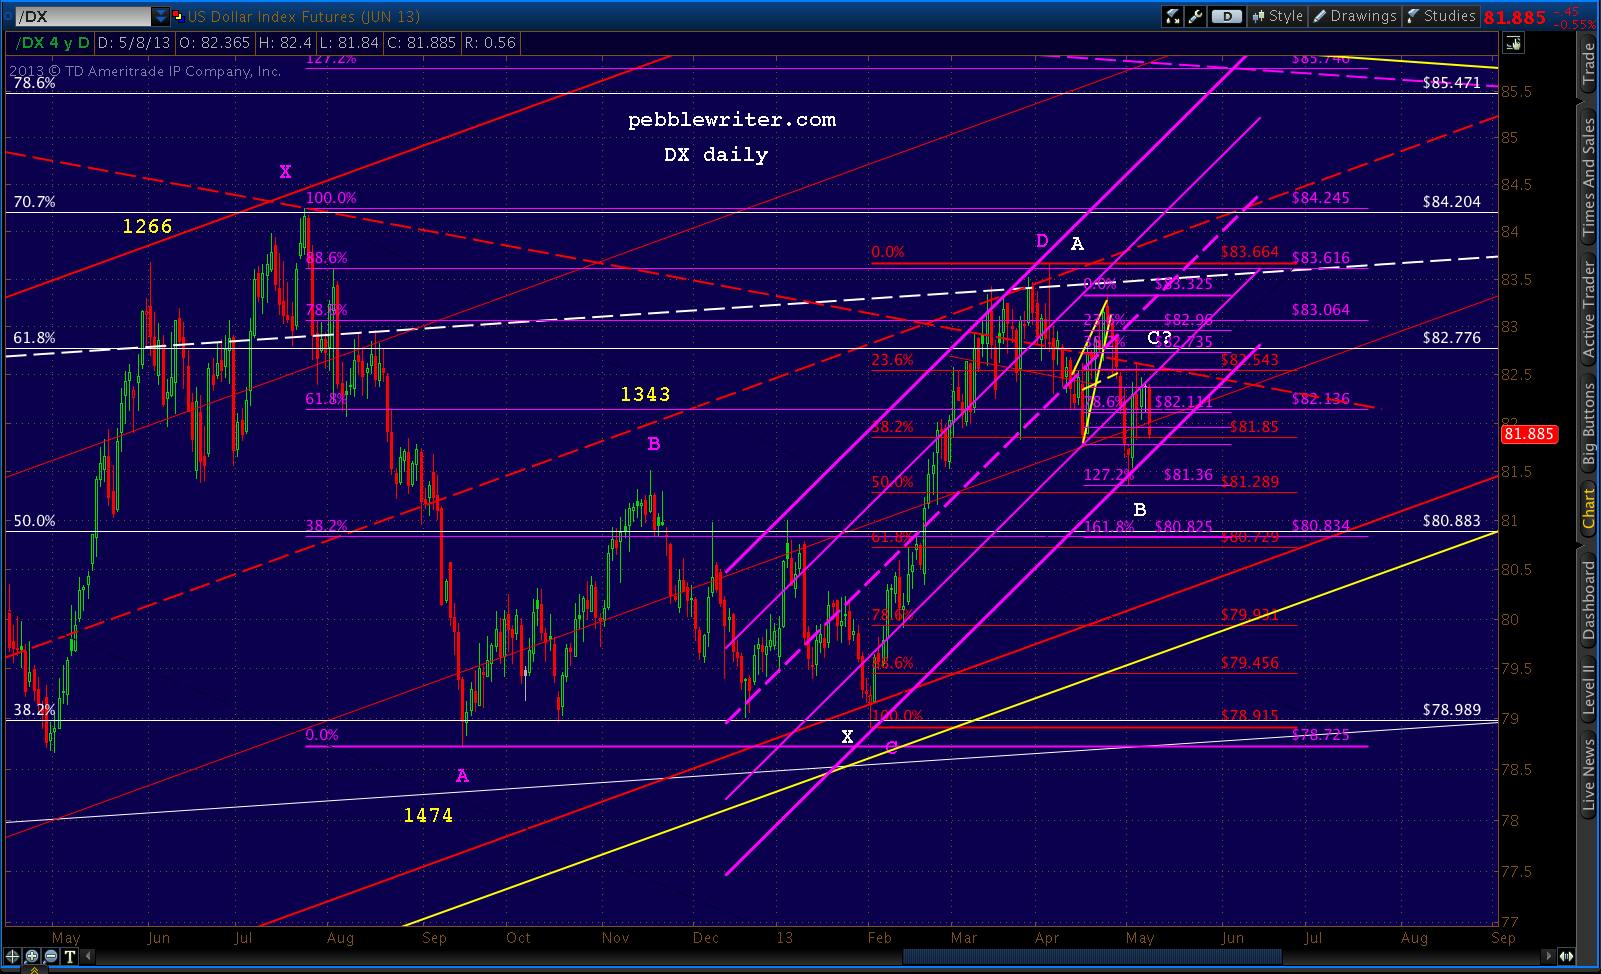
    The dollar continues to channel properly, but is falling in concert with stocks this morning.  When SPX reverses around 1560-1561, look for DX to continue falling.

    The EURUSD is bumping up against its channel top again.  This time, we should see a decent bounce — probably topping the 1.30 mark again.

    The .786 retracement of the rally from 1558 to 1573 is at 1561.72.  The .886 is 1560.2.  Either would work as a tag of the rising wedge’s lower bound.

    UPDATE:  11:07 AM

    Just got the tag of the .886 at 1560.20.  I’m going to take profits on the short from 1573 and go long here at 1559, with stops around the previous low of 1558.46.

    UPDATE:  12:15 PM

    I mentioned earlier about the dollar falling as stocks bounce.  Stocks and the dollar have had a love-hate relationship for the past few months — at times ignoring the high negative correlation that characterizes the general risk on/risk off environment since Feb 2011.

    The dollar’s next major move should be higher.  I see this as a temporary breather that should accompany the euro’s bounce, the yen’s last gasp higher, and stocks’ next little rally.

    The dollar has been on a tear for the past two months, easily reaching our interim target of the .886 Fib retracement at 83.616.

    But, completing this Bat Pattern means we should see a sell-off, as the daily RSI chart below supports.  Having broken the white channel midline, the next real support is the yellow midline.  If that falls, the next support isn’t until the intersection of the white .25 line and the bottom of the purple channel.

    If that’s all Greek to you, just know that regardless of the longer-term prognosis, there is some downside risk here at these levels which supports the idea of a reversal from the Bat Pattern.

    UPDATE:  1:10 PM

    SPX just nudged below our stop at 1558.46 and briefly dipped below 1557.  I think this is all part of an effort to shake out bulls for the next rally, and don’t see it dipping much below 1555.57 without a significant change to our forecast.

    If we reverse off of 1558.47, I might change my mind.  But, it looks like the 5-min RSI is staging a breakout to go with the price breakout.

    I’ll keep an eye on the red and white channels.

    UPDATE:  1:32 PM

    Just popped down through support on RSI.  So, I’ll play along on the downside, next target 1553.30 – 1553.38.  If that doesn’t hold, look for 1549.

    UPDATE:  2:25 PM

    SPX broke out of the 5-min channel and just back-tested it.  But, there’s no guarantee that this isn’t the start of some RSI chop while price works its way lower.  1552.10 works nicely in terms of the upside possibilities (see yesterday’s forecast), but it’s pretty much no-man’s land in terms of existing harmonic and chart patterns.

    I’m inclined to stay short for the purple channel bottom at 1546.08 or the 1.618 at 1549.09, with stops at 1558.47ish.  But, anyone who doesn’t mind the extra trading might consider going long here — with the understanding we might run into trouble at the channel top (small falling white) at 1558 or so.

    While we’re waiting for the channel to resolve itself, let’s take a look at what these extra 10 points on the downside means to the odds of reaching 1576 or higher.

    continued for members(more…)

  • Charts I’m Watching: Apr 2, 2013

    The futures are pointed higher at the opening, though the dollar and the EURUSD and the eminis themselves — which is sitting at an .886 retracement of the yesterday’s move down — don’t support the idea of higher prices just yet.

    With a 6 point pop on the opening, SPX will be right near its .886 (1569.19) as well, so playing along on the upside at the opening should be accompanied by tight stops — as this could easily be one of those lovely little pop and drops.

    But, I’m still looking for 1576, as is just about everyone else, so this could be the overnight ramp-enabled push to reach it.

    UPDATE:  9:35 AM

    There’s the tag of 1569.19.  I’ll close here and revert to short, with stops right here at 1570.58 in case I’m wrong about the pop and drop potential.

    And, just to get it off my chest, the chart patterns since the middle of March are have been some of the sloppiest, least well-formed, most forced (read “manipulated”) looking patterns I’ve seen in a long time.  This morning makes ten gaps up or down of 5+ points on the opening.

    That is, 10 of the last 12 sessions have seen a 5+ point gap in the opening 15 minutes — with the average being 8.61 points.

    Several of them have negated completed chart patterns that are normally 60-80% effective in predicting future moves, including two IH&S patterns and several Crab Patterns.

    Clearly, the Street has an objective here, and it would be wise not to stand in the way.

    UPDATE:  9:51 AM

    Just got stopped out on the short, so I guess we’re going higher.  Watch out for the rising wedge (red, dashed) top at 1572ish and the factory orders due out in 10 minutes.  Could be that’s what the market makers are in a hurry to beat.  If the numbers are lousy, good luck hitting 1576 today.

    UPDATE:  10:03 AM

    The factory numbers were, in fact, lousy.  But, they won’t be reported that way.  The top line number was +3% versus expectations of +2.6% and Jan figures of -1.0%.

    Gains without transportation were up only 0.3%.  Stripping away defense and aircraft, the figure actually fell 0.3%.

    For a reality check (not that it’ll be reported in a million years), the top line number is down over 2% from January (not seasonally adjusted) and every single measure is lower than Feb of last year.

    The top line number was good enough to get SPX to the top of the rising wedge, where it is reacting negatively.

    Anyone who went long at the new high of 1570.58 might wish to take profits or place stops back at the .886 of 1569.19 just in case.  I believe I’ll do the latter, as this (albeit manipulated) rally seems destined to succeed in it’s one and only mission — a new high about which the talking heads can crow.

    UPDATE:  10:37 AM

    Just took another look at things and figured out where this is all going.  And, surprise!  It’s not 1576.

    continued for members(more…)

  • Brave New World?

    I updated the charts for NDX, NYA, DJIA, RUT and COMP in the past few days.  The picture is mixed at best, with RUT, for instance, looking quite overripe, and COMP looking like it’s seriously considering 3343.  The DJI is happy as a lark making new highs, while NDX is coming up on all kinds of resistance at 2834.

    I suspect they’re all taking their cues from SPX right now.  And, SPX is still intent on joining the new all-time high club at 1576.10.  I see no reason why it can’t reach it, though we went to cash over the 3-day weekend just in case.

    The world didn’t come to an end over the weekend, so I’ll stay cautiously long with tight stops during the trading day and hope SPX doesn’t close at 1576.08.

    UPDATE:  10:03 AM

    The ISM’s Mfg PMI just came out and it’s a stinker.  SPX just backtested the yellow TL and quickly caught itself.

    Employment growing faster, while new orders and production are off?  No problem there.

    The small red Crab Pattern targeting 1576.46 is very much intact, so I see no reason to panic now.  Eye on the prize, eye on the prize…

    UPDATE:  10:40 AM

    Pretty sure this is an effort to shake out the longs, but a drop through 1564 means 1555-1560 is in the cards, so I’m switching sides here.  Charts in a few…

    UPDATE:  10:50 AM

    Here’s the bulls’ short-term problem…though it’s not insurmountable.  Note the loss of momentum (white channel) on the 30-min RSI…

    …and 60-min RSI…

    The daily RSI also lost the purple .75 line and the bottom of the little red channel.  But, the .25 of the yellow channel dating back to the Nov bottom is right here around 1560 and could provide a floor.  If not, the white  midline is just below.

    We obviously have negative divergence on the daily chart, but that’s been going on since Jan 25.  It’s hard to ignore, however, the potential for the purple channel to take over from the yellow, and that could mean increased odds for downside here to the intersecting white/purple midlines at 55ish.

    From a price standpoint, SPX could find support at the white 1.618 of 1559.32, but the stronger support is at the .25 purple channel line at 1555-1556 — also the vicinity of the 1.618 extensions of the much larger Crab Patterns at 1553.39 and 1555.57.

    Bottom line, while the chop that began several weeks ago continues, SPX is growing technically stronger with these tiny little pullbacks that reset RSI.  It doesn’t mean we will top 1576, but it continues the theme of TPTB being very, very careful to lay all the necessary groundwork.

    The alternative, a sloppy, enthusiastic ramp like last September’s 2-day post QE3 rally to 1474, is less sustainable to be sure.

    UPDATE:  3:10 PM

    SPX got as low as the upper end of our target range from earlier, and has since melted back up to just below the 1564 trigger point.

    continued for members(more…)

  • Close Encounters

    Will today be the day?  Five years since the market finally accepted the reality of the financial crisis, we’re almost back to where we started.

    We had a reversal at the .618 Fib, the .786 Fib (for a Gartley Pattern), the .886 Fib (for a Bat Pattern) and are now approaching a double-top triple-top.

    What will the market find when it gets there?  Will it have scaled its own Devil’s Tower, only to find that the other side falls away just as steeply?  Or, will a giant mother ship with an awesome sound system swoop down and carry it to another universe where debt is irrelevant and short-selling is prohibited?

    Stay tuned.

    The Crab Pattern that begun with the May 2 peak (in white) is only 5 points away from completing.  After that, the double-top looms at 1586.75.

    Just how close are we?

    UPDATE:  10:00 AM

    The markets opened slightly higher, waiting for economic news that came in mixed.  Beating estimates: GDP, personal income, spending.  Missing: Chicago PMI, initial claims.

    Re the PMI, ISM says:  BUSINESS ACTIVITY:  NEW ORDERS: fell sharply after three months of solid gains; PRODUCTION: lowest since Sep 2009; ORDER BACKLOGS: ninth month of contraction in the last year; INVENTORIES: fourth contraction in the last six months; SUPPLIER DELIVERIES: longest in 15 months. BUYING POLICY: CAPITAL EQUIPMENT longest since September 2012; MRO SUPPLIES longest since May 2012.

    Crummy report like that, should be good for SPX 1571 or so. Needless to say, we remain long.

    The big picture for SPX…

    A whole cluster of harmonic targets have been tagged without reaction — so far.

    A close-up…

    UPDATE:  10:35 AM

    I updated the COMP page last night.  EURUSD and RUT coming up.

    Here’s an overview of the patterns at work in SPX.  I realize there’s a lot going on there, but the important completed patterns are:

    • completed Crab Pattern from 1370-1074 (red) at 1553.39
    • completed Crab Pattern from 1474-1343 (yellow) at 1555.57
    • completed Crab Pattern from 1530-1485 (white) at 1559.32
    • tagged LT trend line (yellow, dashed) from 1994
    • tagged IH&S target from Feb 13-Mar 4 (red) at 1565.69
    • tagged the previous closing high at 1565.15

    The as-yet uncompleted patterns are:

    • the small purple Crab Pattern 1.618 at 1579.10
    • the small red Crab Pattern 1.618 at 1576.46
    • the IH&S target from Mar 18-Mar 25 at 1583.17
    • previous all-time high of 1576.09

    Of all of those, 1576.09 is the one that matters.

    The RSI charts are giving higher prices the go-ahead.

    UPDATE:  12:20 PM

    SPX reached 1568.30, in excess of the previous closing high, and is tang a pause here. Look for a backtest of the 1564.90 high and/or the yellow trend line.  I’d use the little red channel as a guide for any intra-day trading.

    It’s currently around 1564.65 and rising at a slope of 8-9 points per session. As drawn, its upper bound crosses 1576.09 at the closing bell.  Would we have it any other way?

    UPDATE:  3:15 PM

    SPX’s steady advance has had all the drama of a flossing exhibition.   We just got the first little dip outside the channel I drew over 5 hours ago.   This, along with a couple of members’ questions, prompts me to discuss my game plan.

    continued for members...

    (more…)

  • Charts I’m Watching: Mar 27, 2013

    Note:  I updated the charts for NDX and NYSE last night.  I’ll post EURUSD, DJIA and RUT later today.

    *  *  *  *  *  *  *  *

    Another day, another gap opening…

    As we discussed late in the session yesterday, SPX was smacking into resistance on the 60-min RSI chart.

    The futures are off big on more fears out of the eurozone and euro weakness.

    But, I wouldn’t necessarily chase the downside here.  For those who shorted on the close yesterday, I’d take profits at around 1550-1551.

    UPDATE:  9:45 AM

    SPX bounced at 1551.90, good enough for me.

    But, keep an eye on the 15-min RSI.  This TL should be a good guide.  It was slightly broken a few minutes ago, but the bounce off of 1551.90 brought it back in line.

    Stops around 1550 ought to do it for a long position here.  Thankfully for the bulls, the NAR reports pending home sales at 10:00AM.  I can’t remember the last time the world’s most optimistic economists delivered bad news.

    UPDATE:  10:05 AM

    Pending home sales were off 0.4% from last month (versus Briefing.com’s +2.0% estimate), but up 8.4% from Feb 2012.  The slowdown is being blamed on lack of inventory and capital for builders.  The market is hanging in there so far, so I guess we’re focusing on the 8.4% number….

    UPDATE:  10:25 AM

    EURUSD should get at least a bounce here, lending support to a last spurt for SPX.  Note it has reached the .886 retracement of the run up from Nov-Feb (1.266 to 1.3710.)

    UPDATE:  11:55 AM

    The 1551.90 low held nicely, and SPX is off only a little over 3 points at present.  We should get a little pullback here, as we’ve reached the .786 retracement from yesterday’s high (small white pattern.)

    Just noticed that each of the recent bottoms, when taken as the starting point of a measured move, points to the same place: 1566-1569.  A measured move is essentially an A-B-C move where the C wave is the same as the A wave.

    In most cases, the B wave is a Fibonacci retracement of the A wave (.382, .500, .618, etc.)  In a wildly gyrating market such as we’ve had since Mar 15, the retracements run bigger (.786 and .886.)

    UPDATE:  3:30 PM

    SPX continues to go our way, could turn positive any minute.  Will it finally push through today, or is this another fake out?

    continued for members… (more…)

  • Charts I’m Watching: Mar 26, 2013

    Big Picture for the USD:

    Daily RSI fell back into the channel recently broken out of, and is backtesting the white midline in the midst of a fairly steep decline — seen better in the closeup below.  All this, while DX has been rising.

    RSI and price are finally on the same path — a moderate correction before taking a shot at the midline of the big white channel at the intersection of the purple 1.272 and the white .786 at 85.4-85.7.

    This all fits well with our equity forecast.  continued for members(more…)

  • Charts I’m Watching: Mar 25, 2013

    With Cyprus saved, the sanctity of the EU intact, and a US budget deal passed, we can all go back to watching the market ratchet up 10 points/day, right?

    Here’s the fundamental problem.

    continued for members(more…)

  • Happy Birthday to Us

    Today marks one year since pebblewriter.com opened its cyber doors for business.  Over that year, I’ve written 351 posts with around 526,500 words (War and Peace has 560,000) which is the equivalent of about 2,100 double-spaced pages.  I’ve saved 5,976 charts (1.05 GB) of the 9,375 constructed. ThinkorSwim is thinking about naming a server after me for the thousands of drawing sets I’ve saved.

    There have been some great calls and some not so great calls.  I almost always get the direction, price or timing right.  Once in a while, I get all three (I’m usually happy with two out of three.)  And, once in a while, I really stink up the joint.  My goal is to get most of the points most of the time, which we’ve done reasonably well.
    SPX major moves since Mar 22, 2012:  715 points (1422 down to 1266, 1266 up to 1474, 1474 down to 1343, 1343 up to 1563.)  It’s worth about 9.91% plus dividends for someone who bought and held.  Total pebblewriter.com results:  1,573 points for 113% (thru Feb 28.)

    I had no idea when I first started down this path where it would lead. In 30 years of following the markets, I never thought it possible to time the daily ups and downs, much less the major moves.  Then, I stumbled across Harmonics and came up with the idea of combining them with Chart Patterns and technical analysis and… here we are!

    It’s been a lot of hard work, but a lot of fun, too. I’m excited about the managed fund in the works and am working hard to make it a reality. Thanks to all of you who have written to express your interest.  I will have some updates for you next week.

    And, thanks to all those who have completed their questionnaires already.  If you haven’t, please take the time this weekend.  As a 1 year-old, we have plenty of room to improve.  I know about some of the needed improvements, but I’m picking up a lot of great ideas from perusing your comments.

    Finally, this site wouldn’t exist without you and your support of my research.  To all who have been a part of the journey, thank you.

    Michael

    *  *  *  *  *  *  *  *

    ORIGINAL POST: 9:35 EDT

    SPX has bounced back nicely and is facing its first important test of the day here at the intersection of the top of the falling channel formed yesterday and the rising purple channel .25.  We remain long from Wednesday.

    Don’t be surprised if we see some hesitation here.  Bulls obviously need to see a break out in order to fulfill the promise of the purple Crab Pattern.  Bears would just as soon see the rally fail here and now.

    As I’ve detailed already, there are many reasons for the market to take a big ol’ dump.  SPX has barely reacted since completing several large, important Harmonic Patterns.  But, it seems to be positioning itself for a run at 1576.

    Either way, I’m fairly certain we’re in for lots of volatility.  I’d advise anyone with a weak stomach or without the ability to closely monitor their portfolio to consider tight stops and/or hedging.

    continued for members(more…)

  • Anatomy of a Top: 2000

    The 2000 top shows just how “messy” tops can be.  Here’s the finished picture in perfect hind-sight.  It’s a very crowded chart, but every single pattern had a say in how the top unfolded.

    SPX had zoomed from 442 to 1478 in about 5 years, a not-too-shabby 234% gain for an annually compounded 27%.

    Once SPX broke out of the falling purple channel, it had “permission” to pursue several harmonic patterns in the works.  SPX shot up 66 points in that one day — blowing through every Fib level between .618 and 1.000.

    It finally came to rest at 1458, completing a Bat Pattern at the purple .886.  But, the small white 1.272 was just above at 1477, as was the rising purple channel midline and the 1.272 from a much larger pattern seen below.  An IH&S target waited at 1497 – tantalizingly close to a nice round number of 1500.  And, the all-time high of 1478 from two months earlier beckoned.

    SPX got up to 1477.33 before reacting, falling to 1466 over the next two days.  Close, but not quite.  Someone watching closely might have noticed the Flag Pattern it constructed, targeting 1562.  Someone else probably pointed out the biggest Crab Pattern target of all — the 1.618 extension of the 13% correction from 1420 to 1233 from Jul-Oct 1999.

    On Mar 21, 2000 SPX shot up through the channel midline, the cluster of Fibs around 1477 and, importantly, the 1478 high and raced up toward those higher targets.

    On Mar 24, it reached 1552.87, which cleared the IH&S target at 1497, the purple 1.272 at 1519 and the last remaining Crab Pattern at 1535.  What ultimately stopped it?  The .75 line from the big purple channel dating back to Jul 1999 — almost to the penny.

    Total move: 17% and 227 points in 20 sessions.  Can it happen again?  Stay tuned.

  • Charts I’m Watching: Mar 21, 2013

    ORIGINAL POST:  9:25 AM

    The EURUSD is still trying to change trajectories (purple channel to red), but hasn’t been able to break out yet.

    The dollar is similarly facing a change in direction if the red channel can hold.

    Judging from the futures, SPX is set to react off the neckline and TL we’ve been talking about for several days. Though, daily RSI still shows a little more upside potential.

    I’ll play along on the downside, but will be looking to see if it gains support at the purple channel midline.

    UPDATE:  09:23 AM

    That should do it for the short side, going full long again here at 1550.7 with stops at 1548ish.  Always fun, trying to catch a falling knife…

    The 15 min RSI shows support with SPX here at the .500 Fib.

    Fresh charts in a few…

    UPDATE:  9:50 AM

    If SPX reverses here, it leaves a much nicer right shoulder for the IH&S we discussed yesterday.  And, the revised purple channel looks more sustainable.

    Existing home sales, Philly Fed and Leading Economic Indicators are due out at 10 EDT.

    UPDATE:  10:01 AM

    Data better than expected on Philly Fed and Conference Board Leading Indicators, a miss on NAR existing home sales.

    The leading indicators look a lot more positive than the current, which barely moved.

    No charts for the NAR, but sales came in at 4.98 million vs expectations of 5.0 million.  Inventory increased from 4.3 to 4.7 months, which flies in the face of the most commonly heard argument that a shortage of product was driving prices higher.

    There are no doubt pockets of actual product shortages, just as there are many with a huge excess.  But, the price increases have more to do with math than with supply and demand at the moment.

    The NAR, like everyone else, reports average (median) prices.  The entire market could remain at a standstill, but if the bottom 5-10% (in price) of houses are bid up, the average price increases.  It wouldn’t affect the average house, just the average price of all houses.

    That’s why many average homeowners remain underwater and unable to sell their houses for the asking price despite the “good news” from the NAR/MSM.  So, what’s happening to bid up prices on the low end?  Enter our friends at the Fed.

    As Bloomberg reported a few days ago, big institutional money is chasing single-family homes.  With the stock market at all-time highs, bonds at 2% and much of the rest of the world in questionable economic condition, the new bubblicious investment is housing.

    Blackstone, which put $3.5 billion to work buying 20,000 houses, just increased its credit line by another $1.5 billion.  Colony Capital owns 7,000 units and is raising another $2.2 billion.  American Homes-4-Rent owns 10,000, and is buying up more.

    Institutions represent a large percentage of the buyers in many markets which have rebounded the most:  Miami (30%), Phoenix (23%), Charlotte (21%), Las Vegas (19%.)   But, will the dead cat bounce translate into profits for investors?

    As fools rush in, rents are falling in many of the markets in play — making it tough to derive much cash flow.  Colony Capital will be buying another $2.2 billion worth of houses, even though their current portfolio occupancy is only 53%.  In an environment of 2% 10-year treasuries, the 4-5% cash-on-cash yield might look pretty good — especially coupled with some degree of inflation protection.

    I can’t help but think this is another big bubble in the making — courtesy of the Fed’s ZIRP.  Even after 5,000,000 foreclosures since the 2006 peak, new delinquencies continue to surface — including a steady contingent of older, more seasoned loans as this LPS chart shows:

    Global Economic Intersection ran a nice piece Tuesday posing a thought-provoking idea:

    “The housing market is therefore the hostage of economic growth and not the signal of economic growth.”

    The evidence of yet another liquidity-fueled, lack-of-any-better-alternatives bubble is here.  Investors must decide whether to button their chin straps and get in the game, or watch from the sidelines as the greater fools slug it out the red zone.  Stay tuned.

    UPDATE:  2:05 PM

    With the move down through 1548, I gave SPX a little more wiggle room to the .618 of the last move up at 1547.35.  It bounced, but couldn’t hold, prompting me to take a short-term short to cover my core long position.

    I’m closing the short here at the .786 of 1543.75 for a small gain.  More charts, revised channels coming up.

    The bullish case needs 1546.27 to hold firm.

    UPDATE:  2:30 PM

    Hard to keep up with charting this morning, with things moving rather quickly and dropping a little further than I expected.  Looks like the .786 will hold, but let’s make that the new stop.

    The 60 min RSI has found midline support at a potential falling channel (purple) and a rising channel which isn’t as convincing as I’d like (yellow.)

    UPDATE:  5:30 PM

    Weakness everywhere around the close.  I’m going to lay out the bullish and bearish scenarios, but from a chart pattern standpoint, this is a toss-up.

    Taking a look around the indices, I see a lot of indices at make or break points.  I just revisited RUT, a great case in point.  Drawn from the 98 and 02 lows, one channel makes a great case for the upside being done.

    The daily chart CU shows just how precisely we’ve tagged the top of that channel and the TL’s the make up the rising wedges.

    Drawing the channels off the 98 and 09 lows, however, shows RUT has already pushed above and backtested the channel top (in purple.)

    Throw in some Harmonic Patterns and things get really interesting…

    There was a big reversal at the .786 of the 2007-2009 crash, so we should expect a Butterfly Pattern to play out at the 1.272 of 996.26, right?

    But, look at all the TL’s of resistance we’d have to push through first…

    Besides the trend lines, the purple 1.618 hasn’t really caused a reaction yet.  The white 1.618 has, but not much of one.  And, note that the yellow pattern calls for a run to the 1.618 at 1033.  Mixed signals, to say the least.

    More in the morning…

