Posts

  • Charts I’m Watching: Mar 20, 2012

    The ECB will do “whatever it takes”, which I guess now translates into strong-arming the Russians into bailing out Cyprus.  Still no break out on the EURUSD, though.

    It makes sense to play along with the upside, but keep stops close.  It’s questionable whether this rally will have any legs. The dollar looks like it’s finding support here.

    UPDATE:  09:33 AM

    Looks like a pop and drop by SPX standards.  That was the .786 of the move down from 1563.62 (purple) and the .886 of our proposed path to 1576 (white.)  Full short again, stops at 1561ish.  Revised charts in a few minutes…

    UPDATE:  09:55 AM

    The daily chart tells the picture well.  I need to redraw some channels, but the prominent features are:

    • large 1474-1343 Crab Pattern completion at 1555.57 (yellow)
    • large 1370-1074 Crab Pattern completion at 1553.39 (red)
    • small 1530-1485 Crab Pattern completion at 1559.32 (white)
    • small rising wedge broken at 1563 top
    • long-term TL and channel top at 1560

    UPDATE:  11:10 AM

    SPX continues to position itself for a run at 1576.  The 5-min chart shows a small potential Crab Pattern with a 1.618 at 1577 and a Flag Pattern targeting 1576.

    It has broken back above and backtested the purple channel midline and retraced nearly .886 of its drop from 1562 and a little more than .786 of the drop from 1563.62.

    While it’s positioned for 1576, there is no more certainty than when we first broke 1555 on the Mar 14 overnight ramp job.  The large, bearish patterns listed above have still not produced the kind of sell-off they normally do.

    And, it’s all because of the cheerleaders’ determination to be able to tout a new all-time high for the S&P 500.

    In addition to the little Crab Pattern (purple) that targets 1577 and the flag pattern targeting 1576, there’s an obvious effort to construct an IH&S pattern targeting 1580.  It could benefit from a lower right shoulder, but bulls must beware of crossing back beneath the purple channel midline.

    The S2 shoulder isn’t quite legit, BTW, as the neckline doesn’t quite connect on the left side.  But, the S1 shoulder is quite a ways down there.  So, if the pattern plays out, be prepared for some serious chop.

    UPDATE:  1:00 PM

    With the FOMC announcement a little over an hour away, let’s resume our chat about the big picture.  If it seems like we’re “lost in the reeds” as one reader so aptly put it, it’s because we are.

    The large Crab Pattern completions promised a good-sized dump last week at 1553/1555.  Instead we’ve inched higher.  Why?  These patterns completed in the middle of harmonic no-man’s land: the gap between an .886 retracement and a double-top.

    The .886 retracement (of the 1576-666 crash) produced a 9% reversal back on Sep 14.  Since then, SPX came screaming back to retake the 1576 all-time high — but slammed into the Crab Patterns and a very important channel line along the way.

    Now, it doesn’t know what to do.

    Double tops usually produce reversals, too — sometimes meaningful ones as we found out on October 11, 2007, when SPX scooted up past the 1552 top from 2000 by a whopping 24 points before dropping 58%.

    The 2000 top itself shows just how “messy” tops can be.  Here’s the finished picture in perfect hind-sight.  It’s a very crowded chart, but every pattern on there had a say in how the top unfolded.

    Once SPX broke out of the falling purple channel, it had “permission” to pursue several harmonic patterns in the works.  SPX shot up 66 points in that one day — blowing through every Fib level between .618 and 1.000.

    It finally came to rest at 1458, completing a Bat Pattern at the purple .886.  But, the small white 1.272 was just above at 1477, as was the rising purple channel midline and the 1.272 from a much larger pattern seen below.  An IH&S target waited at 1497 – tantalizingly close to a nice round number of 1500.  The all-time high of 1478 from two months earlier beckoned.

    SPX got up to 1477.33 before reacting, falling to 1466 over the next two days.  Close, but not quite.  Someone watching closely might have noticed the Flag Pattern it constructed, targeting 1562.  Someone else probably pointed out the biggest Crab Pattern target of all — the 1.618 extension of the 13% correction from 1420 to 1233 from Jul-Oct 1999.

    I don’t know what the catalyst was, but on Mar 21, 2000 (that date sounds awfully familiar) SPX shot up through the channel midline, the cluster of Fibs around 1477 and, importantly, the 1478 high and raced up toward those higher targets.

    On Mar 24, it reached 1552.87, which cleared the IH&S target at 1497, the purple 1.272 at 1519 and the last remaining Crab Pattern at 1535.  What ultimately stopped it?  The .75 line from the big purple channel dating back to Jul 1999 — almost to the penny.

    Total move: 17% and 227 points in 20 sessions.  Could it happen again?

    continued for members(more…)

  • Containment and other Fairy Tales

    Friday marks the one-year anniversary of the new pebblewriter.com (I can finally stop calling it that!)  Despite all the twists and turns, it’s been a pretty successful year [see: RESULTS.]

    But, I’m always on the lookout for ways to make it better.  So, please take a moment to share your thoughts when the 1st annual pebblewriter survey hits your inbox. 

    It’s just a few quick quick questions regarding pebblewriter.com and a managed fund under consideration.  If you’d like to be on the mailing list once information becomes available, just CONTACT ME and tell me “put me on the list.” 

    *  *  *  *  *  *  *  *

    Just how top heavy is the market?  According to a study posted by Albertarocks, complacency is at an all-time high.  The SPX:VIX ratio just tagged 138.37, topping even 2007’s peak.  To give you an idea how big a deal this is, that’s almost 3 standard deviations above the 30-month moving average.

    This is the lap into which the Cyprus mess was dropped. With exquisite timing, the euro-bumblers have unwound all the feel-good kumbaya momo generated by Draghi who, we were promised, would do “whatever it takes.”

    Never fear, though.  According to a note Goldman Sachs put out earlier: “…assuming the package is passed, the direct ramifications from Cyprus will likely be contained.”

    Containment.  Didn’t we hear that word a lot when the Fukushima reactors were melting down… and when the London Whale was blowing up?  It reminds me of language back in late 2007, this from The Guardian:

    The Wall Street bank Lehman Brothers dodged the worst of the credit crunch to achieve a 5% rise in annual profits to $4.2bn (£2.06bn), driven by tight risk control and impressive earnings from global equity trading.  A strong performance in the first nine months offset a 12% drop in profits in the quarter to November, when fears over the sub-prime crisis returned.

    Chris O’Meara, the bank’s global head of risk management, said: “Although we have not emerged unscathed from the recent market turmoil, we believe we have done a good job in managing our risks.”

    An analyst…said: “For many investors, it is not necessarily about beating expectations but the lack of skeletons in the closet of fixed income. Lehman seems to have fewer skeletons.”

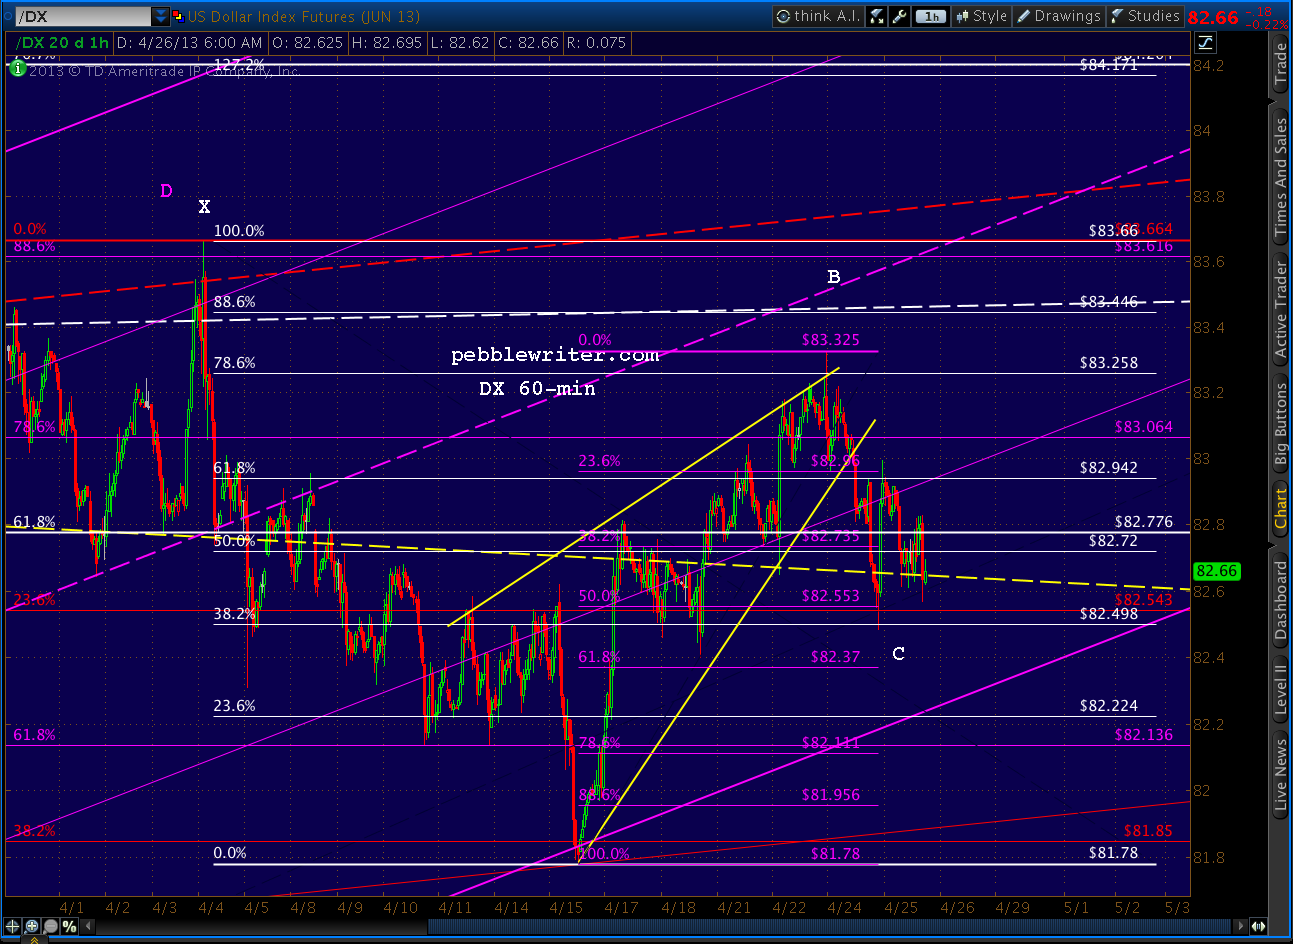
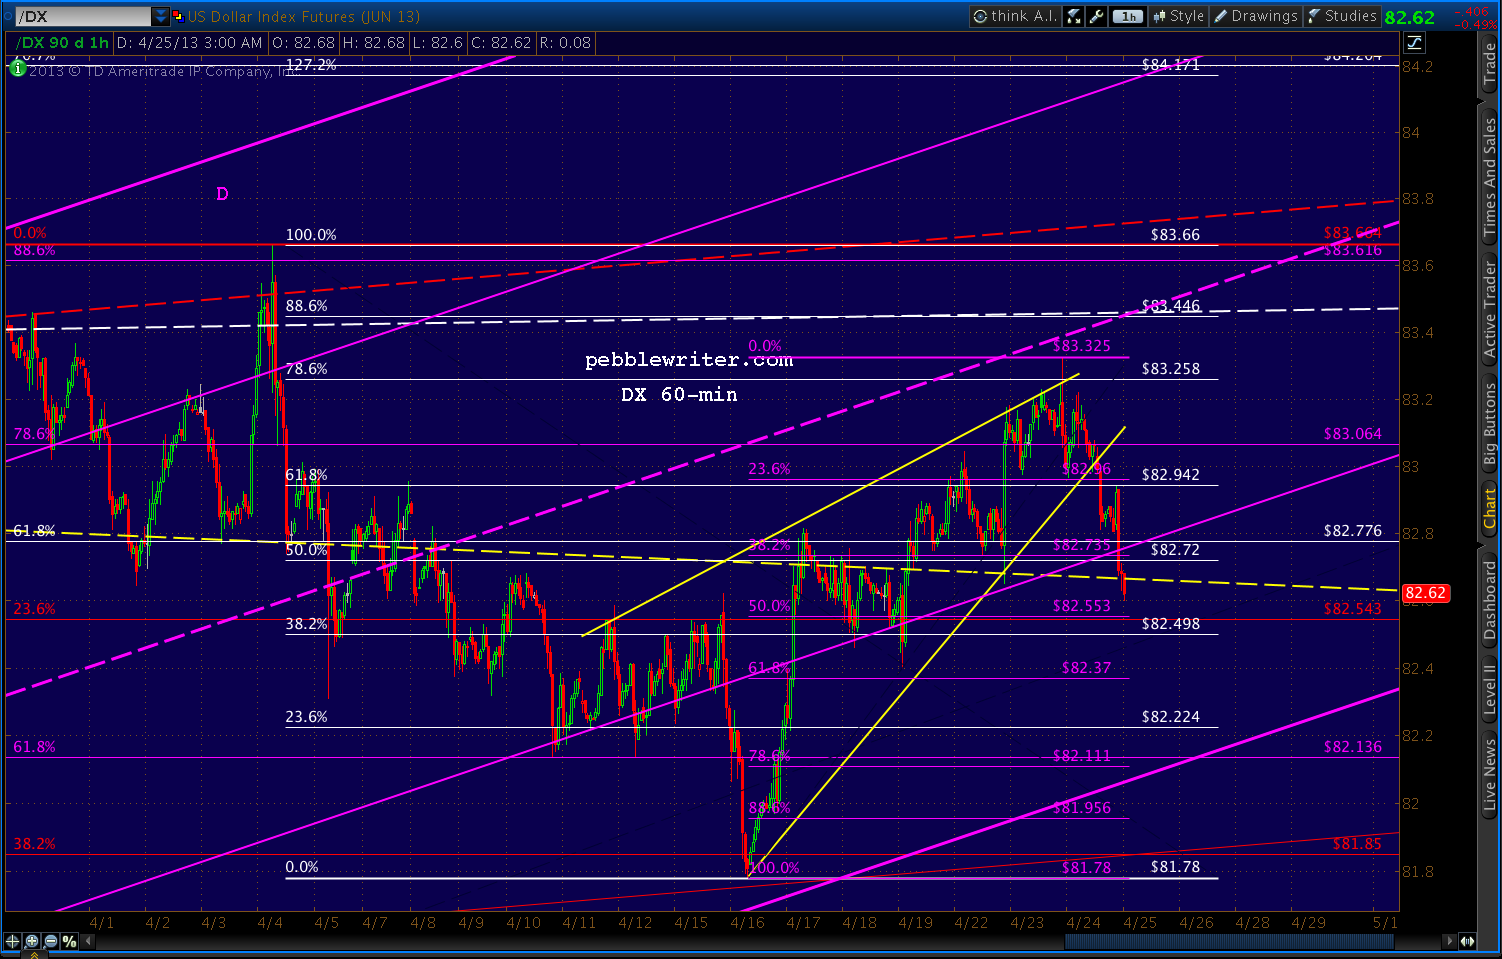
    The dollar is consolidating at the target level identified last Friday and is struggling with whether to continue in lock step with US equities or revert to its more traditional role (of late) as the risk-off instrument of choice.

    While, the EURUSD — which had made a valiant effort to break out of a rapidly declining channel — is again testing its recent lows.

    Not to worry, though; the FOMC meets today and tomorrow and is certain to have the situation, well, contained.

    SPX almost reached the .786 retracement of the drop from 1563.62 yesterday before falling back to support at the purple channel midline.  Bulls need a strong move above 1553-1555; bears need a drop through that midline — currently around 1550.

    Anyone playing the bounce from yesterday’s 1545 low would do well to keep an eye on the  channels for signs of a breakdown.  I remain short from 1561, but won’t rest easy until we can score some lower lows.

    Yesterday’s reversal just shy of the .786 opens up the possibility of a Butterfly Pattern to the 1.272 or 1.618 extension of the recent 1563 – 1545 drop.  The 1.272 Fib is at 1568.65 and the 1.618 is at 1575.05 — one point below SPX’s all-time high.

    It’s not that the market should trade through 1576, but the opportunity might prove fleeting and the target too irresistible for TPTB.

    UPDATE:  12:00 PM

    Finally getting some action — SPX just broke beneath yesterday’s 1545 low.  We’re seeing a bounce on the 1.272 of the drop from 1530 to 1485, but it will probably only reach 1545 as the market continues to drop.

    Now that things are loosening up, I’ll hazard some more specific downside targets.

    continued for members(more…)

  • Mad Men, Liars and Thieves

    The surveys are coming!  Check your inbox later tonight for a survey regarding pebblewriter.com and a new managed fund under consideration.  Not yet on the mailing list?  CLICK HERE.

    Friday marks one-year anniversary of the new pebblewriter.com (I can finally stop calling it that.)  Despite all the twists and turns, it’s been a pretty successful year [see: RESULTS.]

    But, I’m always on the lookout for ways to make it better.  So, please take a moment to share your thoughts when the survey hits your inbox.  Thanks.

    *  *  *  *  *  *  *  *

    It’s hard to believe the folks running the big show in the euro zone could be so stark-raving mad.  Raising taxes on countries with 25% unemployment seems positively brilliant compared to the idea of confiscating 10% of bank deposits — especially those that are supposedly insured.

    Get ready for the media interpreters who assure us “it’s only Cyprus” —  which reminds me an awful lot of “it’s only Bear Stearns” or “it’s only Lehman.”

    The issue, of course, isn’t the size of the depositor base in Cyprus banks.  It’s the effect this action will have on depositors in Portugal, Spain and Italy.

    By now, even the most clueless depositors have to be wondering just how safe their deposits are.  The smart ones already know.  And, the brilliant ones moved their money a long time ago.

    This bone-headed action also calls into question the ECB’s willingness and/or ability to support troubled nations/banks.  If they can’t float a lousy $13 billion to bail out Cyprus, how will they react when other, larger systemic risks pop back up?

    And, last but certainly not least, what effect will this action have on the $700+ trillion derivatives market?  It’s a spiders nest of complicated agreements whereby one party guarantees another that credit quality/interest rates/etc. won’t slip past a certain level.

    These private contracts are bought and sold countless times, to the point where no one usually knows the true exposure of any given player until it’s too late.  When a bank fails, it’s very difficult to discern how many counterparties will be affected.  It quite rightly shakes confidence in the entire system.

    Cyprus is a reminder that the euro zone is not “fixed.”  It’s a reminder that much more is needed to fulfill the promise of “whatever it takes.”  And, it’s a reminder that the Fed and the ECB either don’t have as much control as they’d like us to think, or are losing interest in preventing every little hiccup along the way.

    *  *  *  *  *  *  *  *

    The dollar may have just completed the transformation we discussed at length Friday — reverting back to the risk-off safe haven to which we’re accustomed.

    The smallest rising wedge on SPX has clearly broken down and should now try to establish a channel something like the one drawn below. Look for a playable bounce here around the midline between 1543.43 and 1546.

    UPDATE:  10:10 AM
    We got the bounce at 1545.13.  If the bears can keep the trend going, it should fail before the next higher channel line — currently around 1558 — or the yellow TL up at 1560.  But, of course, there’s no reason it has to be more than 1553.39 (the 1.618 extension of the 1370-1074 correction in 2011) or 1552.19 (the .382 retracement of the move down from 1563.32.)

    As legitimate as the little white channel above appears, it’s merely a conjecture.  A pitch.  If Cramer & Co. can convince the average small investor to ignore the implications of Cyprus and embrace a market selling near all-time highs, the channel is proof of the absence of risk in the markets.

    It coincides nicely with the midline of the larger purple channel that’s guided SPX’s upside since November.  This morning’s dip looks like nothing more than a successful test of the midline.

    Here’s a close-up, showing the tag of the .236 Fib (red) and slight push below the purple midline.  Important for the bullish case: (1)  the white 1.272 is even still intact, and (2) prices are re-testing the 1.618 Fib at 1553.39.

    If SPX pushes higher than 1553.39, it reinforces the idea that the Crab Pattern set up by 2011’s plunge from 1370 to 1074 is going to fail (8 points would be a failure.)  If it drops below, then the push up to 1563 can be characterized as a momentary blip of irrational exuberance.

    The technical elephant in the room, of course, is whether or not SPX will continue to take a run at the previous high of 1576.  It’s not as though bulls will throw in the towel over Cyprus.  Take the move down from 1563, for instance.

    If this bounce from 1545 retraces all the way to the .786 at 1559.66, it will have set up a potential Butterfly Pattern that targets 1575.   Look for the little white channel to turn by the .500 (1554.38)  in order to construct another leg up.

    UPDATE:  1:25 PM

    Where does this morning’s dump fit in with yesterday’s LT charts from the last post [see: Do or Die]?

    continued for members(more…)

  • Do or Die Time

    As we discussed yesterday, it’s do or die time for the equities markets.

    Keep an eye on the small rising wedge today.  A break down below 1560 is important to the bears’ case — while the bulls obviously have their sights set on the all-time high of 1576.

    As always, watch for a backtest after the wedge is broken.  Any such bounce should fail by 1562.80 or so.

    The US dollar reached our Mar 4 target [see: After the Funding’s Gone] and reversed sharply.  Note this was the confluence at the completion of a Crab Pattern (in purple below), a Bat Pattern (red) and two channel midlines.

    The channels can be better seen on a longer term chart.

    DX and SPX have become mildly positively correlated of late with the 25-day moving average at 0.59.  This is a huge shift from the high negative correlation we had all become used to: as the dollar as a safe haven during equity market sell-offs:

    This chart from Deutsche Bank showing the 1-year rolling correlation has been widely circulated.  It’s a week old, but shows that despite some huge swings over the past few years, correlation continues to become more and more negative.

    The last little blip up in the dark blue line represents a relative decrease in negative correlation, but it appears to have formed a channel since 2009.  In the absence of a breakout, one would expect the trend to continue…


    From a technical standpoint, whether the trend continues or not — and, where the dollar goes from here — couldn’t possibly be more important.

    The ebbs and flows of the relationship can best be seen in a long-term comparison.  Here, we can see long periods such as 1995-2000 when they moved in lock step.  Notably, when stocks faltered in Aug 2000, the dollar vacillated for a while before finally joining in in Jan 2002.

    But, when stocks finally bottomed in 2003, the dollar continued to sell off.  It got a big bounce in Dec 04 (the previous low) but didn’t bottom out until Apr 08 as SPX was about to fall off a cliff.

    When stocks bottomed in Mar 2009, the dollar peaked.  The next time the dollar bottomed was in May 2011, as the 2011 correction got underway.  It rallied again with the equity sell-offs in Apr 2012 and Sep 2012, but has so far failed to break the high established in July 2012.

    Why should equity investors care so much about the recent shift in the relationship between these two?  When we chart DX, we can see that equities often moved dramatically at fairly predictable key turning points.

    The most prominent chart pattern for DX is the falling channel shown above.  When DX dropped through the midline in 2003, it marked a bottom for equities.  They rallied strongly until the dollar finally approached the channel bottom and, as mentioned above, fell sharply after it bottomed.

    As DX raced up toward its midline, stocks plunged toward their 2009 low.  The dollar’s peak and stocks’ trough were almost simultaneous.  As DX fell away from the midline, stocks took off — not pausing again until DX’s next run at the midline in Apr 2010.  As soon as DX tagged the midline, stocks were off to the races again.

    In May 2011, the dollar bottomed again, enabling us to draw a little rising channel reflecting the strengthening trend since.

    Like its big brother, this smaller channel has proven pretty successful at indicating potential turning points — a breakout or breakdown — at its midline.  In general, each downturn from the midline meant the accompanying equity rally was nearing at end.

    Stocks didn’t actually reverse until DX bottomed at either the channel bottom or the .25 line as occurred with the May 2011, Apr 2012 and Sep 2012 corrections.

    Significantly, this last bounce off the .25 line in late January resulted in stocks going up.  The SPX has rallied 160 points or so, leaving us to wonder whether DX will head back down — which has always produced equity rallies — or break above the channel midline.

    The past several instances have produced large declines of 630 points (May 2008), 200 points (Apr 2010) and 160 points (Apr 2012.)

    In other words, a sudden strong rally in DX is highly likely to accompany a sudden and significant decline in stocks.  And, as we’ve seen in the past, prices that approach a midline are, by definition, poised to break out or break down.

    So, which will it be here for the dollar: a break out or a reversal?  Let’s set aside SPX’s recently completed bearish chart patterns for the moment, and focus on DX.

    Based on the larger of the white channels, we would have to conclude DX has much more upside.  Its midline is up around 86-87, which would clearly take DX beyond the smaller channel midline — tagged yesterday at 83.42.

    In addition to the small white midline, however, DX will need to break above the .75 line on another falling channel (purple below) in order to reach the larger midline.

    But, it might not be all that difficult.  DX recently broke back above a trend line drawn from the Jan 2002 and Jun 2010 highs.  This TL looks fairly decent as a channel (yellow below), and reflects another breakout such as the one which occurred in Apr 2012.

    That DX channel breakout, of course, accompanied the SPX slide from 1422 to 1266.  It backtested nicely, then suddenly failed when the Fed announced QE3.  Prices fell back into the channel until the latest breakout in February.

    In keeping with the theme of sudden strong DX rallies being unhealthy for stocks, take a look at the Fibonacci Fan chart below.

    Each time DX crossed one of those lines — even by just a little — SPX reacted.  DX has reached the latest line — the .707 — and is thus signalling either an equity breakout or breakdown depending on which way it goes.

    Weekly RSI mirrors the rising channel DX has been in since October 2007.  DX RSI recently broke out of the latest falling red channel and through the white channel midline.  After reacting against the purple .75 line, RSI is backtesting the white channel midline.

    If it’s more than a back test and RSI breaks back below the midline, this would confirm DX’s price reversal.  If, on the other hand, DX RSI survives the midline, it’s not hard to imagine a rally to the top of the purple channel or even the white channel .75.

    The daily RSI chart shows a similar situation.  RSI is finding support on the small white midline, the large white midline, and backtest of the red channel it just broke out of.

    A reversal here and a strong rally qualify would qualify as one of those sudden turns that isn’t terribly healthy for equities.

    I know, I know.  With eleventy zillion dollars being pumped into the markets every hour by Bernanke and friends, how in the Wide World of Sports could the dollar suddenly soar and the stock market flop?  The answer to that, of course, requires one more chart.

    I’ve marked some of the more obvious “sudden, strong rallies” in DX which, as discussed above, frequently coincide with sudden, strong declines in stocks.

    But, note how many of them occur as SPX is nearing one of its own channel lines drawn off the 2000 and 2007 tops.

    We’ll get into that and other channels in the forecast coming up next. But, it’s fascinating that SPX is only a few points from a channel top dating back 13 years just as DX has arrived at the confluence of such important support and resistance lines.  For both, it truly is do or die time.

    I’ll continue with the forecast for members after a quick break.

    continued for members(more…)

  • Moment of Truth: Mar 14, 2013

    SPX is fast approaching the moment where it must either break down or break out.  As we detailed on Tuesday, there are a limited number of patterns providing resistance at these levels.

    The all-time high is just above at 1576.09, but SPX is already bumping up above three Crab Patterns that should smack it back down.

    As we discussed in yesterday’s last update, a push above the 1556.77 high was reason enough to play along on the upside, but I can’t see SPX topping 1564 without doing serious damage to the bear case.

    I’m going full short again here at 1561, and will wait and see…again.

    But, keep in mind that the 161.8 of the latest small pattern and the 261.8 of the red pattern, not to mention the IH&S target of 1565 are all just above, and are easily attainable within the rising wedge.

    And, lately, SPX seems intent on bagging every last target within sight.

    UPDATE:  10:35 AM

    Yesterday I posted a strange concoction of mine that plots time and price Fib levels against a rising wedge.  In my experience, most rising wedges break down somewhere between .618 and .886 of the time and price from inception to apex.

    As the wedge is currently drawn, the .886 price Fib is around 1562 and the time Fib is around tomorrow morning.  But, keep in mind the rising wedge itself is subject to wiggle room (primarily, whether to include shadows/tails or not.)

    So, the placement of the apex, which is just the intersection of two (hopefully) precisely drawn trend lines, determines just how accurate the grid is.

    Wedges that go beyond the .886 Fib in price or time are likely to break out instead of down.  This is not highly unusual.  But, in this case, a break out would mean the trend line from 1994 we discussed the other day has been broken.

    It’s broken now intra-day, which doesn’t concern me too much. But, a close, backtest and move higher would likely mean the 1576 high would be taken out.  I’ve switched it to a dashed yellow line to better distinguish it from the RW.

    I’ve highlighted the most likely target range if prices are going to reverse.  Included in that circle are:

    • the RW time Fib .886
    • the RW price Fib .886
    • the smallest scale (white) 1.618
    • the red 261.8
    • top of the rising wedge
    • three channel lines
    •  the inverted H&S target.

    Aside from those, it is of little consequence (sarc.)

    In summary, we’re watching to whether or not SPX closes above the TL from 1994 and the two large Crab Pattern 1.618 Fibs.  It’s okay to poke around in the vicinity, and Crab Patterns don’t always reverse immediately at their 1.618s, but a leg higher would be bullish.


    UPDATE:  3:50 PM

    After a full day of charting, I have some exciting things to share later this afternoon.

    Here’s the updated 15-min chart,  w/ the time and price Fibs and the key chart patterns.  If we get a push through the RW (1565ish, also the IH&S target) by the end of the day, I intend to go long.

    Otherwise, I’ll sit short overnight.  Much more to come later, including a revised forecast.

    Lots of charts in the morning…


  • Charts I’m Watching: Mar 13, 2013

    We had a precise tag on the .618 Fib level late yesterday, which often suggests a Gartley Pattern completion at the .786 (1554. 94) or a Bat Pattern at the .886 (1555.80.)

    As with all potential first waves down, a deep second wave retracement is always a possibility.  So, we won’t know for sure whether 1556.77 was the top until SPX breaks above it or breaks down beneath the rising wedge (the yellow TL) and the former low 1548.24.)

    UPDATE:  9:45 AM

    A breakdown here would be perfectly in keeping with the Crab Pattern completions on Monday (1553 and 1555.)  It also fits with the most common rising wedge scenario where breakdowns occur around the .786 Fib retracement (or .886) of the price and time from inception to apex.

    By placing this RW in both time and price grids, we can see that the .786 Fib time ratio and the .786 price ratio have both been met.

    But, if SPX can rally up past 1556.77, the .886 is still up there at 1559.7. which just so happens to intersect with the 1.618 extension of the price movement from 1530.95 to 1485.01 (and the 1.272 extension of yesterday’s drop from 1556.77 to 1548.24.)

    On the other hand, any move down through 1548.24 damages the odds of a higher high.  So, anyone playing the bounce off 1548 should stay nimble and manage stops accordingly.

    Remember that there are a couple of small H&S Patterns currently in play.  A close below 1548.24 confirms them.

    UPDATE:  10:10 AM

    SPX came within one cent of yesterday’s lows, which reminds me of yesterday’s rally to one cent above the presumed right shoulder of the little H&S we were watching.  This tells me that certain someones are working very hard to keep the bull story (technically) alive.

    We’ve had several busted patterns in the past couple of weeks – patterns like the H&S that are normally quite reliable.  If SPX could break out of the RW itself, that would be a nice trick for the bulls.

    Just like the rising wedge, the 60-min RSI channel that convinced me to take an intra-day long position just before the close yesterday is in danger of breaking down.  Looking at the 30-min chart, its easier to see the market’s indecision.

    While we’re waiting for the short-term indecision to be resolved, let’s continue with the look at the big picture we started yesterday.  It’s been hampered somewhat by technical issues with the latest version of TOS’s charting software.

    When I draw channels, they don’t stay put.  They expand to a width of their own choosing and can’t be put back.  It can take 5-10 minutes just to trick the software into placing one channel properly — which makes charting a real joy!

    They assure me that tonight’s release will fix this and other, lesser issues.  So, hopefully I’ll be back to full speed.  It’s normally very good software, but the frequent releases are sometimes a pain.

    continued for members(more…)

  • Charts I’m Watching: Mar 12, 2013

    We tagged the two largest Crab Pattern targets on the charts yesterday: the 1.618 extensions of the 1370-1074 decline in 2011 and the 1474-1343 decline in 2012.

    At this point, we’re waiting to see if SPX has the juice to also snag the white 1.618 at 1559.32 and/or the IH&S pattern target of 1565.  Both are perfectly legit, though they are of a much smaller scale and thus not as important in the scheme of things.

    I’ll spend most of the morning laying out the downside scenario.  For now, support should be expected around the key channel lines such as the bottom of the white channel (currently at 1545), the purple channel midline (currently around 1540), and the small channel that’s guided prices since the breakout on Mar 5 (around 1549) that we’re just now reaching.

    Note that the first two price levels are in the vicinity of significant Fib levels: the white 1.272 and the red 1.618.  A reversal down to a previously topped Fib level can be viewed as a backtest on the way higher, so the bounces are often significant.

    The bounce off the bottom of the small white channel should provide a backtest of that channel’s broken .25 or midline but should fail by 1553.40.  When the little white channel fails, the yellow one should go quickly.

    UPDATE:  1:55 PM

    As expected, SPX bounced at the little white channel bottom and backtested its midline.  SPX is now testing the little white channel bottom.   The yellow channel bottom is just below at 1548ish and the purple midline is around 1541.50.  Each can be expected to provide a playable bounce, but we’ll decide when we get there.

    Okay, back to the big picture…

    First, let’s take a look at the Fibonacci Fans for SPX.  Over the years, they’ve done a reasonably good job of providing price warnings.  That is, prices tend to bounce along between neighboring lines until some catalyst — often a competing Fan Line — forces prices higher or lower.

    At that point, prices tend to backtest the just-broken fan line and continue bouncing between the next higher or lower pair.

    When the Fib Fan lines from 1994 were broken, for instance, prices typically fell to the next lower line — unless they fell two lines.  In either case, a break of one of those lines should have been taken seriously.

    And, note how SPX has repeatedly bumped up against resistance from the very same line that finally provided support for bottoms in Oct 02 and Mar 03.  I presented it yesterday afternoon as a factor in our decision to go full short at 1555.15.

    Looking at a close-up of the chart, we can see how the next couple of weeks might play out.

    continued for members(more…)

  • Results: Feb 28, 2013

    The S&P 500 gained about 6% between the last update (Dec 20, 2012) and the Feb 19 highs of 1530.94.   The index gave back half of the gains over the subsequent week, then retraced 88.6% of those losses over the next two sessions for a total move through Feb 28 of about 11%.  Our calls accomplished approximately 19% over the same period.

    December, 2012

    December 2012 wrapped at +9.20%, leaving us with a total return for 2012 (since inception on Mar 22) of 97.99%. The S&P 500 was up 2.36% over the same period (excluding dividends) and the average hedge fund earned 7.32%.2

    I had anticipated a significant reversal in mid-December at SPX 1346, and the market accommodated with a 3.3% decline into the year’s end based on an analog that served us very well since April, 2012.

    January 2013

    Even though Congress failed (as expected) to really resolve the fiscal cliff dilemma, the market saw the resolution as “good enough” and pushed higher during the low-volume New Year’s holiday week.

    The next two weeks were spent in harmonic pattern limbo, deliberating whether a double-top or a new high was in the works.  Finally the question was settled by a push past the Sep 2012 highs — right into the next harmonic target range. With only 9 sessions left in the month, there was little time left in which to accomplish much.

    At +4.46%, January was the first month in which our numbers lagged the S&P 500.  I realize that 4.46% is nothing to sneeze at; but, in retrospect, I should have exercised more caution around big news days, used tighter stops and perhaps traded a bit more frequently.

    February 2013

    At +11.43%, February was a much more rewarding month — but, not without its challenges.  Prices fluctuated by 10 or more points in a full two-thirds of the trading sessions.  But, volatility creates trading opportunities, so I took full advantage.

    It seemed at the time that I traded too frequently (33 times, including 14 intra-day trades that added 5.50%.)3  Looking back, however, SPX gained only one point between the Feb 1 close and the Feb 28 close.  In other words, it was the kind of month where day traders are rewarded, and buy-and-hold types should have gone skiing.

    If nothing else, February convinced me that a managed fund could deliver added value for pebblewriter subscribers who have neither the time nor the inclination to sit by their computers waiting for the next trade signal.

    Even for those who do, there is the problem of time lag.  Under the best of circumstances, it can take several minutes to transmit a newly hatched idea — more if charting or explanation are involved.

    By the time a member receives, reads and acts on the information, prices can move appreciably — potentially reducing returns and/or increasing risk.  A fund should, at the very least, eliminate the lag.  I am currently working with advisors and will announce details as soon as possible.

    Summary

    As of Feb 28, we’re up 113.08% since inception for an average monthly return of about 10.05% — on track with our Dec 20 report.  I’ll continue to work on finding the right balance between trade frequency and risk-adjusted returns.

    The road ahead looks no less bumpy.  Will QEn sustain uninterrupted new highs, or will this market — like every one before it — soon reveal its Achilles heel?  Interest rates are on the rise, while a whole host of economic indicators and corporate earnings are flagging.

    Personal income is slumping, employment isn’t much better, the euro zone is officially back in a recession, China is faltering and central banks the world over are racing to devalue their currencies as debt continues to skyrocket.  Where’s the upside in that scenario?

    The day will come when money printing and accounting gimmicks alone won’t be enough to levitate the stock market.  At the end of the day, real profits require that someone, somewhere, buys something.  A bull market that rallies to new highs while ignoring that basic premise is, in my opinion, not long for this world.

    Stay tuned…


    Notes:

    1 According to this Barron’s article, only one of the hedge funds tracked by HSBC earned over 40% in 2012; another 7 earned 30% or more. The average fund earned 7.32% and about one third lost money.

    2 Remember, our “performance” is based on a theoretical unleveraged portfolio utilizing only long and short positions in SPX based on the tops and bottoms identified on pebblewriter.com.  Trading expenses are not included.  Your mileage will vary.

    3 Late last year, I began experimenting with leaving a core long or short position in place while placing short-term or intra-day trades.  The jury is still out on the effectiveness of this strategy.

  • Crab Dip

    I spent most of the weekend on fund business, charting and updating performance (posting shortly), so there are still a few of you waiting for answers on whether your annual memberships are charter or not.  My apologies for not getting to that, but I’m postponing any fee increases until I have time to research that — hopefully in the next day or two.

    A reminder to everyone else, purchasing a charter annual membership now locks in your subscription price for the life of the site and entitles you to fee rebates and discounts (available only to annual members) on a fund that’s in the works.  To sign up now, click on the link below.

    Sign me up!

    *  *  *  *  *  *  *  *

    ORIGINAL POST:

    Back on Jan 23, after the Sep 14, 2012 high of 1474.51 was exceeded, a post [HERE] asked “now what?”  We turned to harmonics for the answer, eyeing two prominent potential Crab Patterns:

    My leading harmonic forecast is for 1509-1515.  I can’t imagine getting this close to 1500 and not snagging it for the trophy case.  And, I like the idea of dancing with the harmonic patterns what brung us.

    My secondary goal is slightly higher at 1553-1555, so there should be opportunities to jump back in and capture most of any upside above 1520 if/when appropriate.  Such a move would likely follow a reversal from 1509-1515 back down to 1474ish and would constitute a fifth wave rather than the ending diagonal suggested above.

    The Fibonacci levels mentioned above can be seen on a chart posted a few days earlier [CIW: Feb 19] discussing the likelihood of a measured move to 1551.12.

    On the chart above, the distance from (2) to (3) is 207.77.  Adding 207.77 to the 1343.35 low (4) yields 1551.12 – right there with those 1.618 Crab Pattern completion points. If SPX can break through 1530.58, there are no other Fib levels between there and 1553.

    Remember, 1472 constituted a Fibonacci 88.6% retracement of the 1576 – 666 drop and completed a 5-year, 800-point Bat Pattern, prompting a decision to short the S&P 500 at 1474 [See: World According to Ben.]  The ensuing 9% drop translated into a 25% return.  And, we’d racked up another 14% on the rebound from 1343.

    Above 1474, though, was the especially tricky part of harmonics: the price range between the .886 retracement and the 1.000  (a double-top.) It was tough being bullish in the face of the sequester (and all the other usual threats to the future of the human race.)

    So, we hedged our bets (often quite literally) by making the market prove to us it had additional upside for each new leg up.  I often hazarded long positions only intra-day, sometimes while holding a core short position.  It made for a lot of trading, but I didn’t trust the market’s seeming invincibility.

    But, the market proved itself, busting two normally very reliable H&S patterns, threatening a well-formed rising wedge, constructing a very unusual channel and ignoring a whole slew of economic troubles along the way.

    And, here we are.  Friday’s close at 1551.18, a whole 6 cents above the measured move target of 1551.12, leaves SPX only a few points shy of the last major harmonic targets at 1553.39 and 1555.57.  It’s close enough for the patterns to be considered completed.

    I’ll take one last stab at 1553/1555 if the .25 purple channel line here at 1548 can hold, but let’s be very cautious (tight trailing stops) with this move.  As Friday’s post title suggests, being long at this point is tantamount to the proverbial “picking up pennies in front of a bulldozer.”

    The above chart is quite messy, but note the two 161.8 Crab Completions at 1553.39 (red) and 1555.57 (yellow), the IH&S target at 1565 (yellow) and the small white Crab Pattern 1.618 at 1559.32.  Any of these would do as far as the upside goes, with preference being for the 1553/1555 level given the patterns’ prominence.


    UPDATE: 12:18 PM

    We’ve almost completed the larger Crab Pattern at 1553.39, the 1.618 extension of the May – Oct 2011 decline from 1370.58 to 1074.44.  It’s possible we’ll sneak a little higher to tag the other 1.618 at 1555.57 — the pattern derived from the 1474 – 1343 sell off last fall.

    But, I’m happy booking the 5 points from this morning’s longs and re-shorting here at 1553.29 … and, waiting to see whether the market can push higher.

    I’d leave stops a little loose to account for the possibility of the higher Crab Pattern completion — perhaps 1561 or so.  I might also risk an intra-day long if SPX pushes beyond 1554.

    It’s backed off a bit in the past 10 minutes, but daily RSI just reached 70 and, more importantly, tagged a trend line off the two previous highs.  I don’t believe the channel drawn below will hold, but the upper bound/TL drawn is compelling — especially on negative divergence.

    Also, though we haven’t looked at VIX (below 12!) much lately, it’s worth noting that its daily RSI just tagged the bottom of a well-defined channel.

    Not many investors watch or even care about harmonic patterns or RSI channels.  So, it’s not unusual to feel quite isolated, even vulnerable, when trading at the turning points they suggest.  All I can suggest is: (1) turn off CNBC; (2) don’t tally your profits just yet; and, (3) let a few very close friends and relatives know what you’re doing.

    Sure, the pattern could always bust (about 30% do…make sure you tell your friend that, too) and you’ll be the laughing stock.  But, trust me, it’s better than running into a friend who just lost thousands in the market and wonders why you didn’t say anything…

    The 15-min RSI channel we were watching on SPX Friday is shaping up nicely, but does show the potential for a few points higher.

    One last push back up to the white price channel mid line could reach 1559.32 if it started right away.

    Coming up, a review of the downside case and likely targets.  Continued for members(more…)

  • Picking up Pennies

    Just about every other index has reached an important harmonic and/or chart pattern target. Given the NFP print, this could be the day SPX finally reaches 1553-1555.  Best to be long on the opening, and ready to re-short fairly quickly.

    The dollar isn’t waiting, surging nearly 1% on the day and resolving the question as to which channel to watch.

    DX is very near a tag of the red .786 (83.064) and the purple 1.618 (83.179).  But, more importantly, it is coming up to the intersection of the midlines of two important channels.

    Look for heavy resistance at these levels — until the equity sell-off begins in earnest.

    Likewise, the EURUSD is off over 1% and approaching the white .786/yellow .500 — also the scene of an important channel line.

    Will the currencies react first to the equity strength, or are they positioning ahead of what they know will be an equity pop and drop?  As the grown-ups in the room, I believe currencies are doing the latter.

    Our premise called for a back test of the channel line or TL off the July 2011 & Sep 2012 highs, but the market is eager to go ahead and get there.  Who am I to stand in the way?

    UPDATE:  9:35 AM

    Got to 1551.65, only 1.74 away from the white 1.618 – which is close enough for me.   I have nothing against staying in until the actual tag; just watch your stops in the event it turns quickly.

    I’ll pick it back up if we get a second push through 1551, as it would not be unusual to see a bit of an overshoot — somewhere between 1553 and 1560.  Likewise, a drop through the yellow TL down around 1535.50 probably signals “game over.”

    Remember, this completes a Crab Pattern from the 2011 crash from 1370 to 1074.  Are we guaranteed a big sell-off here?  Of course not.  But, odds are it will be substantial.

    UPDATE:  10:08 AM

    If SPX is going to bounce higher, it should do so by 1543 — the 1.272 Fib on the small white harmonic grid and the bottom of the tiny channel SPX hung out in for the past several days.  For anyone who missed the last six points because of the gap open, this is your second chance.

    UPDATE:  10:27 AM

    SPX getting the bounce here at 1543… will take another crack at 1553-1560.

    In the meantime, let’s take a look at how we got here.  If you had asked me at the end of 2011 which upside scenario looked most likely, I would have suggested the Crab Pattern that started at 1370 in May 2011 and put in a bottom at 1074 in October (in white, below.)

    There were three potential Point X’s in a row: 1370.58 on May 2 (in white above), 1347 on July 21 (in red) and 1356.48 on Jul 7 (not shown.)  And, 1370.58, the high following the 1576 to 666 sell off from 2007 to 2009, was the most prominent.

    My reservation was that it reversed at the .707 Fib level rather than the more common .618, .786 or .886.  The .707 is the red-headed stepchild of the Fibonacci ratios.  It’s the square root of .500, which itself doesn’t get much respect as a Fib ratio.  Geeks and wannabe’s CLICK HERE for details…

    When SPX finally pushed above 1370 in March 2012 and started approaching the 1.272 Fib levels between 1422 and 1451, we had to choose from among the three possibilities for a Butterfly Pattern completion [see: All the Pretty Butterflies.]

    I went with the red pattern because of its more precise tag on the .786 and was rewarded with 20%+ gains from a perfectly-timed short.  And, I assumed the red pattern would continue to drive future harmonic swings.

    As we approached the red 1.618 at 1515.24, I noted that it intersected with the purple 1.618 (1518.57) and the yellow 1.272 (1510.19) — not to mention the yellow trend line running very precisely through the July 2011, April 2012 and Sept 2012 highs.  To me, this was a very solid conclusion based on very reliable patterns.

    We got the sell-off.  In fact, we got three sell-offs, one from each of those Fib levels.  On the final tag at 1518.57, we got a little overshoot to 1530 (a smaller harmonic pattern completion) before beginning a correction all the way to…1485.  Yep, not even a lousy 3%.

    In harmonics, it’s not usually the tops that bother me, it’s the 2nd waves.  The rebound from 1485 went to 1525 (a healthy .886 retracement) and even sold off nicely — before zipping back up to complete an IH&S, take out the 1530 high and…well, here we are.

    Harmonics are great.  They offer concrete turning points at which the market usually reverses.  If it doesn’t, you’ve either picked the wrong Point X (1347 instead of 1370) or the wrong pattern.  In other words, there’s a solid decision matrix; you know when it’s time to go to Plan B.

    Fundamental analysis isn’t anywhere near as precise — especially in the short to medium term.  And, as we’ve seen this past year, there’s plenty of money to be made by going long at bottoms and short at tops.  You just have to be prepared to switch gears when your assumption — no matter how well thought out — turns out to be wrong.

    If SPX exceeds the Fibs at 1553/1555 and/or the IH&S target at 1465, there’s not much more in the way of targets other than the previous high of 1576 (October 2007.)  Many other indices have made new highs, so maybe TPTB will feel it necessary for SPX to do so as well.

    more later…

    UPDATE:  1:55 PM

    The bounce off 1543 still going strong.  15-min RSI just broke out of a falling channel from this morning’s rally.  A move back to the white RSI channel midline might permit 1553/1555 or slightly higher.

    continued for members(more…)