Posts

  • Charts I’m Watching: May 6, 2013

    The dollar continues to hover around the midline of the falling white channel within the rising purple channel.

    Closer up, we can see the short-run positive trend. But there are two harmonic interpretations that could play either way depending on how DX handles that midline.

    The ES has tagged the top of the purple channel from Nov 2012 at a 1.272.  Should see a reaction, but not really due until the 1.618.

    SPX closed right at the 1.272 on the small white grid on Friday.  Like ES, it’s not due a reversal as there was no .786 action to speak of.

    We’ll go long on the opening (1614.40), but be ready for any move back through the Fib level and/or white channel (1613.75ish.)

    A back test to the broken neckline (the purple oval), the broken purple channel midline or yellow trend line (yellow oval) is to be expected, but not absolutely necessary.   Rising channels have been showing extraordinary strength lately (e.g. the white channel within the red channel within the purple channel.)

    Interesting that the DJIA is off this morning, while SPX continues to try and power ahead.  Seeing the same on the Nikkei, which by my reckoning is due for a stout sell-off to at least 12,678 or 12,360.

    Note the yellow channel midline tag, the .618 and 1.618 tags. When that purple channel finally breaks, it should be substantial.

    SPX’s white channel will eventually break down — perhaps for 15 points or more — but in the absence of a catalyst, it’s prudent to wait for the actual breakdown rather than anticipate it.  There’s blue sky all the way to the .75 purple channel line (1622ish) and nothing else waiting there except for the 1.618 extension of the action since Friday (1621.93.)

    UPDATE:  10:50 AM

    Getting the break down finally?  We’d need a break not only of the white channel, but the .75 line of the red channel (about 1615.20) to be on the safe side.

    UPDATE:  10:55 AM

    There it goes… taking a short position here at 1615.15, tight stops around 1616.

    This is very likely a short-term play, not any kind of major move.  Such a move would require a decline through the red midline (currently 1608) and, then the purple midline (1606.)

    If it pushes below 1612.85, look for strong support between 1606-1609.65.

    UPDATE:  11:43 AM

    Stopped out.  Back to full long.

    This has the feel of a melt-up: no particular reason to tumble, and plenty of room to run.  I’m going to take advantage of the quiet session to do a little work on the medium-term forecast. For now, the near-term targets identified last week remain in place.

    Back later.

    UPDATE:  2:47 PM

    SPX is back-testing the neckline for a little H&S pattern that targets 1623.80.  It’s pushed just below the white midilne, but the red .75 offers support around 1617.55.

    UPDATE:  3:57 PM

    Saw a push through the red channel line at 1617.55.  The immediate downside looks to be about 1616.50, with additional exposure down the the targets mentioned this morning.  This is likely a shakeout rather than a reason to panic.

    I’ll continue working on the forecast this evening, and try to get it posted late tonight.

    GLTA.

  • Which Lie Did We Tell?

    Reading the employment reports these days reminds me of the story told by William Goldman, celebrated screenwriter of such classics as Butch Cassidy and the Sundance Kid and All the President’s Men.  He was waiting for a producer to get off the phone when the man suddenly cupped his hand over the phone and shouted to his assistant: “Bill, Bill!  Which lie did I tell?”

    When we learn that the government is unable to keep track of the number of its own employees from month to month, how are we supposed to trust that any other number that purports to tell us how many folks are employed in offices, warehouses and saloons across the nation?

    In the “bad news is good news” (more QE) and “good news is good news” world in which we’re living, this morning’s jobs report is — surprise! — good news.

    *  *  *  *  *  *  *  *

    We’re still long from yesterday’s low, but coming up on important resistance.  This morning will be about figuring out when to sell.  I suspect 1615-1616 would be nice.

    The dollar shot up on the news to an important channel line and the .618 retracement of its fall since Apr 24, but is dropping back.  How far it falls could be quite telling.

    Stay tuned.

    UPDATE:  9:42 AM

    SPX just hit 1616.16. I’m shorting here, with stops at 1618.  Charts in a minute…

    Note SPX just hit the top of the red channel within the broader purple channel, as well as the 1.272 Fib extension of the 1597-1536 drop from Apr 11-18.

    There are still a number of higher potential targets:

    • the top of the purple channel, currently around 1646
    • the IH&S target of 1650 (now that SPX finally crossed the neckline)
    • the white 1.618 extension at 1635.25

    But, odds are they’ll have to wait for a back test of the lines of important resistance just broken.  It’s not that the 1.272 Fib line is that important.  There was no meaningful .786 reversal, so this harmonic pattern is much more likely to extend to the 1.618 at 1635.

    This was our upside target if SPX was able to break through the resistance it just did.  And, we’re at an unusual point on the purple channel — the .625 line.  The .75 would be a much more common end point.

    UPDATE:  10:29 AM

    Looks like SPX is breaking out of the red channel, triggering our 1618 stop.  So we’ll switch back to the long side for a likely run up to 1624ish.  Stops at 1614ish.

    The red channel is drawn with the best fit on the interior points on the 15-min chart.  But, by the time you examine a channel on longer time frames, all those precise reversals at the channel lines pretty much disappear.  In other words, there’s always wiggle room.

    In fact, I’m going to switch back a short position here at 1618 just to protect against the possibility that wiggle room is at work here and the “break out” mentioned a moment ago is a false alarm.  If SPX pushes back up through the top of the red channel, I’d be content with an interim long position for a trip to 1624 rather than switching sides all together.


    UPDATE: 10:55 AM

    We’ve been talking about 1635 a lot lately.  There was Apr 29, when SPX came within one point of making a new high:

    On the other hand, if it dips below 1592 in the morning, it has downside risk to the channel bottom at 1576 [it hit 1581] where it would likely catch a bid and start a run to 1635.

    On Apr 25, when charting the IH&S (before it went circus freak on us) in Best Laid Plans:

    That way, the Inverted H&S Pattern would feature a neckline that’s roughly the same as the purple channel .25 line, and would target the same price level as the 1.618 extension of the 1597-1536 slide: 1635.

    But, my favorite reference was in July, 20 2011 in Ten Lousy Points, as we were about to nail the call-of-the-year thanks to our 2011 as 2007 analog:

    There was a Santa after all!  The Dow soared 205 points, the S&P; 500 over 21.  The next two days tacked on 13 more points.  At that point, SPX was just 10 lousy points from completing an inverse head & shoulders pattern that might have sent it up 125 points to 1635.

    We all know the rest of the story.  Suffice it to say there were a lot of hangovers those next few weeks that had nothing to do with New Year celebrations.  SPX dropped 120 points in 2 weeks, 230 points in 4 weeks and 750 points by the following Christmas.

    There’s no real connection, of course.  After topping the 2000 high, SPX had just missed — by 30 points — completing an Inverted Head & Shoulders Pattern (in purple, below) that would have targeted around 1670.  Note that 1670 was also the 1.618 extension of the Crab Pattern that was in the works (also in purple.)

    But, all was not lost.  After peaking at 1576, SPX went on to construct another IH&S that looked promising.  If it completed, it would have targeted 1635 — indicated by the dashed yellow horizontal line.

    It came within 10 points on Dec 26, but couldn’t quite close the deal.  As I wrote in July 2011, the rest was history.  That 1635 IH&S target would have to wait…until now.

     *  *  *  *  *  *  *  *

    BTW, I’ve extended and expanded the current membership offer through the end of the weekend.  Charter Annual memberships at $1,200 fix your subscription price for the life of the site.   Annual memberships are slated to increase to $1,800 when this deal is done and $2,500 when the upcoming fund is launched.   Click HERE to sign up.

      *  *  *  *  *  *  *  *

    UPDATE:  2:40 PM

    So far, 1618.46 has held as the daily high.  We’re seeing a little more movement, back down to the 1.272 Fib and below that gray channel line.  We’ll take a look at near-term and ultimate targets in a moment.

    First, a quick look around at other indices which, for the most part, are flashing at least “interim highs” indicators.

    COMP nailed the middle most 1.618 of the three nestled close together between 3343 and 3435.  This is the extension of the drop from 3134 to 2726 in Mar – June 2012 — the equivalent of the 1422 – 1266 drop in SPX (which exceeded its 1.618 way back at 1553.)

    RUT hit an important trend line dating back to August 2008, but appears to have potential to 969 and then 988 — call it 1000 — based on Harmonic charts.

    The DJIA has reached one 2.24 extension (13,338 – 12, 035 from Apr-Jun 2012) but has stopped just short of the more recent one created by the Sep-Nov 2012 downturn at 15,137.

    As for SPX itself, it’s a little early to speculate.  The 1.272 at 1614 could provide a floor.  But, I suspect the immediate risk is to 1609 or 1603 by the end of today’s session.

    We’ll discuss the most likely scenarios below.

    continued for members(more…)

  • Charts I’m Watching: May 2, 2013

    We open this morning with the RUT, which appears for all the world in freefall.

    Note that this plunge, if it continues, will complete a rather nasty H&S Pattern around 900 that targets 840.

    Which would put it in the neighborhood of the bottom of a rising wedge and the .618 of its leg up from 765.

    Initial claims were off 18,000 rather than up slightly.  And, the ECB, as expected, lowered interest rates by .25% — which will goose the markets a bit.

    Will it be a lasting pop, or pop and drop?  We’re not really supposed to care.  Let’s hold our noses and jump in.

    Taking a spin around the currencies…  DX has had an interesting reaction to something supposedly so bullish…

    And, the EURUSD isn’t exactly signalling a rally:

    The AUDUSD, which we haven’t looked at lately, is on the edge of a cliff.  Recall that it completed its yellow Crab Pattern a long time ago.  It’s now pondering the white Crab Pattern to the 1.618.

    But, it’s formed a triangle (yellow, dotted) that dates back to 2010…

    That really looks like it should break to the downside — almost certainly breaking 1.00.

    And, our old friend the USDJPY… looks like the bounce may be fizzling — if not downright reversing.

    In short, the rest of the world continues to signal a downdraft in stocks.  But, SPX is soaring.

    We closed the short position that we adopted on the opening yesterday at the close for a small profit — even though it didn’t quite reach our 1580 target.  I was worried that the ECB rate cut and predictable initial claims report would do…well, exactly what they have done.

    We can assume that SPX intends to tag 1600 in the mix of everything.   Could it happen?  Sure, if certain things fall into place.  Maybe even a little bit higher…

    continued for members(more…)

  • Charts I’m Watching: May 1, 2013

    Playing the downside this morning, as the dollar has reached an important Fib target.

    But, watch for SPX to rebound at the bottom of its rising wedge — around 1590.72, which is also the .618 of the latest wave up.

    For those playing the bounce in gold, DX bottoming here means GC has probably topped out.  I’d switch back to short with relatively tight stops, targeting the previous lows and ultimately 1155.

    UPDATE:  9:40 AM

    Just hit 1591.48 – not quite the .618 but a direct hit on the bottom of the wedge.  Switching back to the long side with stops at 1590ish.

    But wait, you say, what about the dollar’s rebound?  Glad you asked.  It was a tag on the 1.272, and since we saw a reversal a little higher at the .786 it’s a legit Butterfly Pattern.

    However, note that in reaching the 1.272, DX broke down from the purple channel that’s guided it higher since January.  As such, the 1.272 is unlikely to stop the decline.  Look to the 1.618 at 80.825 — also the scene of the red .618, white .500 and purple .382 — which would make it an equally legit Crab Pattern.

    That additional drop should be enough to help equities make the next push higher we discussed late yesterday.

    UPDATE: 10:15 AM

    Just got stopped out of the long position so switching to short for the .886 at 1587.76.  Stops at 1590ish again.  Charts in a few.

    UPDATE:  10:20 PM

    Close enough.  Back to the long side here, with stops around the 1587 channel line.

    UPDATE:  10:45 AM

    Decent rebound so far.  Should be out of the woods, but keep those stops where you’re comfortable.  A break below 1587 would likely mean a downdraft to 1580 or lower.  I’ll set stops there.

    Next resistance on the upside, the TL from the 2000 & 2007 tops – the dashed red line at about 1593.40.

    BTW, we’re conditioned to think that a push lower such as we had this morning is bearish — a reminder of the risk in holding stocks.  But, from a technical standpoint, that’s often not the case.

    Note that the little rising wedge we were watching this morning (yellow, dotted) featured an apex around 1604 on Friday.  In essence, it limits the upside and the time in which to reach it.

    If the 1587.86 low SPX just made holds, the new rising wedge apex is much further out in the future — and, at higher prices.

    RSI also gets reset with a move lower like this, clearing the way for more upside — if it’s in the cards.

    Even a move down to 1580 leaves a nice channel to the upside in place.  Just means it would take a little longer to get there.

    UPDATE:  1:00 PM

    A break through 1587 and we’re short again…

    UPDATE:  1:11 PM

    Somehow, in this “random walk” down Wall Street, the marvelously efficient and unfettered SPX managed to stop one nickel above yesterday’s low of 1586.50.  Since that was a 55%ish retracement of the 1577 – 1597 rise, a Bat Pattern is a good possibility.

    If so, the .886 is down at 1579.84.  Note that this is also roughly the level of the 1.618 extension of the 1586 – 1597 rise — hence my earlier note that a drop through 1586 would likely result in 1580 or lower.

    If, by some miracle, 1586.50 holds, then this is a very deep retracement of the last move up.  But, that’s looking less likely by the minute…

    The FOMC announcement is coming up at 2PM ET.  The market’s acting like it knows something bad is coming…

    Remember, 1586.50 is the key level.  First support after that is the .618 of the 1577-1597 rally at 1585.20. So, use stops judiciously.

    UPDATE:  1:40 PM

    Just broke through 1586.50 and then some.  The .618 coming up…

    After that, the .786 at 1581.84 and the .886 at 1579.84.  The .886 is the one that lines up with the most significant support: the .25 line of the purple channel from 1343.

    UPDATE:  1:52 PM

    Have to try a long position here at 1585 – the .618 — just in case.  Stops at 1584.50.  The FOMC coming up in just a few minutes…


    I can’t imagine the Fed tightening in any way today. So, I continue to see this as a corrective wave in an overall move higher. But, we’ll always play along on the short side as long as they want to play that game…

    UPDATE:  2:00 PM

    No change.  Downside?  Just kidding.

    Hmm… fiscal policy constraining growth.  Continues to see downside risk.  Could increase or reduce QE.  One dissenting vote… Esther.

    UPDATE:  2:20 PM

    SPX broke out of the little falling channel and is back-testing the broken yellow TL.  As before, a push through the last low (1584.70) opens up 1580.  Trailing stops are a great idea.

    I’ll post an update asap, but have to grab a conf call first.

    UPDATE:  3:15 PM

    SPX just pushed below 1584.70.  Back to the short side targeting 1580, with stops at 1586ish.

    UPDATE:  3:45 PM

    Just tagged the .786.  It should head lower to our 1580 target, but I’ll take an interim long position for the bounce, stops at the 1582 entry.  Core short still in place.  Charts in a few…

    UPDATE: 3:55 PM

    Going to cash at the close.  I suspect we’ll drop to 1579ish either in the closing minutes or in the morning, but either way it’s not worth the risk of the overnight position.

    Charts in a few…

  • Breakout or Breakdown?

    NOTE: Protect yourself from future price increases. I am again offering charter annual memberships that lock in your current annual membership price ($1,200) for the life of the site to the next 20 subscribers or until May 1, whichever comes first. Afterwards, annual memberships are slated to increase to $1,800, followed by a final increase to $2,500 when the fund launches. For details, click HERE. Or, to sign up, click HERE.

    *  *  *  *  *  *  *  *

    I’m closing my long position position and going short this morning. If SPX can break above the key levels we discussed yesterday afternoon, I’ll change my stance.

    As I discussed last night in Trading for Fun & Profits, the market is at another critical turning point.  After topping many levels of resistance, SPX is nearing some of the most important.  A break above can usher in much higher prices, while a reversal here could do a lot of damage.

    It’s no wonder that the market has bounced back and forth in a fairly tight trading range for the past week.  We’re likely to see more whipsawing over the next couple of days.  So, those who like to remain above the fray could wait for a break above 1603 or below 1580 and not miss too much of the action.

    The dollar should base here between 81.920 and 81.956.  81.67 is the key level to hold.

    The EURUSD has a little more harmonic upside potential, but that channel line could prove problematic.

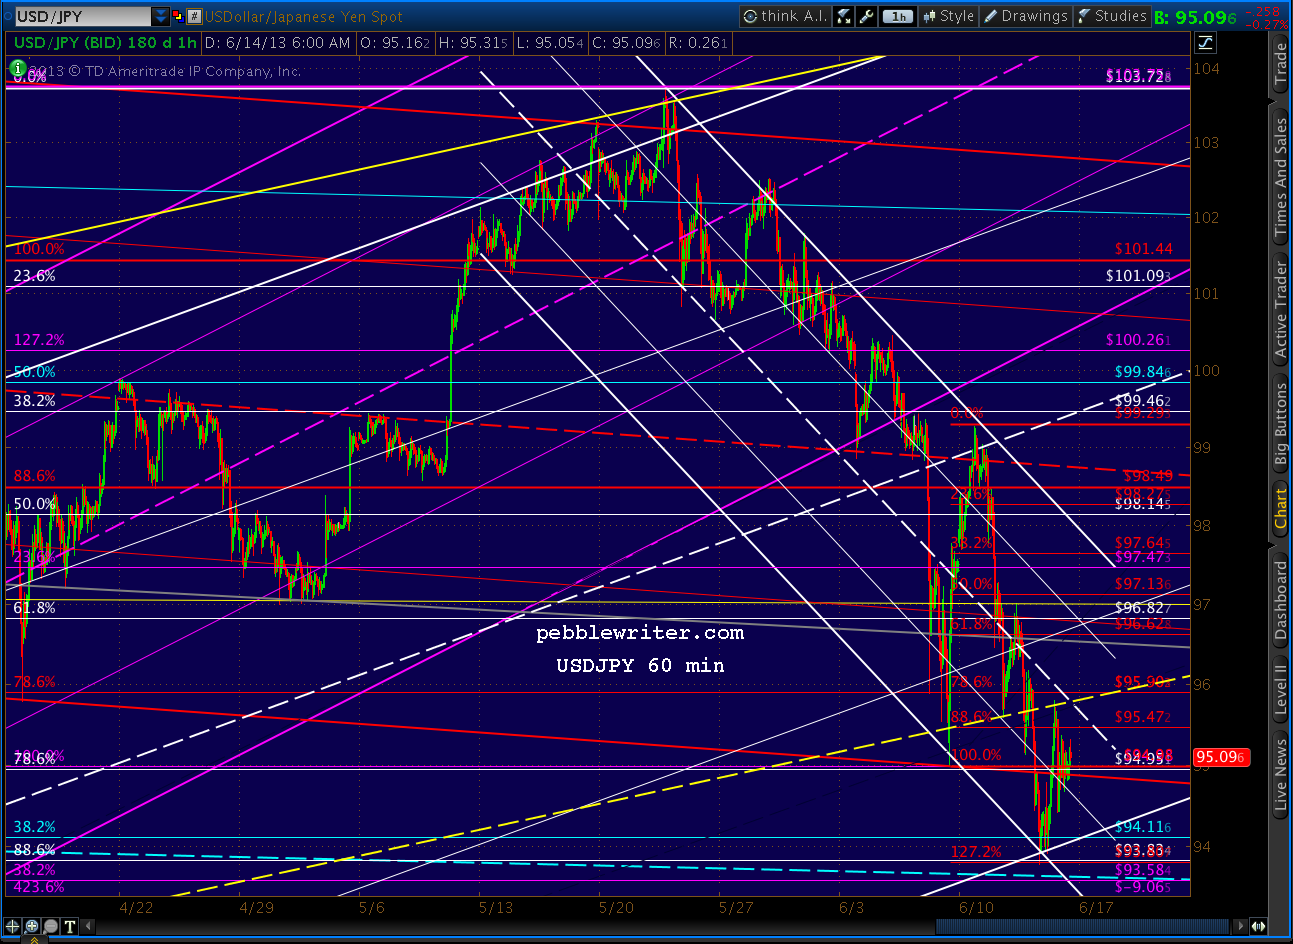
    USDJPY continues to have downside risk to the bottom of the purple channel.  It intersects with the white midline around the .618 of 95.47.

    UPDATE:  10:30 AM

    AAPL is getting a lot of attention for its “breakout.”  Recall when we last charted AAPL [see: Is It Safe?] on April 19, we noted the presence of a channel line that should support a rebound.

    “the chart patterns and the harmonic patterns that suggest AAPL is due for a substantial bounce.  Whether it turns into something more than that will depend on whether it break free of the falling channel from hell…  AAPL should find support at the .75 line of the white channel around 380-385.”

    I was a little off, as the actual bottom was 385.10.  But, it’s back to that channel bound discussed and is thinking about breaking free.  Unfortunately, it’s also reached a .618 Fib line that could spoil all the fun.

    It needs to close above 437.54 in order to be considered safely out of the woods.  In fact, a failure and close below 429.70 would be quite negative – at least in the short run.

    UPDATE:  10:40 AM

    SPX is getting a bounce off its lows of this morning. It should run its course by 1592.  Any higher would be cause for considering switching sides.

    UPDATE:  11:00 AM

    An update on the bounce…

    I’m taking an interim long position here, stops at 1591ish.   Key level = 1593.47 — the 2000-2007 TL (red, dashed.)

    more in a few

    UPDATE:  11:50 AM

    SPX just moved back through the long term TL mentioned above, so I’ll close my short position and play the upside. This leaves us full long at the moment, though this could obviously still break either way.

    The IH&S neckline is currently up at 1599.63, and the channel midline is around 1598.26.  Look for a backtest of the broken TL.

    For anyone who doesn’t enjoy being caught here in the surf zone (does anyone?) here are the approximate key levels to watch:

    • TL (red, dashed) from 2000 and 2007 tops: 1593.44
    • previous high: 1597.35
    • purple channel midline: 1597.48
    • the neckline of the almost completed IHS (yellow) at 1599.82
    • TL (yellow, dashed) from 1994 and 2003 lows: 1600.22

    It was that last TL that stopped SPX on the 11th, so that’s the most important.  Topping it means exceeding the other three, so it’s obviously bullish.

    And, as we discussed late yesterday, the failure to tag the IH&S neckline  — now at 1599.82 — could be quite significant.

    If the current backtest of the red 2000-2007 TL holds at 1593.40 or so, there’s another little IH&S waiting to complete at 1595.75 that targets 1604.53.

    But, there’s a significant point of confusion coming up that I’m sure the market makers will take advantage of.

    continued for members(more…)

  • Trading for Fun & Profits

    NOTE:  Protect yourself from future price increases.  I am again offering charter annual memberships that lock in your current annual membership price ($1,200) for the life of the site to the next 20 subscribers or until May 1, whichever comes first.  Afterwards, annual memberships are slated to increase to $1,800, followed by a final increase to $2,500 when the fund launches.  For details, click HERE.

     *   *   *   *   *   *   *   *

    I received an email from a prospective subscriber over the weekend who had a modest amount of money to invest and wanted to know how to use pebblewriter.com to invest in options — a field in which he hadn’t much experience.  He described himself as a passive participant who isn’t particularly interested in playing intra-day moves.

    First, let me congratulate this gentleman for asking the right questions.  Even the most experienced among us started out as a newb. I can, unfortunately, recall many times when I wish I had taken the opportunity to ask more questions before plunging in.  Experience is a great teacher, but it can be an expensive lesson.

    Second, his question made me think: what is the best way to use this site?  We’ve had a great run so far [see: RESULTS.] Given the way it has evolved and the way the market is moving these days, do options even make sense?  If not, then what?  And, how?

    OPTIONS

    I’ve traded options on and off for over 30 years.  I’ve enjoyed some unbelievably great trades, and I’ve had some real stinkers.  In a strongly trending market where we’re going to make a big move one way or the other, they can be a lot of fun.  When the market moves against you and you’re running out of time, it’s like being strapped to the front of a runaway locomotive that’s about to T-bone a nuclear power plant.

    I’ve pretty much decided that unless someone has the time, experience and resources to become expert at options trading, it’s really best to stay away with any serious money — at least with directional trades.

    There are all sorts of strategies that can mitigate risk, but buying at- or out-of-the-money calls and puts in the hopes of the market moving in the right direction, by the right amount and in the right time frame is like tossing your money up in the air and hoping more of it falls back down.

    I can’t count the number of times I got direction and price right, but the move I expected didn’t happen until the Monday after expiration.  I’ve seen many very smart people get hosed in this and countless other ways.  Bottom line, unless you’re brilliant, rich, experienced and have great trade management skills, I can’t recommend them.

    EQUITY STRATEGIES

    So, how might someone use the information on this site to make money in the markets?  If you can stay on the right side of the markets most of the time — long when it’s going up and short when it’s falling — then it turns out you can make some decent dough.

    Many investors use an ETF such as SPY or the eminis to establish a long or short position.  This is easiest for those who have the time to watch the markets during the day and respond relatively quickly to trade signals which, like the markets, can be unpredictable.

    There’s no way for me to know whether our 2nd year will also produce an average of 10% per month.  But, at even half that, I’m a very happy camper.  At a quarter, we’d still be way ahead of the pack.  As such, I see no particular benefit to using leverage.

    In a vibrant and trending market, I love nothing more than raising all the sails and running before the wind.  But, this can be unproductive — or even dangerous — in gusty, shifting winds.  Then, I try to be a little more cautious.

    It was smooth sailing from March to May 2012.  We earned almost 25% during SPX’s 11% drop from 1422 to 1266 with a minimum of effort — a nice payoff for the new pebblewriter.com just getting under way.

    Even the whipsawing rebound from the June lows to the September high wasn’t too bad.  We had a big harmonic pattern to complete at the Sep 14 high of 1474, which was the 88.6% retracement of the 1576 – 666 crash.  It provided a great target and we were able to generate another 36% on a 16% move in the underlying.

    The decline to 1343 over the next two months, once it got going, was fruitful — earning us 25% on the 9% decline.  But, thanks to the unusual structure, it took 44 trades to get it.  The rebound over the following month was much easier, earning 14% versus SPX’s  7%.  Then, sadly, our analog crapped out around the end of the year.

    The following months were painful.  Once a harmonic retracement exceeds the .886, there are oodles of possibilities: a slight throwover, a double-top, a 1.272, or a 1.618 extension.   What’s worse, we had conflicting signals — with two major Crab Patterns calling for a 1553-1555 top, only 20 points below the 2007 high of 1576.

    We spent much of January through March trying on different scenarios for size, waiting for a trend to emerge.  It came in the form of a five month, 260-pt narrow channel whose biggest correction was about 50 points.  It blew through several important Harmonic targets, Head & Shoulders Patterns, and pretty much everything else the bears could throw at it.

    In the end, we did well enough — scoring 23% in the first quarter versus the S&P’s 13%.  But, it’s been a heck of a lot of work — much of it feeling like we were lost in the reeds.  I have used tighter stops, gone to cash more often overnight and weekends, and looked for opportunities to pick up 5-10 points on an intra-day basis.

    THE CHALLENGE

    But, the volume and sometimes conflicting nature of more short-term trades can make them hard to track (e.g. are we taking an interim long position in addition to our core short, or a short-term long trade in expectation of re-shorting?)

    I created a new page to help folks keep track of the big picture: Current Position.  But, there have been many times when a perfectly good chart pattern busted or didn’t play out as expected, and even the big picture or “core” trade got stopped out.

    One long-time subscriber suggested color-coding transactions, and I’m trying to figure out whether it might work.  My concern is that the nature of positions sometimes changes. For example: SPX closed at 1593 today.  My current expectation is that if it exceeds 1596, it has potential to 1602.  If it tops that, 1635 is on the table, etc. etc…

    On the other hand, if it dips below 1592 in the morning, it has downside risk to the channel bottom at 1576 where it would likely catch a bid and start a run to 1635.  But, if it fell through the channel bottom, though, look out 1500.

    I’m not sure how to even begin to characterize those scenarios as long-term or short-term, much less color-code them — as much as I  would like to.  And, then there’s the question of you, my faithful subscribers.  Are you a swing trader?  A day trader?  Maybe the buy-and-hold type?  What’s short-term for a swing trader can seem like an eternity to a scalper.

    BE THE SOLUTION

    What I’m best at is figuring out where the market is likely to be.  Sometimes,  I can see very substantial moves weeks or even months ahead.  For example, we positively nailed the July-August 2011 crash, the Apr – June 2012 correction, the June – Sep 2012 rally and the Sep – Nov 2012 correction.

    But, sometimes, the long-term picture is as clear as mud — especially at key inflection points such as right now.  I can make a very good case for a sharp pullback to SPX 1497, and nearly as good a case for 1823.

    Those who can take this information and adapt it to fit their circumstances (objectives, resources, liquidity, risk tolerance, etc.) in a timely manner will do well as long as I can keep feeding you good information.  It will mean staying pretty active during choppy, directionless markets, and less so in trending markets.

    But, the onus is on subscribers to take the time to determine whether the scenarios I foresee unfolding are compatible with their needs and objectives.  I’ll always do the best I can to provide a sense of the big picture.  But, there will be times when we are “lost in the reeds” and alerts come more frequently — requiring more effort on the part of subscribers.

    It’s not possible to repeat everything going on in a cumulative fashion. So, important tidbits discussed yesterday might or might not make into today’s post.  Therefore, it will be much easier to stay up with what’s going on if you take the time to read each post.

    Those who don’t have the time or the energy to follow along might find the idea of a managed fund more appealing.  Or, you might check in whenever able — knowing that catching some of the moves some of the time is better than waiting for Cramer’s next brainstorm.

    A month ago, many of you were kind enough to fill out questionnaires that we sent out.  I’ve read each and every one from top to bottom, and there are some great ideas amongst the  feedback.  I’ll be working to incorporate as many ideas as possible as we move ahead.

    In the meantime, please don’t hesitate to drop me a line with your thoughts.  I don’t always have time to respond immediately, but I read everything that comes my way.

    Good luck to all.


  • Charts I’m Watching: Apr 29, 2013

    The dollar continues to settle, and is currently below the purple channel bound.  DX tagged the .786 of its rally from Apr 16, so should reverse from there or, alternatively, the .886 at 81.956.

    The USDJPY, which fell through the purple midline last week, reached the .618 of its last leg up and is likely to rebound to backtest the purple midline before correcting any further.

    SPX needs to reach about 1596 to complete the latest IH&S in the works.

    We’ll play along on the upside at the opening, but beware of the upcoming Fib levels.

    UPDATE:  9:35 AM

    The opening surge took SPX above the red .618 of the move down from the latest tag of the TL from the 2000 and 2007 highs (red, dashed below.)

    If SPX can maintain any downside momentum, that could suffice as a corrective wave.  But, there’s no operative falling channel at the moment, so not much evidence to support that idea.

    I’m inclined to let it run, but maintain stops near our entry point just in case.

    Remember, SPX bulled its way back into the broken purple channel on the 23rd — an unusual occurrence with bullish overtones.  It damaged, and probably destroyed, the traditional H&S pattern (in red, above) that was setting up.

    I’ll continue to believe in the ability of the TL from the 2000 and 2007 highs to limit the upside until proven wrong.  But, the inability of the bears to seal the deal with that H&S is disturbing to the downside case.

    Looking at the white harmonic grid above, the upside goal is obvious.  But, it means breaking through that TL in what appears to be an already overextended market.  The bulls shot themselves in the foot with the push above 1573.  The yellow IH&S would have been much more believable if we’d seen a reversal to the bottom of the purple channel there.

    Now, we’re looking at an insanely steep neckline that doesn’t exactly inspire confidence.  Given the mixed signals, we don’t have much choice but to continue playing the swings — at least until there’s some sort of breakout or breakdown.

    The next one is coming up at 1590.92 — the .886 of the drop from 1592.64 and roughly a tag of the purple .25 channel line.

    UPDATE:  10:25 AM

    That’s the .886, and the channel line.  I’ll close the long here at 1591 and revert to short, but with stops at 1593ish just in case there’s something bigger in the works.

    UPDATE:  12:05 PM

    SPX just tagged the TL (red, dashed) connecting the 2000 and 2007 highs.  From a harmonic standpoint, this is bullish.  But, this TL — which was only broken intra-day on the 11th — is technically very important.  A sustained push through 1593.50 and I’d say we’re heading up to at least 1596-1601.  But, I wouldn’t abandon my shorts until that point.

    Note that we’ve now tagged the purple channel line, rather than merely coming very close as we did earlier this morning.

    UPDATE:  12:25 PM

    That didn’t take long.  We’re pushing on through 1593.50, so I’ll take an interim long position here and ride it up.  Targets and implications coming in a few…

    continued for members(more…)

  • While You Were Sleeping

    Another disappointing GDP print, and the markets seem to be reacting with a shrug.

    Look closer, though, and it’s apparent the markets are teetering.  Many currencies and equities reached the point where they should correct yesterday, and now appear to be tipping over the edge.

    The magnitude of the correction is still a question, but it should start either today or Monday — as long as central bankers don’t do anything to upset the bears’ apple cart.  But, they wouldn’t do that, right?

    In one of the more disturbing videos I’ve seen in a while, Goldman Sachs Jim O’Neill came on CNBC [watch HERE] and said he thought it was just great that 23% of central bankers recently surveyed were either buying stocks with their reserves or will be soon.

    The top reasons given include diversification and yields on government bonds that are too low.  One fellow interviewed for the Bloomberg article remarked that it was a “very logical move” given that stock dividends [at 2.2%] were higher than bond yields [1.69%.]

    I could devote today’s entire post to the idiocy of this train of thought.  Thankfully, 70% of central bankers agree with me and still consider investing in equities “beyond the pale.” But, many of these same bankers probably never thought they’d be locked in a defacto currency war, printing currency non-stop to “stimulate” their economies.

    Global central bank currency reserves currently total about $11 trillion.  This compares to the S&P 500’s market cap of $13 trillion, or the DJIA’s of $4.3 trillion.  But, of course, a market can be stabilized with the timely purchase of a handful of key components, as we have seen many times when the Plunge Protection Team swings into action.

    While many have characterized the PPT as the imaginings of the tin foil hat-wearing fringe, it’s easier to accept the concept and envision the construct given these survey results.  This survey merely brings one element out of the shadows and into the light.

    If central banks feel free to buy stocks, is it much of a leap to think they might time those purchases to “help” the markets in times of need?  I don’t think it’s a leap at all; it’s more of a foregone conclusion.  But, the terms and mechanisms used obscure what’s really going on.

    The Bloomberg article points out the Fed and the Bank of England have “no mandate to buy stocks directly” — which is a little different from saying they have no hand whatsoever in buying stocks.  By providing virtually unlimited and free cash directly and indirectly to banks — the Fed most certainly supports stocks.

    For example, when Goldman Sachs — which in 2012 had $47 trillion in derivatives exposure against $20 billion in tier one capital — sees a swap going against them, they can tap their rich uncle for a low interest loan to help prop up the underlying [see: The Wipeout Ratio.]  We frequently see this in the futures markets — especially overnight in what are known as “ramp jobs.”

    Some might wonder whether a caring and benevolent government that steps in to avoid market meltdowns is such a bad thing.  We want our banks, insurance companies, pension plans and trading partners to stay solvent, right?

    There’s no question that we do.  But, stock prices are supposed to be driven by the “free hand” of the market, where values are driven by widely divergent views on opportunity and risk.  Should participants come to believe there is no longer any risk, prices will move even further out of line with the fundamental drivers of value.

    When inevitable black swan events come along (an earthquake, a Lehman, an AIG, a sovereign downgrading, a tweet, etc.) they could overwhelm the support structure in place, triggering an even bigger financial calamity than would have taken place in a normalized market.

    And, what about the misallocation of capital?  Why should banks, which can and do play the markets with all that free cash, risk even a penny of it on your new consulting firm or dry cleaning business — especially when the government is backstopping their trading activities?

    Ben Bernanke has been quoted as saying:

    “I want to be very, very clear: too big to fail is one of the biggest problems we face in this country, and we must take action to eliminate too big to fail.”

    That quote was taken from his 2009 Time Magazine’s Man of the Year interview, and the problem is even worse now than it was then.

    If we believe the market is rigged, or a casino, or has lost touch with reality…should we stay away?  I believe there is ample opportunity for those who understand how the game is being played to profit from it.  The analysis I use to decide when to go long or short is exactly the same analysis I would use if the PPT hired me to alert them to potential dangers.

    We’ve all heard the axiom “the trend is your friend.”  But, what about market reversals that lead to 10-20% downdrafts?  Much of my work is dedicated to finding inflection points where markets are poised to reverse.  Rather than riding them out, we are often able to position ourselves ahead of and capitalize on the coming move.

    Equally important, these inflection points provide a discreet price point with which we can determine if our outlook and current stance is correct.  Typically, if a pattern calls for a reversal at X but prices exceed X, I know what the next reversal point Y will be and whether to change from a long position to short, or vice versa.  This is infinitely harder to accomplish by studying a balance sheet.

    It doesn’t always work, and it’s rarely as easy as I’d like it to be, but it’s been fairly effective.  And, because I usually know when to pull the plug, I believe it really helps mitigate risk.

    So, rather than complain about the market being rigged (okay, I still do sometimes) I’ll devote my energy to understanding how it’s being run and how to profit from it — and, try to sock enough away just in case it all comes crashing down.

    *  *  *  *  *  *  *  *

    We’ll start with developments in the currency markets last night…

    The USDJPY broke the trend line and Fib Fan line I charted yesterday – indicating a continued decline to at least the 96.25 level.

    The EURUSD has broken beneath the channel yet again, but is backtesting it from below this time.

    And, the USD is finding support (a second time) at an important channel line.

    Yesterday, SPX reached our .786 target of 1584.23, then spurted higher to tag our alternate target of 1590.36.  We closed our long position and shorted @ 1584.80, then rode an interim long position up to 1590 where we closed it as well.  So, we’re short from about 1588, net.

    This isn’t the sort of market to let bears off easy, though. SPX ran up to 1592.64 — a nervous moment for those shorting into a rapidly rising market at 1590.  As I posted when SPX pushed through 1587:

    I wouldn’t start getting nervous about the short position until around 1594 — the trend line (red, dashed) that extends from the 2000 and 2007 peaks.

    Market makers watch Fib levels, too.  So, when we muppets take positions at important inflection points, they like to inflict just enough uncertainty to shake out weak players — those lacking the conviction to hang in there when their position is slightly underwater or who set tight stops at obvious levels.

    UPDATE:  1:05 PM

    SPX is off about 6 points, but seems to be catching some support here. It looks like backtest support, but we’ll keep an eye on the strength of the move.  We’ve technically come far enough to have a right shoulder to go with the left for the Inverted Head & Shoulders pattern we’ve been tracking.

    Any move back through the .786 at 1584.23 (now resistance) would represent more than just a backtest and would be cause to suspect the pattern is ready to complete.

    A close-up of the proposed falling channel…

    continued for members(more…)

  • XLF: Playing Catch Up

    On April 2, 2012, SPX completed a Butterfly Pattern at 1421 — the 1.272 extension of the July – October 2011 plunge.  It provided a great entry point for the fledgling pebblewriter.com’s first major short position.

    We scored over 20% in about 2 months [see: All the Pretty Butterflies] trading the 11% decline.

    XLF hadn’t done as well up to that point.   It had only retraced a Fibonacci 78.6% of its 2011 decline from 17.2 to 10.95.  So, no surprise that it sank by a whopping 18%.

    In response to a consulting client who was bottom-fishing for financials, I discovered they were probably bottoming in early June.  I posted my results in the appropriately titled:  So Crazy It Just Might Work.  If anything, my estimates were conservative.  XLF has soared 41% since that low (turns out it was the day before.)

    And, wouldn’t you know it, XLF has gone and formed its own Butterfly Pattern — just like SPX did in Apr 2012.

    continued for members(more…)

  • The Best Laid Plans

    The best laid plans of mice and men
    Go often awry,
    And leave us nothing but grief and pain,
    For promised joy!

    Robert Burns, 1785

    ORIGINAL POST:  6:45 AM EDT

    The wedges we’ve been watching on DX and EURUSD are playing out.  EURUSD has broken out…

    …and DX has broken down.

    But, it’s the USDJPY that I’m watching especially closely this morning.  It still hasn’t broken 100 since our Apr 8 observation [USDJPY update] that it was running out of steam:

    “…there is growing risk of a downturn as it approaches 100… it appears the pair might have hit at least interim resistance at today’s high.”

    It topped out 3 sessions later at 99.94, and two weeks later is in danger of a larger pullback.

    Remember, weakening the yen was a critical element of the BOJ’s stimulus program that was supposed to generate inflation, boost Toyota sales and send Japanese investment funds flooding into foreign markets.

    Instead, Japanese investors are repatriating their funds from abroad — a net Y9.5 trillion ($95 billion) since the first of the year.  Why?  As any US investor could tell you, QE might not inflate economies, but it sure as hell inflates markets.

    The Nikkei 225 is up 65% since last October’s lows….

    …and, still hasn’t even recovered 2/3 of its losses from the 2007 crash.  The Dow and the S&P 500, by contrast, have recovered all of them — and, then some.  So, to many, the Nikkei still seems the better value.  It’s hard to argue with success.

    But, I’ll do it anyway.  In reaching 14,020 a few hours ago, NKD tagged the .618 Fibonacci retracement of its 2007-2009 crash from 18,365 to 6990.

    To those not familiar with harmonics, this tends to be a big deal.  When SPX reached the equivalent point in April 2010, it plunged 17%.  The DJIA fell almost 15%.  The USD, represented by DX, soared 9.3%.

    But, the yen positively soared.  USDJPY started a 17-month slide that took the pair down 20% from 94.98 to 75.78.  NKD, which had just reached its .382 Fib, shed 23% over the next 4 months, eventually reaching almost 30% in Nov 2011.

    Could the USDJPY’s failure to break 100 be telling us something?  You better believe it.  I called a top a few weeks ago because the pair had reached several important Fib levels as well as the midline of an important channel (in yellow, below)…

    …that dates back to 1995.

    There’s no guarantee it won’t push through instead of retreating, but the RSI picture supports the danger of a significant retreat.

    Daily RSI has backtested the broken yellow channel twice, but the trend is clearly down — with the latest push being rebuffed by the purple midline.

    And, a close-up reveals that a breakdown has already started.

    Stay tuned.

    UPDATE:  9:25 AM EDT

    With SPX set to open 5-6 points higher, it stands a very good chance of reaching our 1584.23 target. In other words, a pop and drop is very much in the cards.

    If it goes any higher, look for 1590.36 instead.

    UPDATE:  9:40 AM

    That’s good enough for me.  I’m closing my long position and reverting to full short here at 1584.80.  Stops around 1586ish.

    The .25 of the purple channel is right around 1587, so I’d use some discretion around that stop level and look to see if there’s any real strength behind a move higher.

    UPDATE:  10:25

    Getting a push through 1587, so I’ll open an interim long position for what should be only a few points higher to the .886.  Core short remains in place.  Tight trailing stops.

    I wouldn’t start getting nervous about the short position until around 1594 — the trend line (red, dashed) that extends from the 2000 and 2007 peaks.

    UPDATE:  10:50 AM

    I’ll go ahead and close that interim long here at 1590.  While I still think there’s potential to the 2000-2007 trend line, it could easily happen after the correction that should begin in the next hour.

    That way, the Inverted H&S Pattern would feature a neckline that’s roughly the same as the purple channel .25 line, and would target the same price level as the 1.618 extension of the 1597-1536 slide: 1635.

    This is a very artfully crafted scenario to justify (from a technical standpoint) a rally above that red TL — which is one of the last remaining technical impediments to a continuation of the rally from 1343 in November.

    Can they pull it off?

    continued for members(more…)