

INITIAL POST: 9:20 AM
Between bank downgrades, the ADP report and a raft of bearish analogs floating around out there, it’s a tough day to buy the dip. But, that’s exactly what the charts, particularly a rather bullish analog, are telling us to do.
Look for the eminis to potentially tag the white .786 at 1782.63 and for SPX to bottom out at current levels (1785.91.)
continued for members…
A beautiful little analog I discovered late last night was nearly undone by the glowing ADP report that supposedly posed a threat to QE. As it is, it probably stretched out the payoff by just a few hours.
The comparison is of the dip and subsequent rise on the purple grid to the dip and probable rise on the red grid.
The purple dip of 25.1 points took 19 hours. The subsequent rise of 36.32 points took 39 hours — a 1.44X price extension and a 2X time extension. The final top was 4.39 higher than the 1.272 extension.
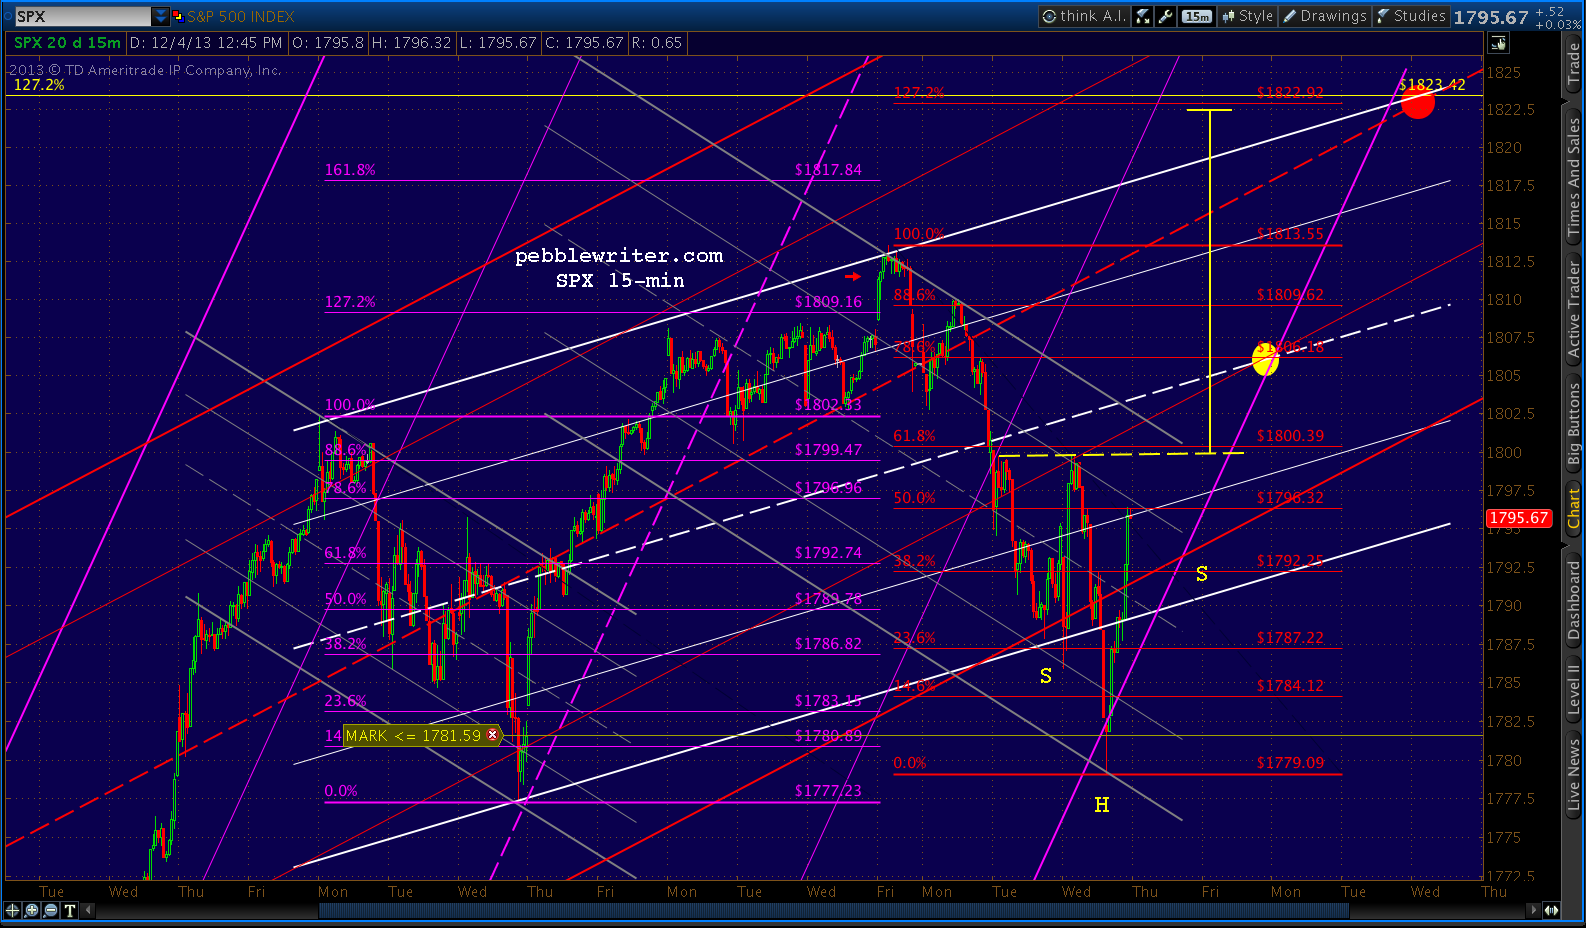
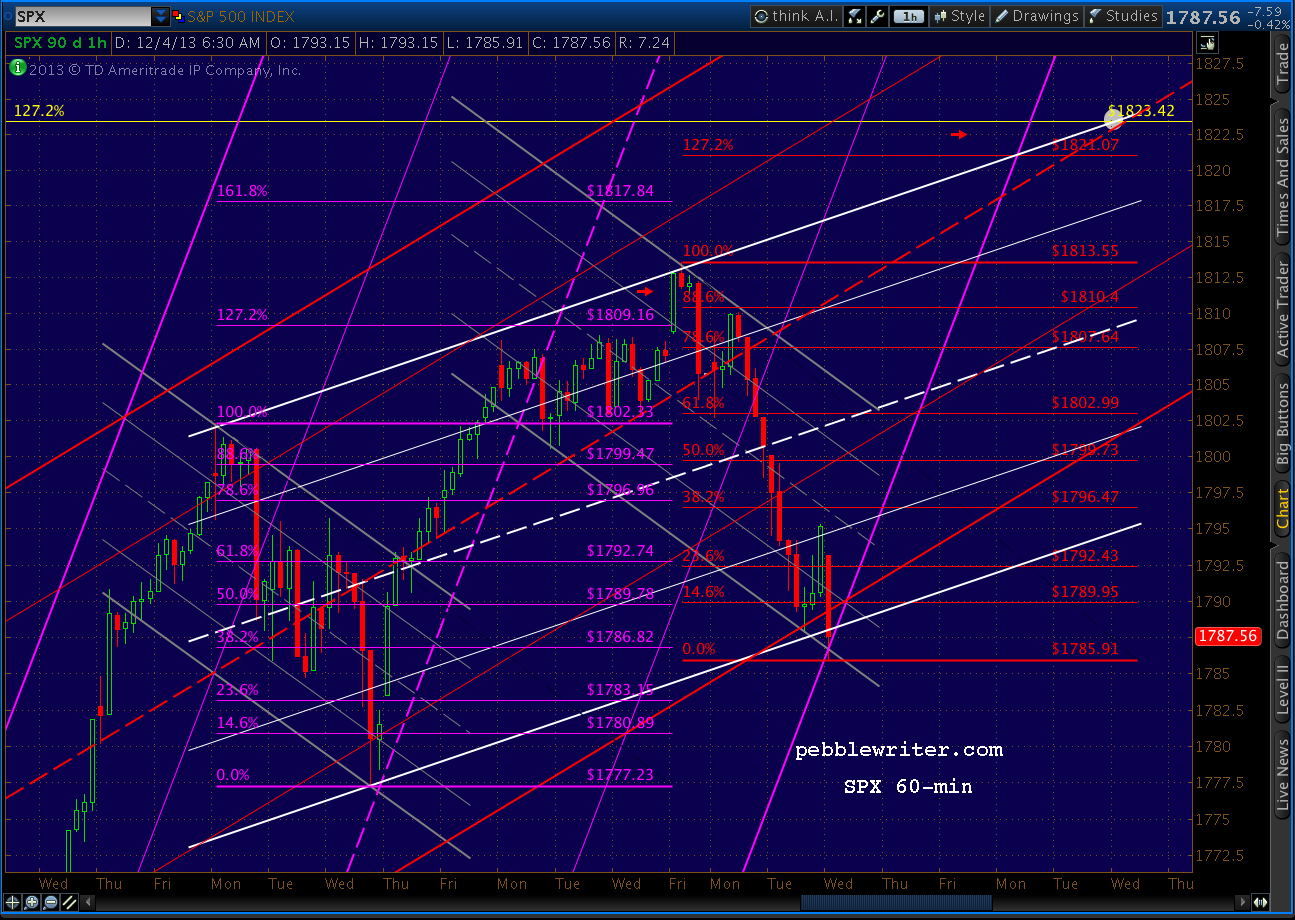 The red dip of 27.64 points took 18 hours. A rise to 1823.42 exactly (the 1.272 extension of the drop between 2007 and 2009) would comprise 37.51 points — a 1.35 extension. 1823.42 would be 2.37 points higher than the 1.272 extension. Timing = about 11:30 on Dec 11th.
Although many would argue whether “1.382” is a legitimate Fibonacci-derived extension, it works often enough in real life to suggest it’s effective.
Another way to look at this would be to apply the 1.44X extension to the 1813-1785 drop — yielding a final target of 1825.91. I can certainly live with that.
It will help the comparison if the initial thrust of this move is a veritable straight shot, with very few pullbacks of any consequence. The purple pattern paused for about 2 hours and 3 points around the .618, .786 and 1.000 fib levels.
I’ll be watching to see if we get a 3-pt pullback from 1803 to 1800. If my chart is very accurate, it will occur around the intersection of the falling grey channel top and the rising white channel midline at around 11:30 this morning.
UPDATE: 10:45 AM
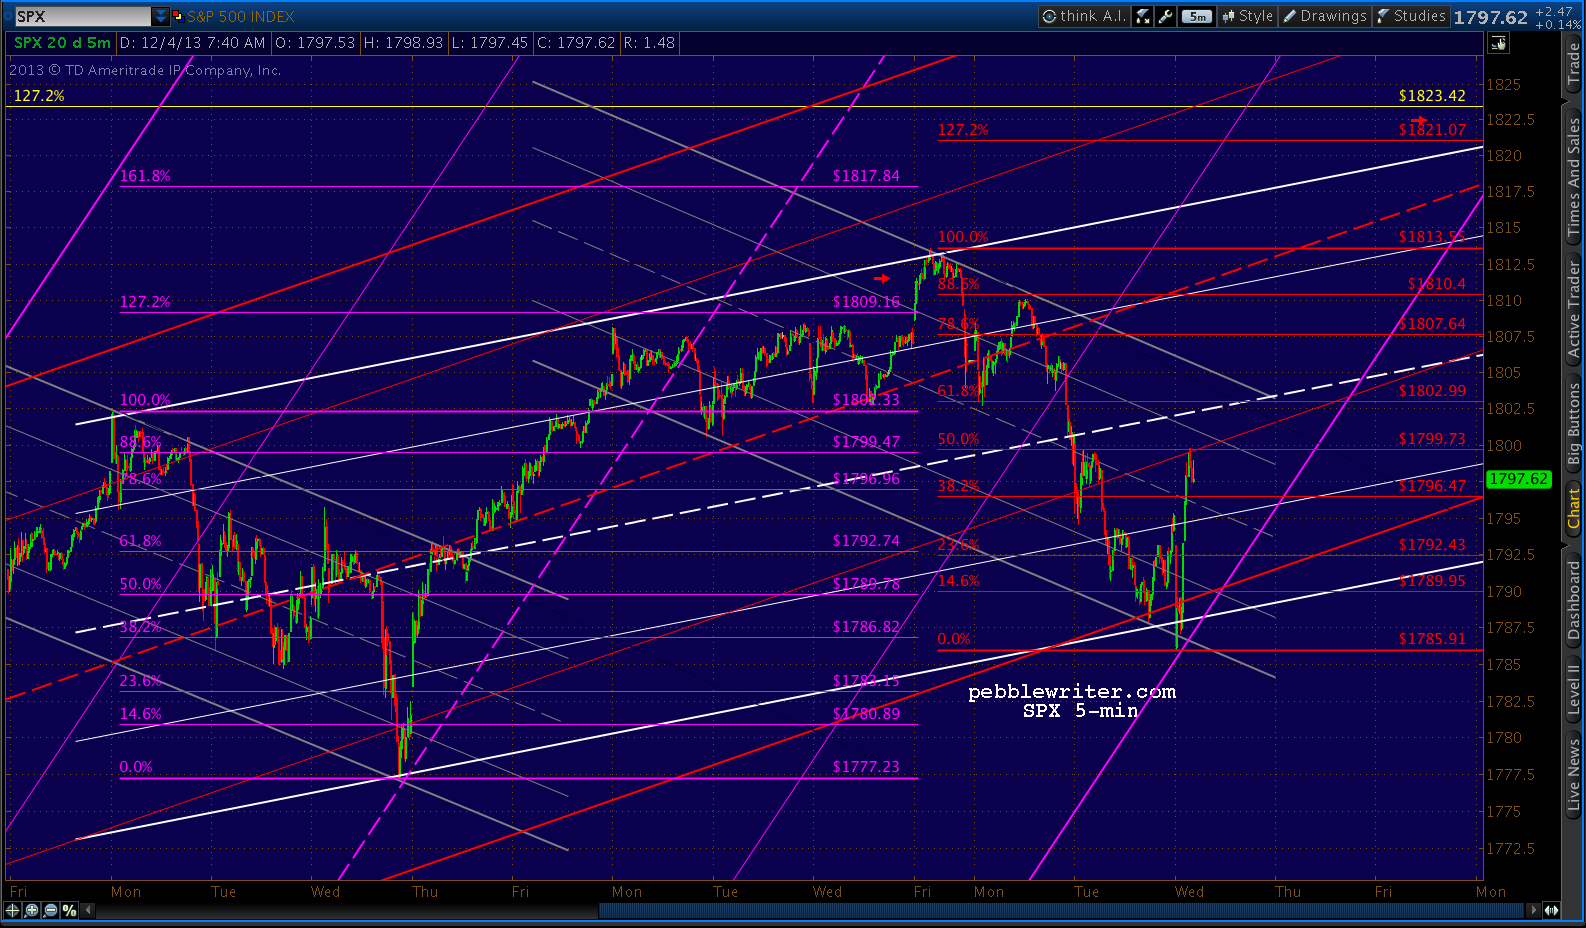
Here’s a peek at the 5-min chart, the better to see all the squiggles. So far, so good.
UPDATE: 12:15 PM
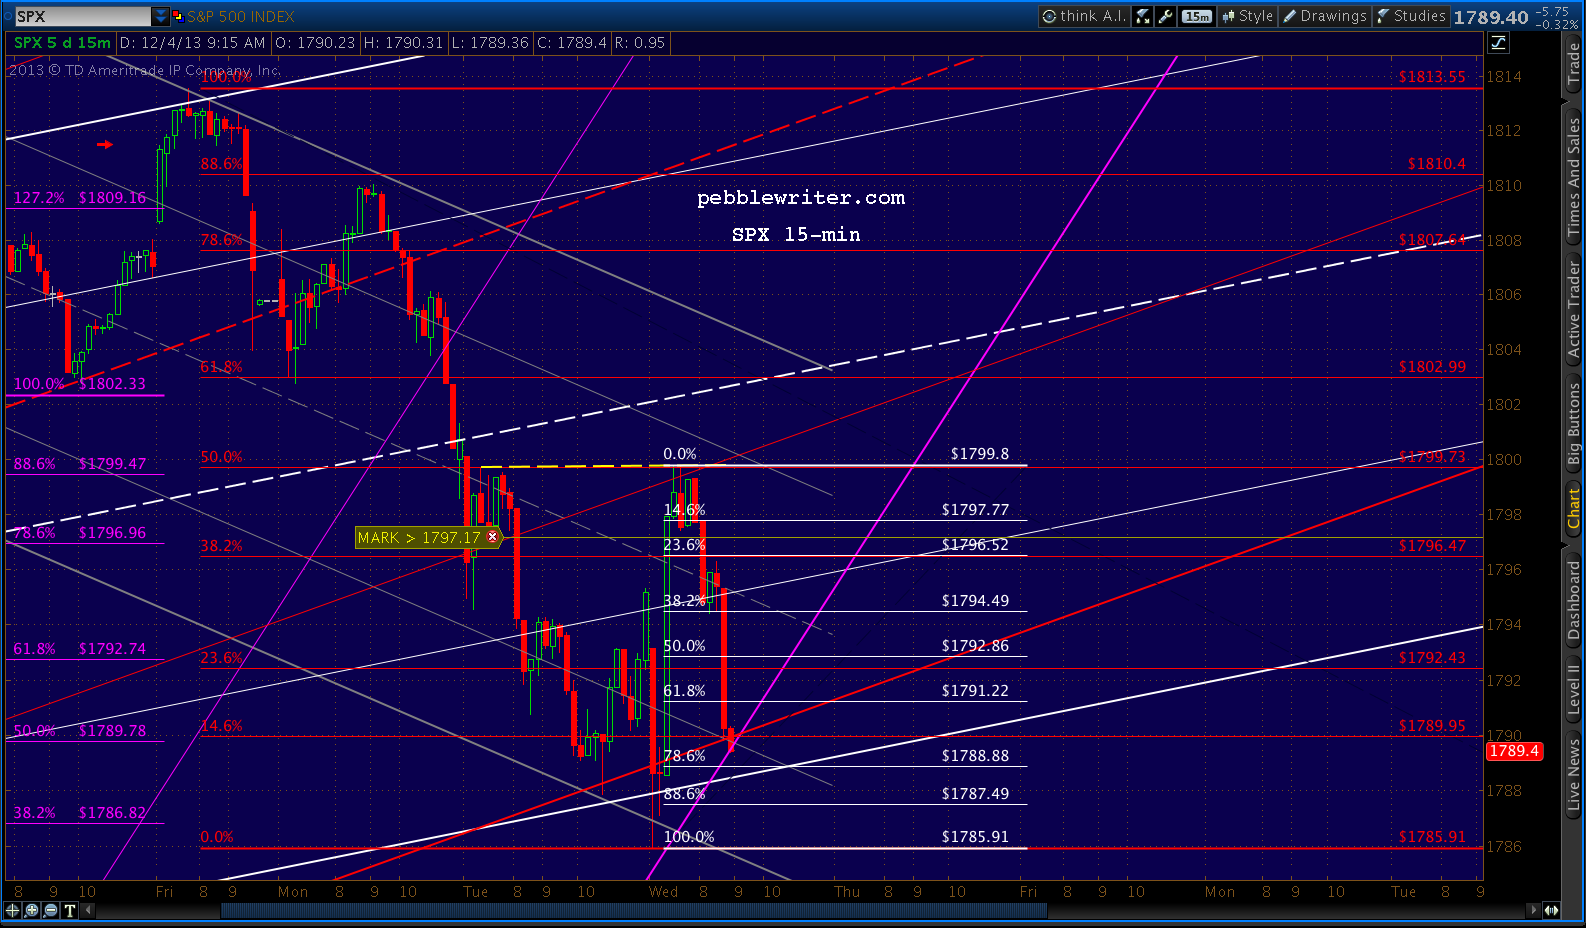
So much for the “straight shot.” Both ES and SPX are closing in on a .786 retracement of this morning’s rally off.
I suspect it’s more of the stop-clearing that’s made the past several weeks such a joy (sarc): deep retracements, break-outs that don’t break out, break-downs that don’t break down.
Look for a turn at ES 1787.71/SPX 1788.88 or ES 1786.21/SPX 1787.49.
UPDATE: 3:35 PM
Another day, another deep retracement. The .886 levels held, and SPX and ES have both climbed back into the rising red channel and the white channel.
I’ve expanded the second falling grey channel to accommodate the drop, and it’s not a bad fit.
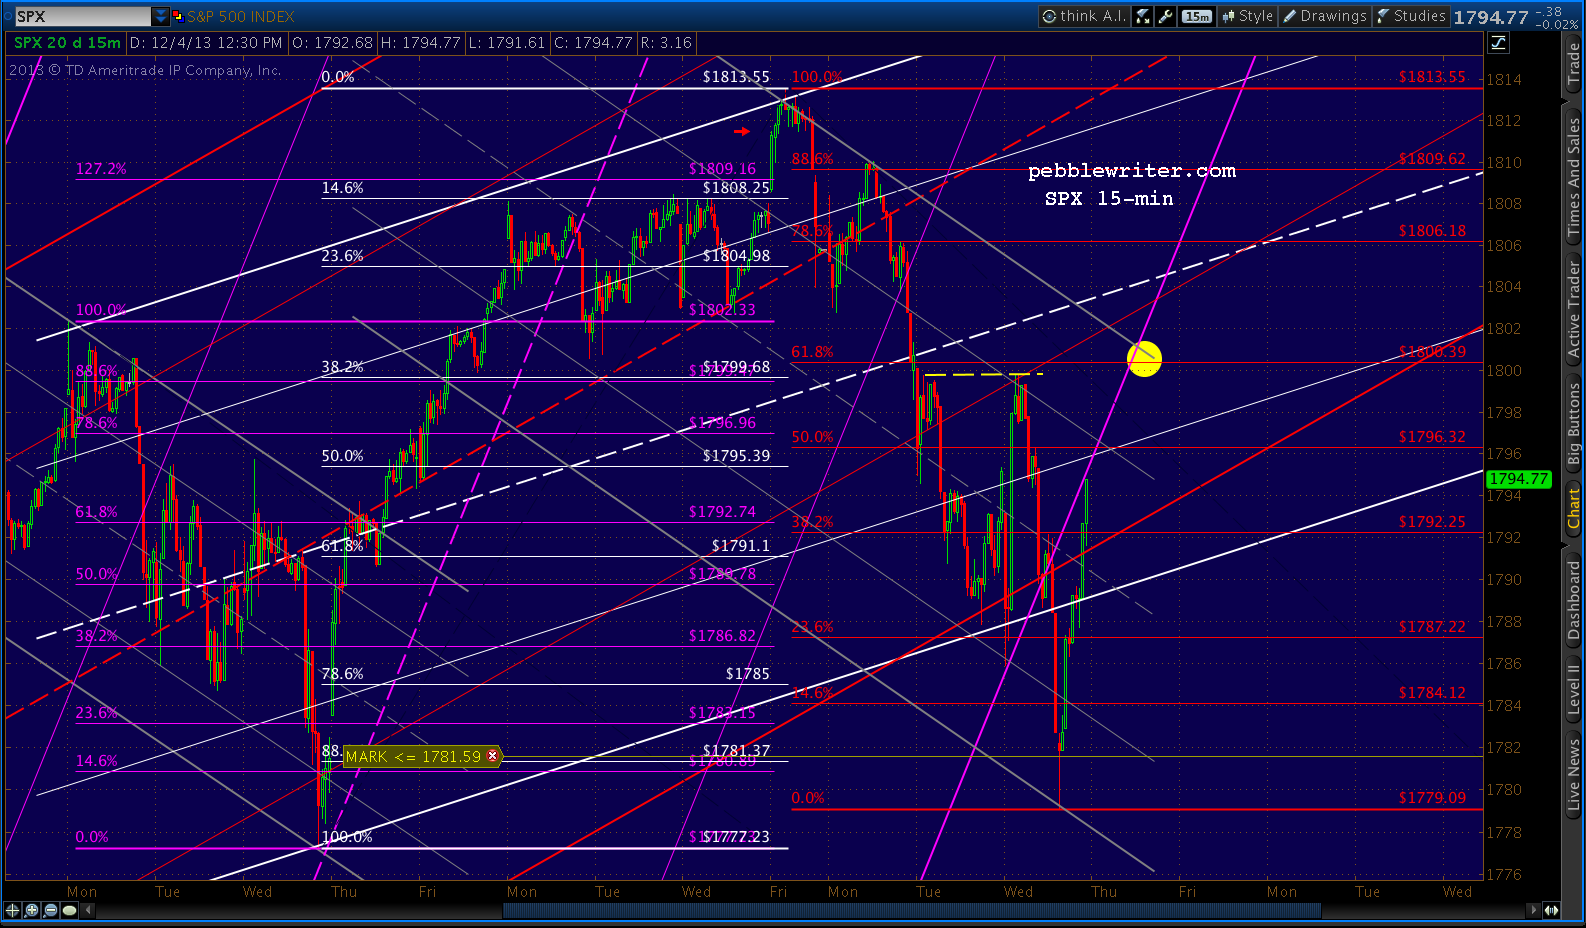 Even better for our forecast, however, is the fact that the 1.272 extension of the drop from 1813.55 to 1779.09 is exactly 1822.93. Ring any bells?
It wouldn’t hurt to put in a nice dip at the new .618 to set up an inverted H&S Pattern.
Comments
2 responses to “Is it Safe?”
Started out this am thinking you were pretty damn smart with that analog thingy. Spent the next couple hours questioning your sanity. Polished off the day really, really glad you’re managing my money.
Hi PW,
The April 2010 turn occurred 9 points shy of the .618, and the May 2011 Gartley completion ended 11 points shy. Watching most of the technical indicators roll over, I have to wonder how likely you think it is that 10 points shy of 1823 is all we get?